Is #NOTUSDT About to Explode or Plunge? Key Levels to WatchYello Paradisers! Are you ready for what could be a game-changing move in #NOTUSDT? Let's look at the latest analysis of the #NOT and see what's happening:
💎Currently, #Notcoin is tightly coiled within a falling wedge, a classic pattern that often signals a massive bullish breakout. Let's see what could be the next probable moves for the asset.
💎If the bulls gather enough strength, we could soon see a breakout from this formation that could ignite a powerful upward wave. Our first target? The bearish order block (OB) at $0.012. If momentum holds, we could even see a push toward the major resistance level beyond that.
💎But let's not get ahead of ourselves. Caution is crucial. Should the bulls fail to muster the necessary force, we could be looking at a slide toward the lower support zone between $0.0057 and $0.0071 as it hunts for liquidity.
💎And remember, if the major support zone doesn't hold, then the selling pressure will only increase, potentially driving GETTEX:NOT further down.
Stay focused, patient, and disciplined, Paradisers🥂
MyCryptoParadise
iFeel the success🌴
NOT

NOTHING !!NOTCOIN is forming a falling wedge on Daily timeframe , Up we go if we do breakout. the price can be bullish and I expect the price to go up to the Fibonacci line of 0.618 = 0.0013 Stay tuned for more updates, thanks.
✨Traders, if you liked this idea or have your opinion on it, write in the comments, We will be glad.
_ _ _ _ __ _ _ _ _ _ _ _ _ _ _ _ _ _ _ _ _ _ _ _ _ _ _ _ _ _ _ _
✅Thank you, and for more ideas, hit ❤️Like❤️ and 🌟Follow🌟!
⚠️Things can change...
The markets are always changing and even with all these signals, the market changes tend to be strong and fast!!
NOTUSDT has formed a Pretty Big falling wedge Pattern!...Notcoin is forming a falling wedge on Daily timeframe , Up we go if we do breakout.
✨Traders, if you liked this idea or have your opinion on it, write in the comments, We will be glad.
_ _ _ _ __ _ _ _ _ _ _ _ _ _ _ _ _ _ _ _ _ _ _ _ _ _ _ _ _ _ _ _
✅Thank you, and for more ideas, hit ❤️Like❤️ and 🌟Follow🌟!
⚠️Things can change...
The markets are always changing and even with all these signals, the market changes tend to be strong and fast!!

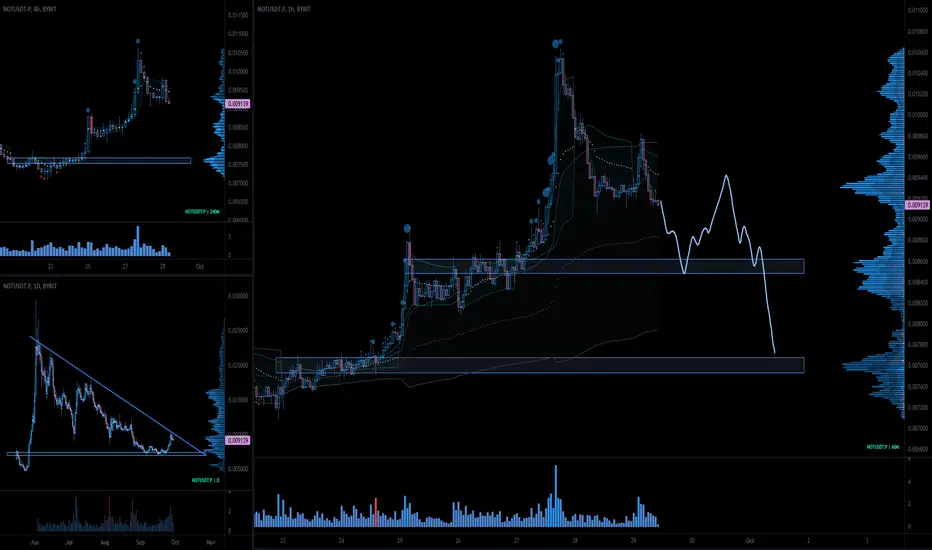
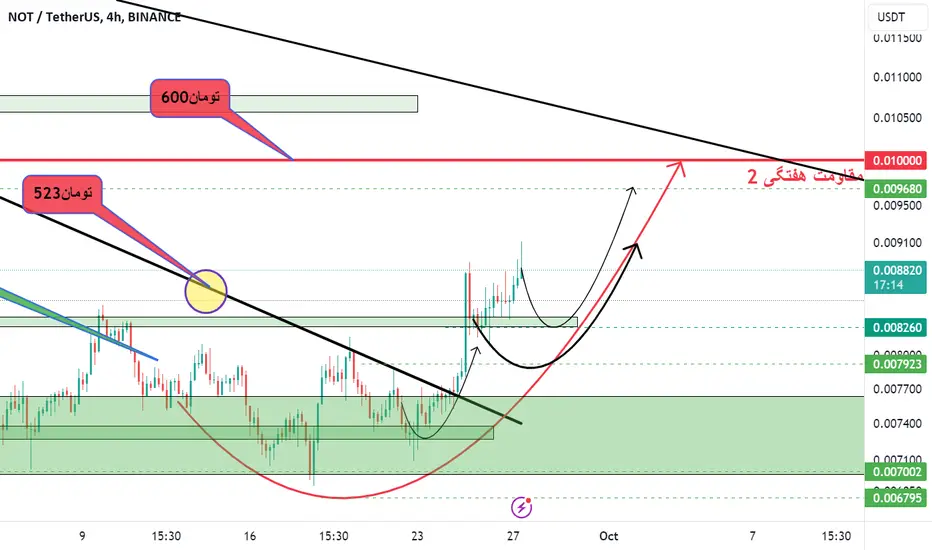
$NOTCOIN Failed BreakoutNotcoin (NOT) made an attempt to break out of its daily chart wedge but faced another rejection.
$0.010 is acting as the strong resistance so far
4H Timeframe:
The support level is between 0.0078 and 0.0076, and I'm anticipating a move down to this area soon.
1-Hour Timeframe:
We're seeing a strong rejection, with lower timeframe support around 0.0085 to 0.0082. Any bounce from this level is likely to be short-lived, potentially reaching 0.0090 to 0.0094.
Any rejections we get at .0090 to .0094, we will be looking to short, targeting .0078 to .0076 area
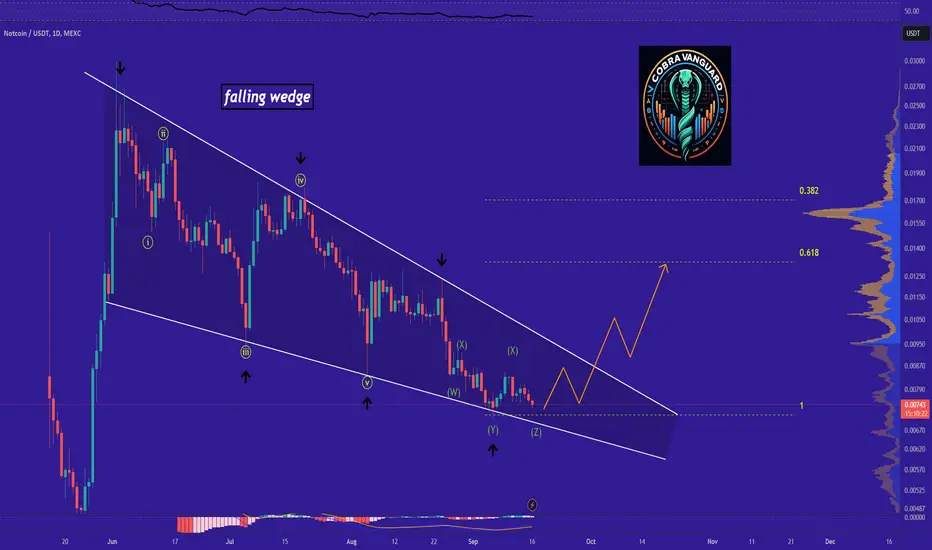
NOT's Situation: What Shall we Expect !!!COINEX:NOTUSDT
Finally, Notcoin was able to break the wedge as I mentioned. Now, reaching the targets shown in the chart is not out of reach!!!
Previous Analysis
✨We spend hours finding potential opportunities and writing useful ideas, we would be happy if you support us.
Best regards CobraVanguard.💚
_ _ _ _ __ _ _ _ _ _ _ _ _ _ _ _ _ _ _ _ _ _ _ _ _ _ _ _ _ _ _ _
✅Thank you, and for more ideas, hit ❤️Like❤️ and 🌟Follow🌟!
⚠️Things can change...
The markets are always changing and even with all these signals, the market changes tend to be strong and fast!!

NOTUSDTNOT ~ 1D ✅
#NOT Make purchases gradually after breaking through the resistance line of this descending pattern.
Analysis of NatCoin NOT in the path of growth Be careful, dangerDespite the growth it has shown, NatCoin is still in a daily downtrend.
This currency can continue to grow more up to the said resistance and the ceiling of the channel.
It should be updated again at the most important weekly resistance of this currency.
Friends who intend to enter for the long term should wait for the weekly resistance to break.
And friends who want to enter risk can act now and set their loss limit at the mentioned price.
NOT, will 'not' leave you disappointed, Enormous Growth ahead.Notcoin is a game developed by Open Builders where players can earn in-game cryptocurrency, also called Notcoin, by tapping the screen repeatedly.
The game’s phenomenal success and Notcoin’s achievement of a $2 billion market capitalization in less than six months since launch are worth discussing.
Developed by Open Builders, a team known for creating viral social games,
the project aims to bring users into the Web3 space on The Open Network (TON) blockchain, which is directly linked to Telegram.
-------------------------
NOT has reached an All time highs recently reaching as high as 0.028, but later on corrected healthily to 0.020 base range which is holding steadily.
A new attempt has been spotted today at the current price area with high probability of an ascend continuation. A revisit to 0.028 area with a possible strong break of that peak range is high.
NOT has huge following, and volatility of this coin is very high which is a good thing (and of course, the opposite is true if you can't time your entry perfectly).
The current range is showing some good seeding opportunity.
Spotted at 0.0210
Interim target at +50%
TAYOR.
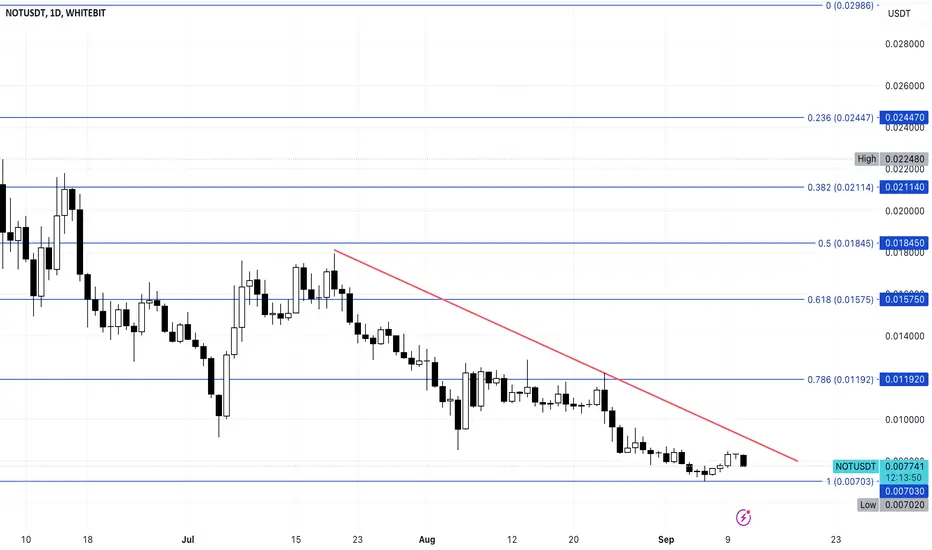
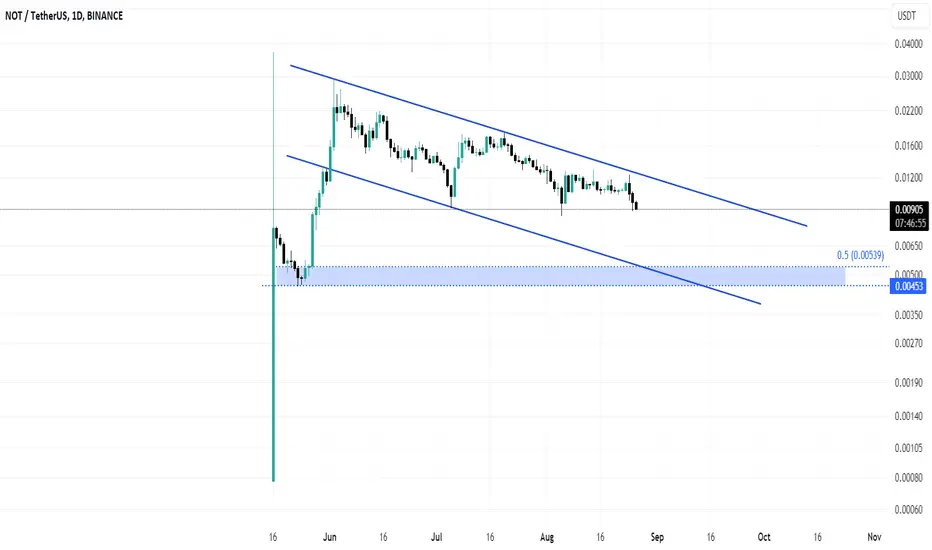
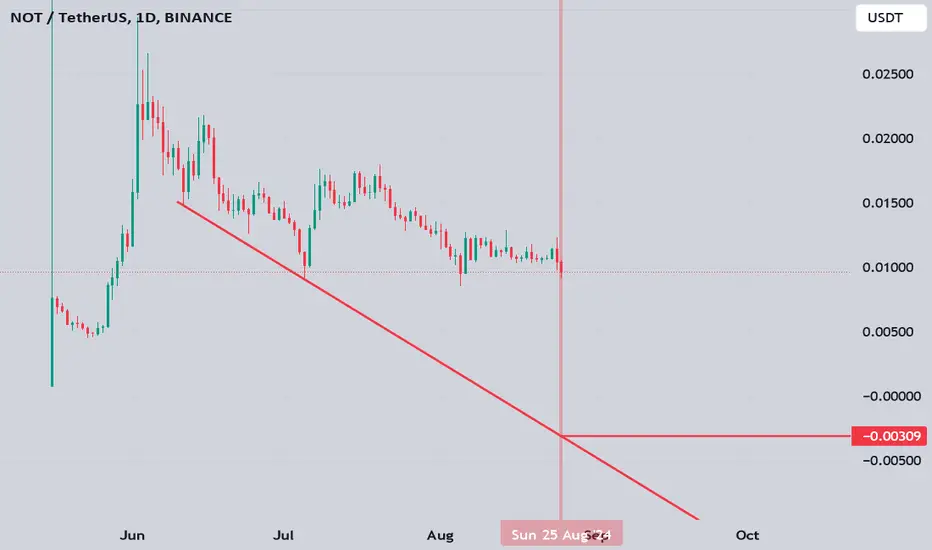
Notcoin (NOT) price may go to ALL-TIME LOW in the nearest futureNotcoin (NOT) bears have a clear objective: to push the altcoin’s price back to its all-time low of $0.005. This is reflected in the token’s struggle to break above the descending trend line it has traded below since July.
Coupled with declining network activity, the Telegram-linked token could face an additional 29% drop in price.
The analysis of Notcoin’s one-day chart reveals that the asset has been moving under a descending resistance line since July 20. This pattern indicates a bearish trend, suggesting a gradual decline in the asset’s price.
NOT’s 4% price increase over the past week suggests an effort to break above the descending resistance line. However, if this attempt fails, it will likely signal a rejection of the uptrend and a continuation of the downtrend.
The token’s declining network and whale activity further reinforce this outlook. On-chain data indicates a decrease in both daily active and new addresses trading Notcoin. Over the past week, daily active addresses for NOT dropped by 17%, while new addresses created to trade the altcoin fell by 16%.
Despite the 4% price rise over the past week, bearish bias trails Notcoin. This is reflected in its persistently negative Elder-Ray Index, which measures the bull-bear power in the market. This indicator stands at -0.00024 at press time, suggesting that bear power is dominant.
If the attempt to break above the descending trend line fails, NOT will resume its downtrend. As selling pressure mounts, it may fall toward its all-time low of $0.0048, which it last traded at on May 24.
However, if the token witnesses a shift in market sentiment from negative to positive, its price may climb toward $0.011, invalidating the bearish projections above.
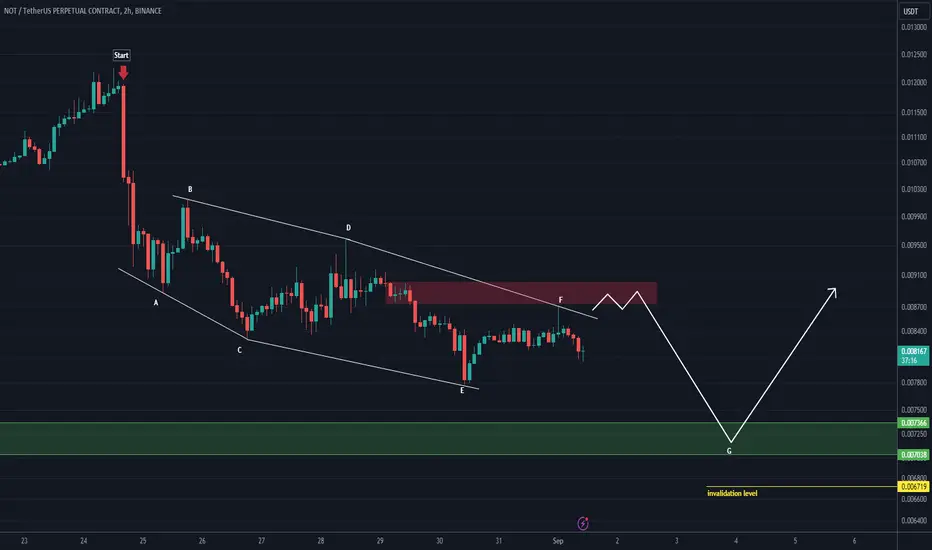
NOT analysis (2H)On the hourly time frames, a diamond diametric can be seen on the NatCoin chart.
It can move from the red range to the green range and then reject upwards in the green range.
We are looking for buy/long positions in the green range.
Closing a daily candle below the invaliation level will violate the analysis.
For risk management, please don't forget stop loss and capital management
Comment if you have any questions
Thank You
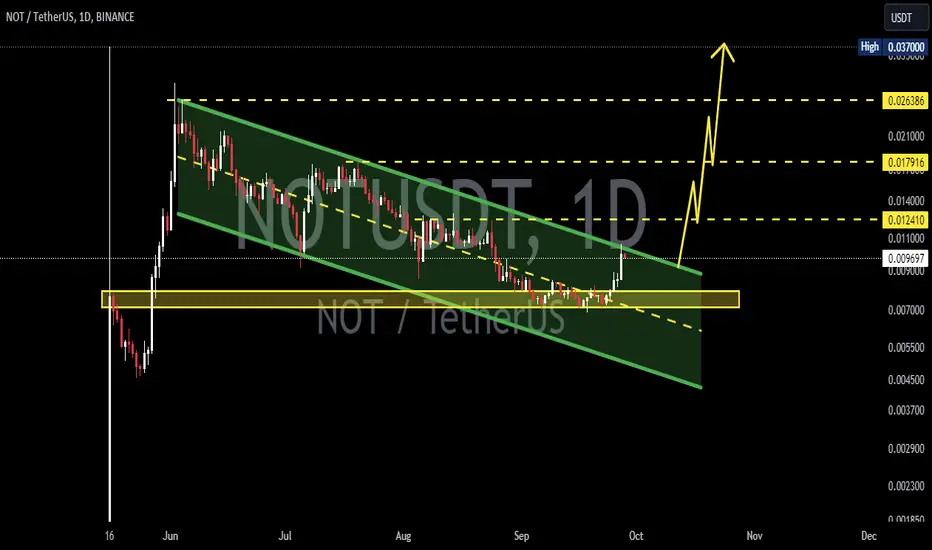
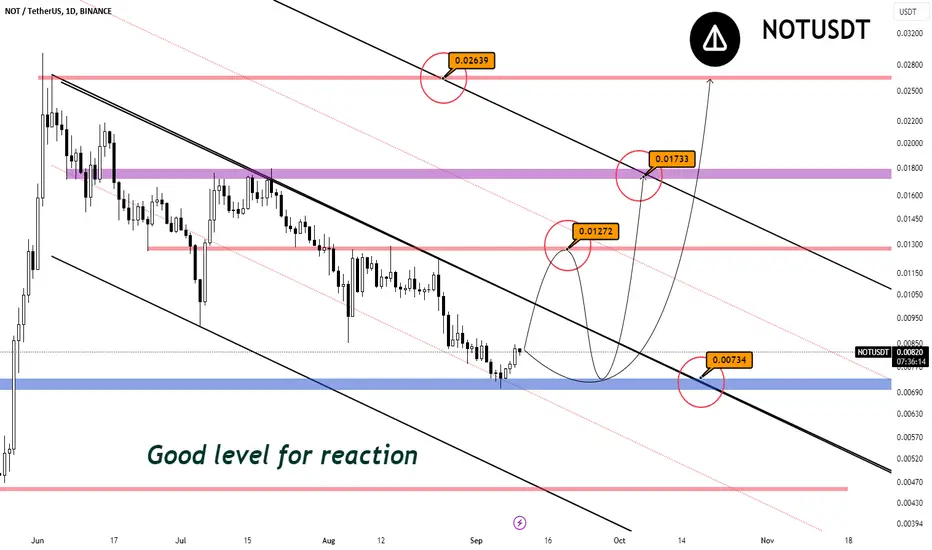
NOT best level🔍 **NOT/USDT Technical Analysis - Opportunities and Challenges**
📉 **Current Trend:** The price is moving within a descending channel, indicating overall weakness in the trend. However, it seems to have reached a strong support level that could be a turning point. 📊
🔵 **Key Support Level (0.00734):**
This support level, marked with a blue zone, has historically shown price reactions. There's a high probability of a price rebound from this area, which could create a good buying opportunity if the price stabilizes here. 💪
📈 **Potential Upside Move:**
There are several key resistance levels for potential price targets:
1️⃣ **First Resistance: 0.01272** - A break above this level would indicate confirmation of an upward trend.
2️⃣ **Second Resistance: 0.01733** - A stronger resistance level that the price may reach with increased demand.
3️⃣ **Third Resistance: 0.02639** - The final target and highest level in this analysis, which could be reached if the previous resistances are broken.
⚠️ **Risk Management:**
While there’s a good opportunity to enter the trade at current levels, risk management should always be a priority. If the price fails to hold this support level and drops below it, the downtrend may continue. 📉
🚀 **Conclusion:**
This analysis suggests that the 0.00734 level is a crucial point for a price reaction, and a potential upside move could lead to the mentioned targets. The best strategy is entering at support levels and carefully managing risk. ✨
NOT The bottom is near..BINANCE:NOTUSDT
This idea has a long-term profit target.
All targets are indicated on the graph.
- Risk 1-3% on deposit
- R/R min 1/2
P.S (This is not an investment recommendation, this is my personal opinion.)

NOT/USDT: POTENTIAL FALLING WEDGE PATTERN! ACCUMULATE HERE!!Hey everyone!
If you're enjoying this analysis, a thumbs up and follow would be greatly appreciated!
NOT/USDT looks good here. It is forming a falling wedge-like structure in the daily time frame and currently hovering near the lower trendline of the wedge. It is a good area to accumulate some on the spot or with low leverage.
Entry range:- $0.0070-$0.0076
Target:- 150-200%
SL:- $0.006(For leverage)
What are your thoughts on NOT's current price action? Do you see a bullish pattern? Share your analysis in the comments below!

Notcoin By HesamUNTHey traders
As u can see, not still playing in the 4H falling wedge
The lower trendline which is below the 0.236 fib can b a gr8 entry
Breaking out the pattern will b one of the confirmations
Also ichi still playing bearish, breaking up the SenkouA in daily n 4H TF will b the second confirmation
What u think about notcoin?
Share ur chart n leave a comment

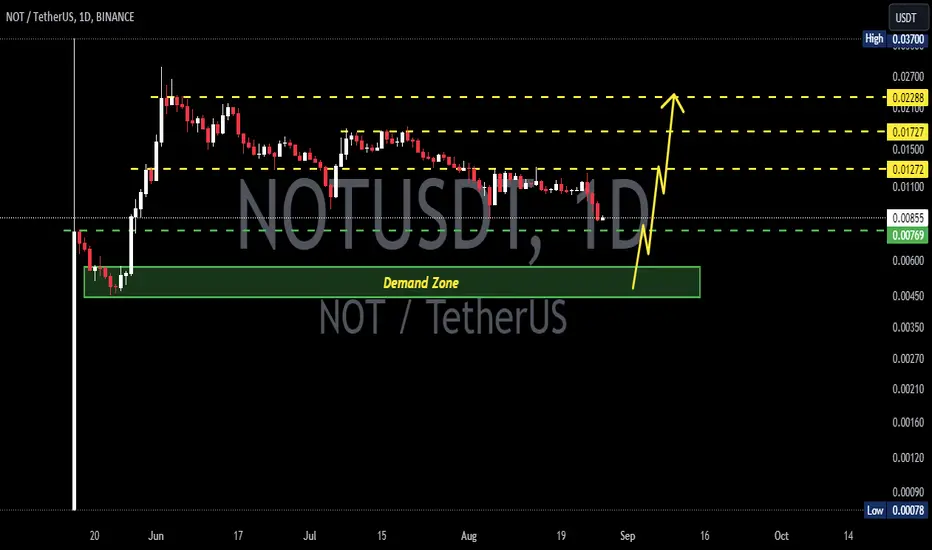
Potential for upward movementNOT is in a downtrend and has reached the $0.0075 support level. This level is recognized as a strong support that could prevent further price declines and increase the likelihood of a price rebound towards higher levels.
One possible scenario is that the price finds support at the $0.0075 area and, after observing bullish confirmations, moves towards higher levels such as $0.010 and $0.012. This movement could indicate the end of the current downtrend and the beginning of a new upward trend.
If the price fails to hold the $0.0075 level and breaks it, the downtrend may continue, pushing the price to lower levels. This scenario would indicate increased selling pressure in the market.

NOT COIN PRICE ANALYSIS AND NEXT POSSIBLE MOVES !!GETTEX:NOT Coin Update !!
• Keep your eyes on GETTEX:NOT Coin OR Add it in Your Fav Coin List ⚡
• I am Expecting now mega pump in its price in next Few days ( untill its price holding its current support )
• Without SL Don't Build any Trade 🚨
Warning 🚫
Its just my analysis and trade idea not a trade setup....!!

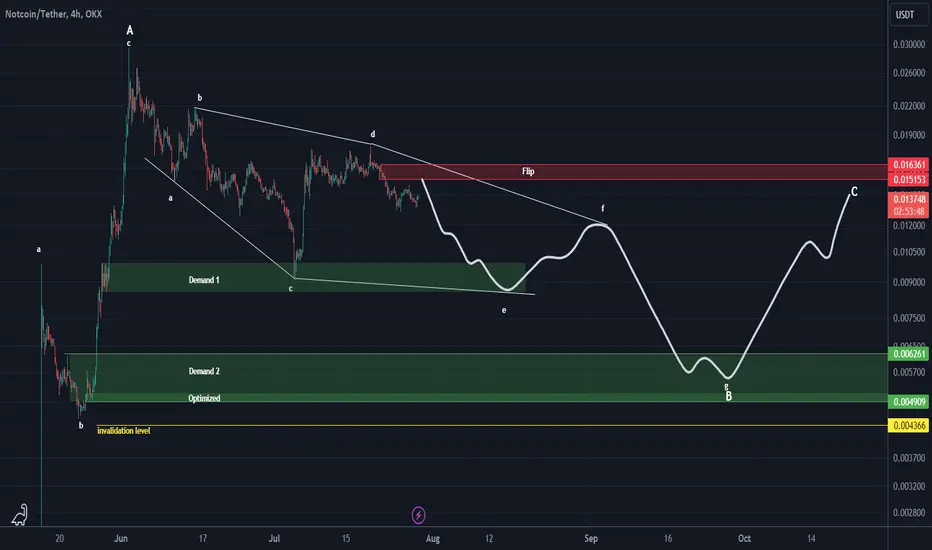
Where to buy NOTCOIN?NOTCOIN data is small and therefore it is a bit difficult to predict the next movements.
But with the data we have on the chart, it looks like we have a big ABC on the chart that wave B is a diamond diametric that we are now in wave E of this diametric.
As long as it is below the FLIP range, it is bearish.
You can look for buy/long positions on demand.
demand 2, can strongly reject the price upwards.
For risk management, please don't forget stop loss and capital management
Comment if you have any questions
Thank You
NOTUSDTNOT ~ 1D
#NOT Due to GETTEX:FUD reasons from the arrest of the Telegram Founder and this affecting the Main Coin CRYPTOCAP:TON ,. It's not too bad to place a purchase on this demand Zone Block.
NOTcoin📊 #NOTUSDT
⏱ TIME: 1D
📝The price is moving towards the desired support area of the blue box in a descending channel. The blue box seems to be a good shopping area.
⭕️risk: high
📍The initial buy limit: 0.005
❌These analyzes are just to give a better perspective for you dear ones
Do not base on buying and selling❌
NOTcoin chartAnalysis by Amadarz✅
This chart for NOT/USDT suggests a bearish trend that is now consolidating, with a descending trendline. Here's a breakdown of the setup:
1. Current Price : 0.01061 USDT 📉.
2. Trendline Break : The setup is recommending to wait for a break of the descending trendline ⏳ before entering a long position. This is crucial as it would signal a potential trend reversal or bullish continuation 📈.
3. Second Entry : There’s a potential second entry at 0.00912 USDT 🚪, a key level based on previous support.
4. Target Levels 🎯:
- TP1 : 0.01114 USDT 🟢 (minor resistance level).
- TP2 : 0.01229 USDT 🟢 (further resistance).
- TP3 : 0.01435 USDT 🏁 (approaching a significant resistance).
5. Stop-Loss Zones : Recommended stop-loss is between 0.00907 USDT and 0.00857 USDT 🔴, just below the recent major swing low.
Key Observations:
- Risk Management : The stop-loss below 0.00912 ensures solid risk control 🔒, protecting your downside below the recent low.
- Action Plan : If the trendline breaks with strong volume or bullish confirmation 🚀, consider taking profits at the targets in sequence, with TP1 being conservative, and TP3 offering the maximum reward 🎉.
Keep an eye 👀 on the volume and price action around the trendline for confirmation of the breakout!

NOTUSDT & TON total delistingThe telegram director was arrested in France. Its service will be closed all over the world and crypto projects will be subject to delisting from exchanges as they pose a threat of losses to users. Their price will only go down without knowing the limit. Good luck to everyone and beware of TON-based scam projects.
NOT COIN PRICE ANALYSIS AND NEXT POSSIBLE MOVES !!GETTEX:NOT Coin Update !!
• #NOT Coin Price droped Becauze CRYPTOCAP:TON Founder get arrested...
• Now near me strong support of GETTEX:NOT Coin is 0.085$-0.080$ area ✅
• Without SL Don't Build any Long Positions otherwise you will get stucked or Liquidated !!
Jazakallah❤️

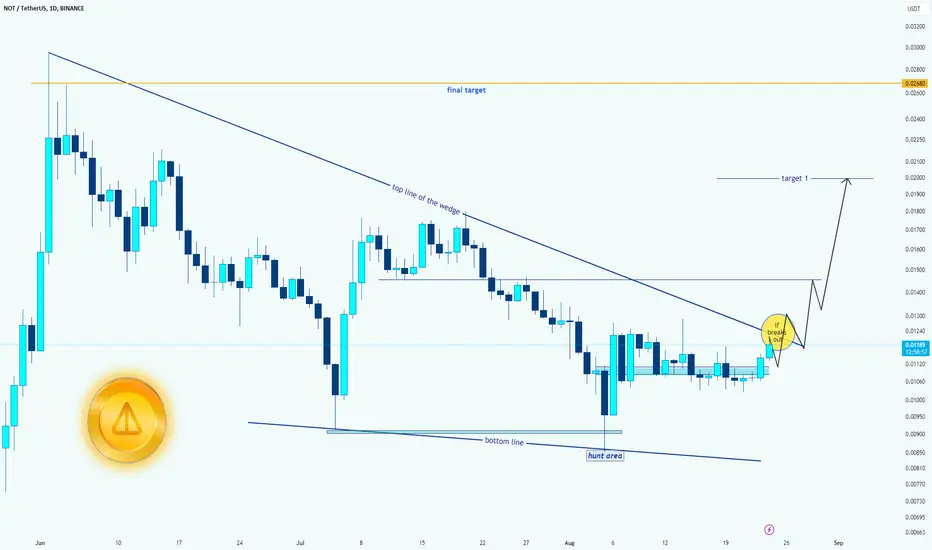
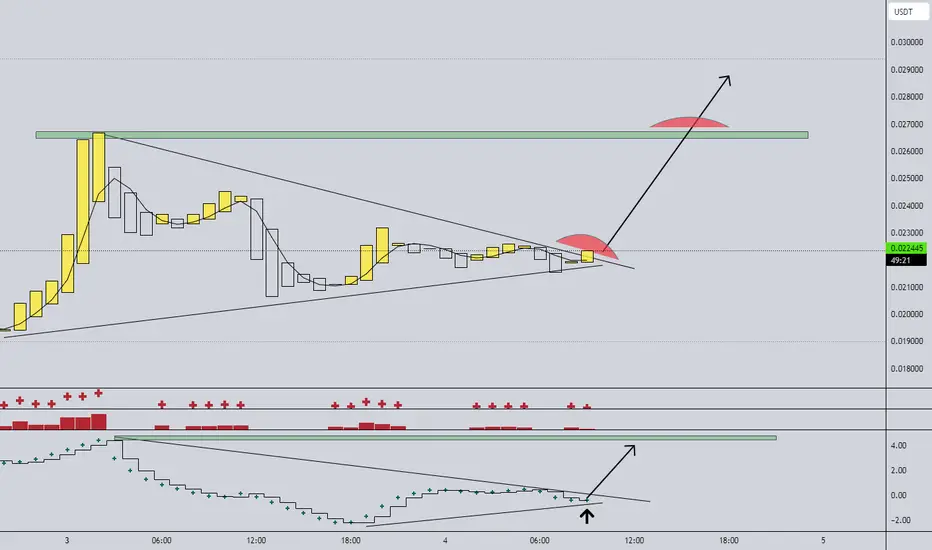
NOT → hold ithello guys.
let's analyze Notcoin. BINANCE:NOTUSDT
Technical Analysis
Descending Wedge: The price has been moving within a descending wedge pattern, typically a bullish signal that could lead to a breakout.
Breakout Potential: The price is nearing the wedge's top line, indicating a possible breakout. If the price breaks out, it could rally towards the first target of $0.0200.
Hunt Area: The price found support in the "hunt area," which suggests accumulation and potential for upward movement.
Final Target: The overall target, if the bullish momentum continues, is set around $0.0268.
Bullet Summary
Pattern: Descending wedge suggests bullish breakout potential.
Immediate Target: First target at $0.0200 upon breakout.
Support: Price supported in the hunt area.
Final Target: Aiming for $0.0268 if momentum sustains.
___________________________
✓✓✓ Always do your research.
❒❒❒ If you have any questions, you can write them in the comments below, and I will answer them.
❤︎ ❤︎ ❤︎And please don't forget to support this idea with your likes and comment