RIOT to rage harder than a Portland protest? We'll soon see!Alright everyone, listen up.
Let me preface this by saying one thing - I have absolutely no idea what I'm talking about.
But if I've learned one thing so far it's that I need to make the TA work for me. Know what I mean? So let's get jiggy with it.
First of all, let's observe: DAILY
Now there's a lot going on here, so let me make this real simple for you, and let's go top to bottom.
Top orange line = BTC price. Why do we care? Because, this is RIOT blockchain, ya dingus. BTC is ripping and that's a pre-requisite for a good time over at RIOT.
Yellow angled line - I drew this bad boy. Why? Because, I liked the way it looked. I like drawing lines to confirm my own bias, we'll see if she breaks through and does a little bounce, or if it zings through so fast we miss our shot altogether. (And probably chase for a loss)
See all those curvy colored lines? They're all EMA's. Here's the thing - does it matter which one is which? RIOT is on top of all of them, we like that.
Volume was looking spicy today, and I like that little volume average curling up.
Now, please, observe with the addition of MACD and RSI indicators:
First off, I don't know what these indicators mean. MACD has something to do with momentum, I don't really care all I know is I like that blue is about to slip past orange and that little red guy is looking like he's gassed and ready to pass the ball to the green team.
RSI has something to do with volume, I don't know, all I know is when it's over that 70 it could get gassed quicker than Connor McGregor past 3 rounds. That said, there's some room to rock here and she's primed and ready by my estimation.
SO NOW WHAT?
Well, I have no idea. All I know is it's too easy to over think, so I'm not going to. I found some spots on the 2 hour that look like some soft resistances, maybe we'll rip through tomorrow or the next couple days, or maybe we'll reject.
What I do know folks is that we're currently in the zoom zoom zone.
What's the zoom zoom zone???
Well, the zoom zoom zone is the zone at which the ticker has less traveled. There hasn't been much activity in this region, so we're likely to be extra spicy if the volume is there. Price moves quick in the zoom zoom zone.
Feast your eyes:
See those bars on the right? Something about volume in that price zone. Once it gets shallow with some volume these babies peel rubber. Don't take my word for it, use the dang thing, ya turkey.
Anyways, if it starts ripping towards 65 tomorrow don't say I didn't tell you so. Also I drew another line at the bottom because the only thing better than a trend line is 2 that form a triangle. Sometimes when stuff breaks out good things happen (or bad, keep your putties handy.)
If BTC rips overnight chances are we'll see some action here, some support on these levels, who knows.
All I know is, I like the stock.
Notsure

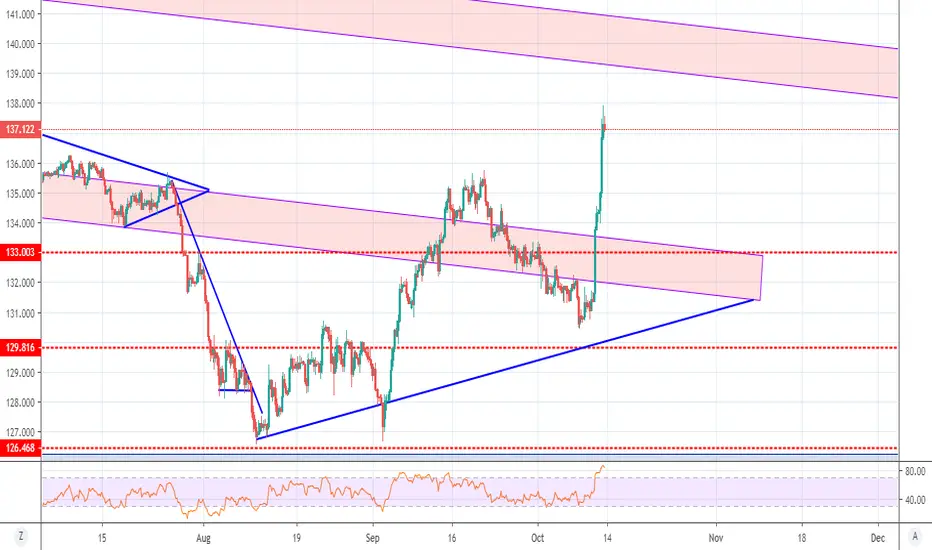
BREAKOUT OF DESCENDING CHANNEL ????NEXT WEEK ???Price shot back into my descending channel , do you think it will break to the upside , i have been avoiding trading any pound pairs lately, however is this recovery long term or short term ?
i stick to what i see on the chart , maybe some fundamental analysis would say otherwise, it would be interesting to get a different perspective.