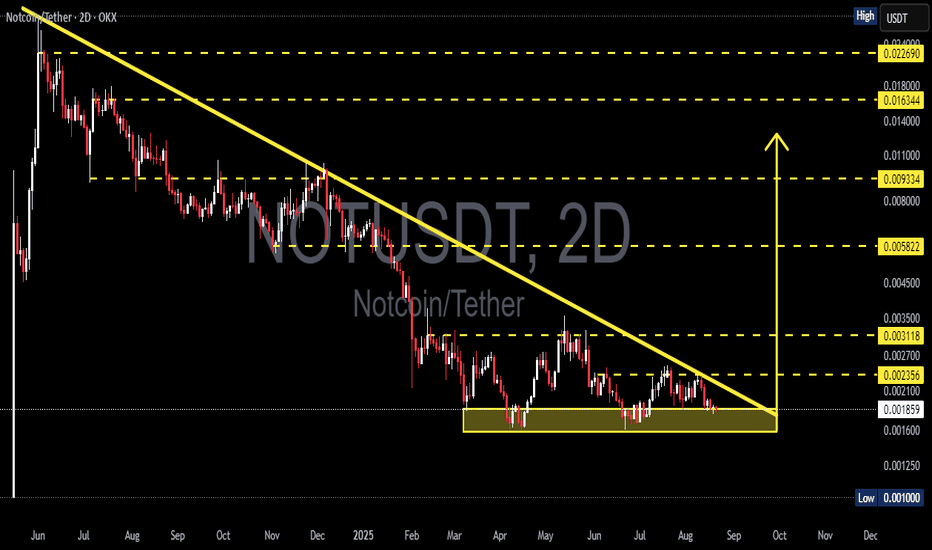
NOTUSDT — Descending Triangle Support! Breakout or Breakdown?Currently, NOT/USDT is trading at a decisive point after a long downtrend. The chart clearly forms a Descending Triangle, a classic pattern that often signals bearish continuation, but under certain conditions can turn into a bullish reversal if a strong breakout occurs.
---
🔎 Pattern & Context
Main Pattern: Descending Triangle (consistent lower highs + strong horizontal support).
Support Zone: 0.0016 – 0.0019 (yellow box). This zone has been tested multiple times, showing buyers are still defending it.
Previous Trend: Strong bearish trend → favors breakdown, but reversal potential remains if bulls manage to break above the descending trendline.
Momentum: Price is being squeezed at the apex of the triangle → a major move is likely imminent.
---
🟢 Bullish Scenario (Upside Breakout)
If price successfully breaks above the descending trendline with a 2D close + strong volume, a reversal setup will be triggered.
🎯 Bullish Targets:
First target: 0.002356 (nearest resistance).
Next targets: 0.003118 → 0.005822.
If strong momentum continues → potential extension toward 0.0093 – 0.0163 (resistance levels shown on chart).
📌 Validation: Breakout + successful retest of the trendline (turning into new support) increases bullish probability.
---
🔴 Bearish Scenario (Downside Breakdown)
If price fails to hold the 0.0016 – 0.0019 support zone, the descending triangle plays out as a bearish continuation pattern.
🎯 Bearish Targets:
Initial target: 0.0010 (previous major low).
If selling pressure accelerates → potential formation of new lows below 0.0010.
📌 Validation: 2D candle close below 0.0016 with strong volume + failed retest = confirmed breakdown.
---
📌 Conclusion & Key Notes
0.0016 – 0.0019 is the key decision zone. Holding it opens the door for a bullish reversal, while breaking it signals continuation of the downtrend.
A major move is approaching as price gets compressed at the triangle’s apex.
Watch out for false breakouts / breakdowns → always wait for volume confirmation.
Strict risk management is crucial, especially for low-cap coins with high volatility and manipulation risks.
#NOT #NOTUSDT #Crypto #Altcoin #PriceAction #TechnicalAnalysis #DescendingTriangle #Breakout #Bearish #Bullish
NOTUSDC
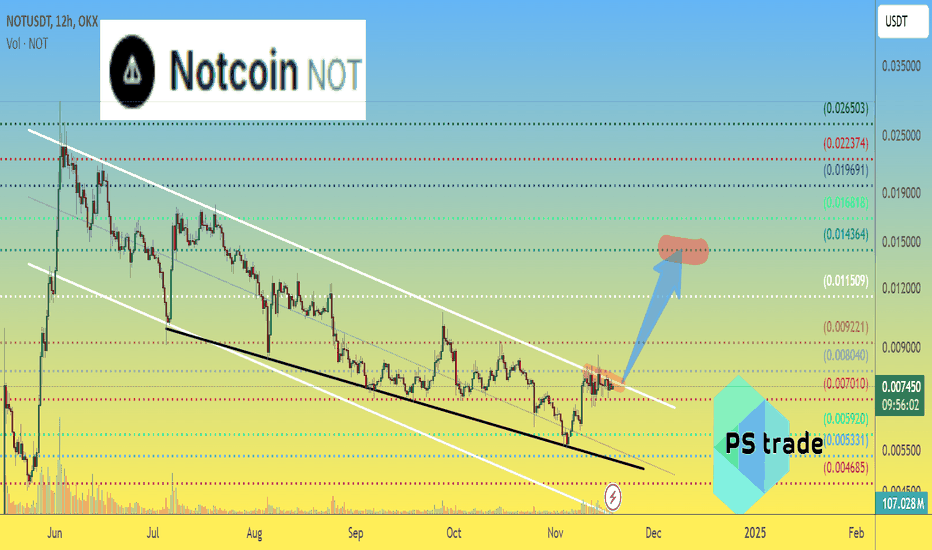
Notcoin NOT price is "hiding" before the momentumIn recent weeks, the prices of many memecoins have shot up, but #NOT has not yet.
The price of OKX:NOTUSDT is already gnawing at the trend line and cannot break through, but sooner or later, it will happen.
Therefore, for the price of #NOTcoin:
1. everything above $0.0070 is a long
2. everything above $0.0080 is a strong long
At least x2 growth should be up to $0.014-0.015
_____________________
Did you like our analysis? Leave a comment, like, and follow to get more
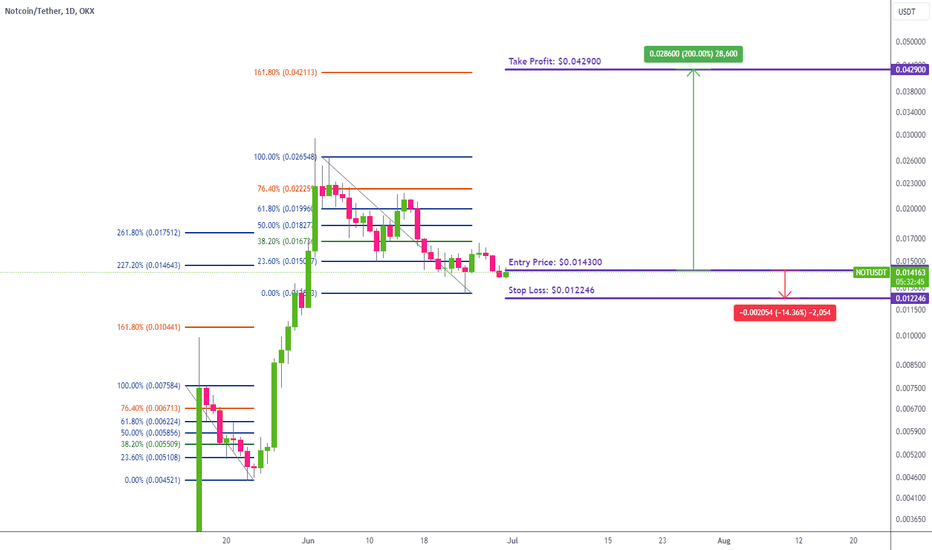
Notcoin Entry price: $0.014300(NOT/USDT) (June 30, 2024) (#Notcoin #Spot)
Notcoin (NOT) — Notcoin is a new meme coin (cryptocurrency) with the potential to become a sensation. It currently functions as a clicker-bot, essentially a gaming application within the Telegram messenger. The objective is to click on the token icon to earn coins, entirely free and accessible to everyone.
dropstab.com
cryptorank.io
🟢 Entry price: $0.014300
🟢 Take Profit: $0.042900
🔴 Stop Loss: $0.012246
• Spot Market without leverage.
• Trade risk set at 50% of the deposit.


