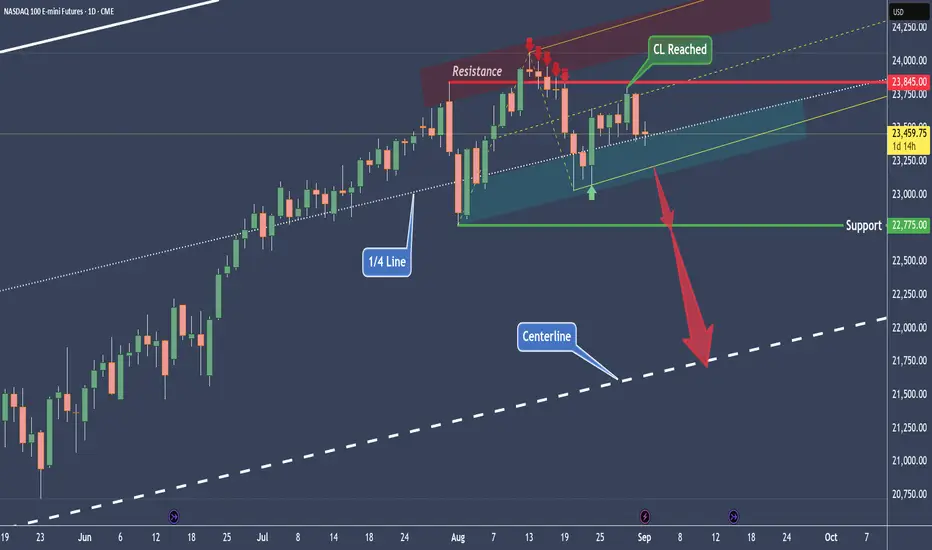
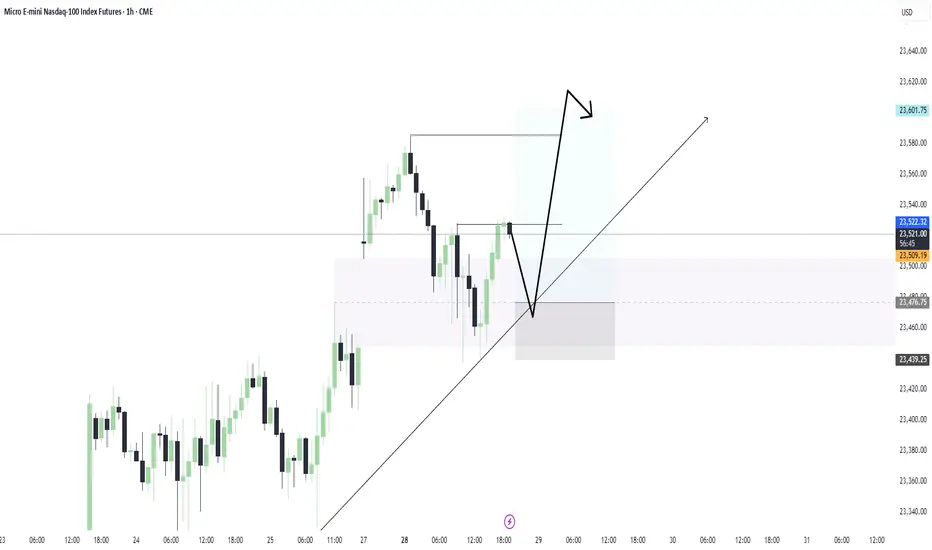
NQ - Nasdaq Short Playbook for the next weeksIn the NQ, they took out the high and then hit it on the head day by day. It finally stopped below the 1/4 line. If you look closely, you see that this was the slanted zone of Support — just like the slanted Resistance.
"As above, so below."
...write me in the comments who said this already a couple hundred years ago §8-)
The small Modified Schiff Fork tells a story too.
Price reached the Center Line and got rejected. Now it's on its way down towards the small Fork's L-MLH. A break of it would indicate further selling ahead.
And the last bastion is the green support level, which stems from the second-to-last prior confirmed Swing Low.
Beyond this level, it's only a question of time before price hits the Center Line.
And — God forbid — below the Center Line, the Sh...t hits the fan. So you better run... behind price with a decent short trade and ride it down to the Abyss.
No worries, I'm with you §8-)
Happy Monday, folks!
Nq!!
Nasdaq Buy ZoneThe Nasdaq has remained strong, but I am not looking to initiate any longer term longs until we can pull back into our buy zone, highlighted in green. If we hold that zone our next push is to the Fibonacci extensions above.
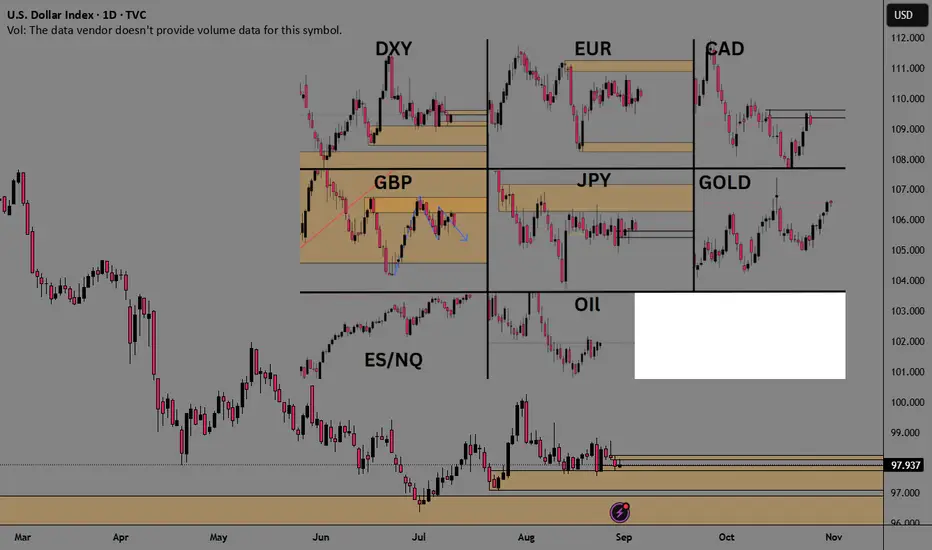
Current Price Action All MarketsWanted to share a picture of the daily TF price action of the major markets.
1) August has been a very slow market for forex. Nothing but chop... Especially over the last 3 weeks.,
2)Stocks and gold have seen a slow grinding uptrend.,
Each market is unique in its own right and benefits not only different types of traders, but also different setups perform better during specific market conditions. It's essential to trade various types of market conditions to suit your style, as well as when you perform at your best and worst.
SPY/QQQ Plan Your Trade Update For 8-26This new video should help you understand the dynamics playing out related to SPY/QQQ, BTCUSD and GOLD/SILVER.
Get some.
#trading #research #investing #tradingalgos #tradingsignals #cycles #fibonacci #elliotwave #modelingsystems #stocks #bitcoin #btcusd #cryptos #spy #gold #nq #investing #trading #spytrading #spymarket #tradingmarket #stockmarket #silver

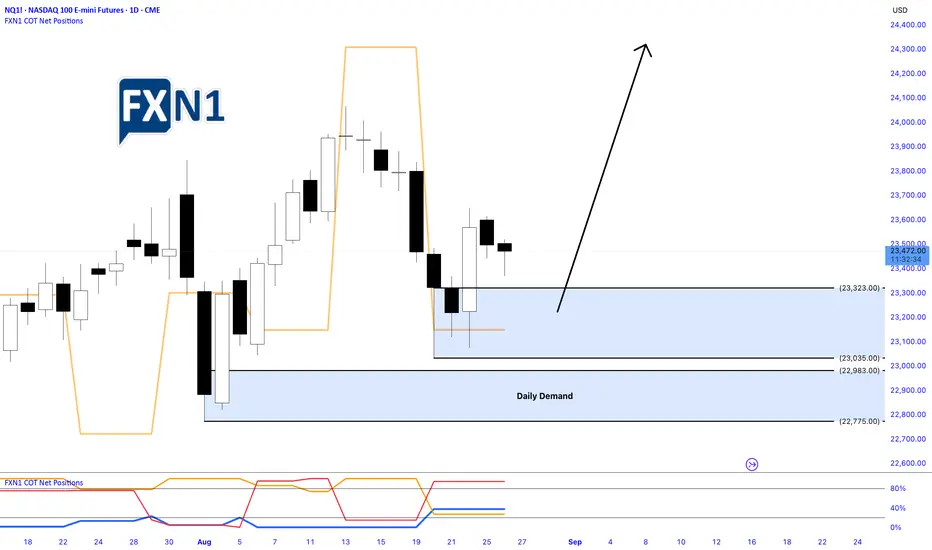
Nasdaq Pulls Back After Friday’s Rally: Identifying Demand ZoneYesterday, the Nasdaq underwent a pullback following a robust bullish surge on Friday. During this correction, a fresh Daily Demand Zone emerged on the chart, signaling potential support levels. Traders are now eyeing this area as an opportunity to position for a possible new high, should the market retrace further today. The current outlook favors a long setup, with anticipation of a continued upward move contingent on the price respecting the identified demand zone.
✅ Please share your thoughts about NQ1! in the comments section below and HIT LIKE if you appreciate my analysis. Don't forget to FOLLOW ME; you will help us a lot with this small contribution.
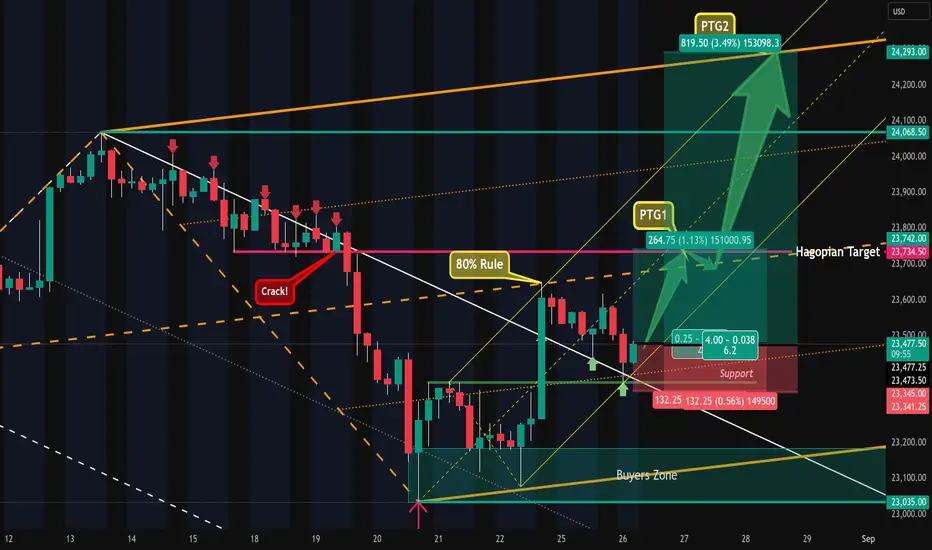
Nasdaq - Intraday Setup & Potential TradePrice was not abel to trade out of the white forks U-MLH and got constantly rejected.
It cracked the little support and fell down, but missed the white Centerline, creating a HAGOPIAN.
Then price traded outside of the white fork, following a textbook test/retest at the white U-MLH and found support.
The yellow fork points upwards, showing us the most probable path of price.
Going long near the white U-MLH gives us several potential targets:
1. the orange Centerline
2 the yellow Centerline
3. the HAGOPIAN target line.
4. the orange U-MLH
Stops would be below the last red bars low, because this, as of the time of writing, is the best structural level to hide behind.
I'm off to the mountains, have a happy trading day!
SPY/QQQ Plan Your Trade Update For 8-22 : Is This The Top?This is a follow-up to my recent video to help answer questions and to share my analysis of the SPY/QQQ, Gold/Silver, and Bitcoin for all viewers.
This video also addresses the tools I use to stay on top of the swings in price movement and highlights why I believe the markets may continue to unwind from these lofty highs.
Get some.
#trading #research #investing #tradingalgos #tradingsignals #cycles #fibonacci #elliotwave #modelingsystems #stocks #bitcoin #btcusd #cryptos #spy #gold #nq #investing #trading #spytrading #spymarket #tradingmarket #stockmarket #silver

Is this the top? SPY/QQQ Plan Your Trade Update For 8-20I know it has been a while since I shared a video.
This video is designed to share the downside risks I see as a potential for the markets IF this big speculative phase unwinds like I think.
Ultimately, you guys are the ones who will be making the trading decisions. I just want you to be aware that the markets are extremely volatile right now and the data is pointing to a very clean Excess Phase Peak (EPP) pattern.
As you are all aware, the EPP pattern suggests that a breakdown in price is likely where price may attempt to target the FLAG LOW.
If that happens, be prepared for a -15% to -20% breakdown in price before the end of 2025 - possibly seeing an even bigger price collapse.
In my opinion, this breakdown is the result of a broad unwinding of excesses related to the Biden economy (free money) and a move towards more reasonable US economic policies.
Overall, this pullback is necessary for the Wave 1 of Wave 5 structure to complete. Once this pullback is complete, the bigger rally phase (Wave 3 of Wave 5) will begin. And get ready for a big rally phase with Wave 3.
So, I hope this video helps you learn how to identify and plan for some of the biggest price swings in the SPY/QQQ, and prepare for even bigger moves in Gold/Silver and Bitcoin.
Get some.
#trading #research #investing #tradingalgos #tradingsignals #cycles #fibonacci #elliotwave #modelingsystems #stocks #bitcoin #btcusd #cryptos #spy #gold #nq #investing #trading #spytrading #spymarket #tradingmarket #stockmarket #silver

NQ - If you're curious to where Nasdaq is going todayNot much to babble.
This is my intraday Chart.
TGT at the Centerline...where else? §8-)
Trade save. NO FOMO!!!
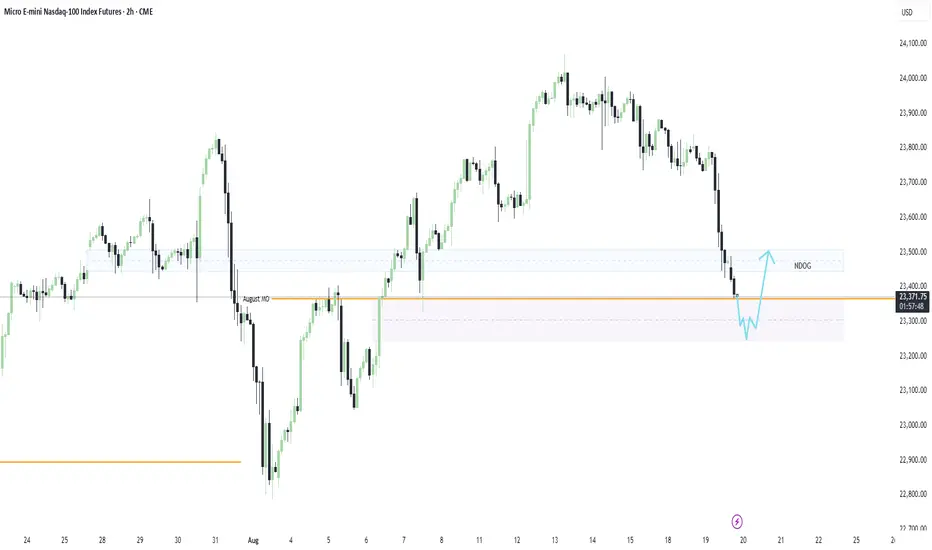
Gap Fill & Reversal Long IdeaI am anticipating a strong move through the August Monthly Open, with price sweeping the lows and targeting the 4H gap at 23,303.50. Once that level is tagged, I’ll be watching for signs of a reversal, ideally an inverse head and shoulders formation to shift bias back to the upside.
My target: a clean push toward the NDOG zone at 23,478.00
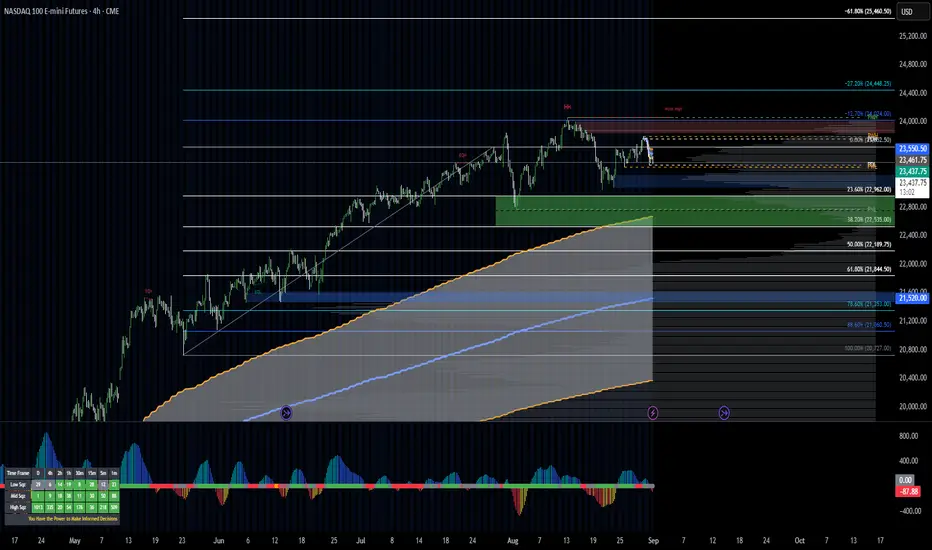
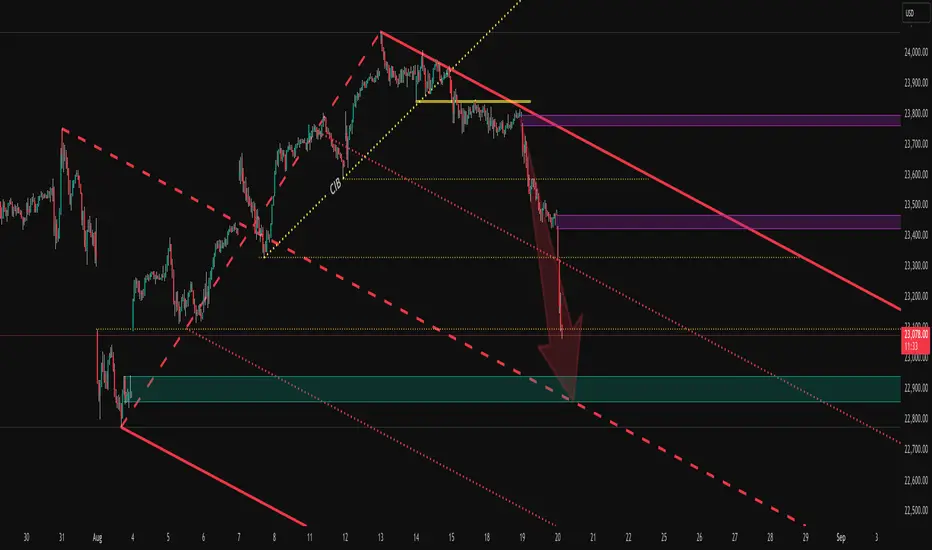
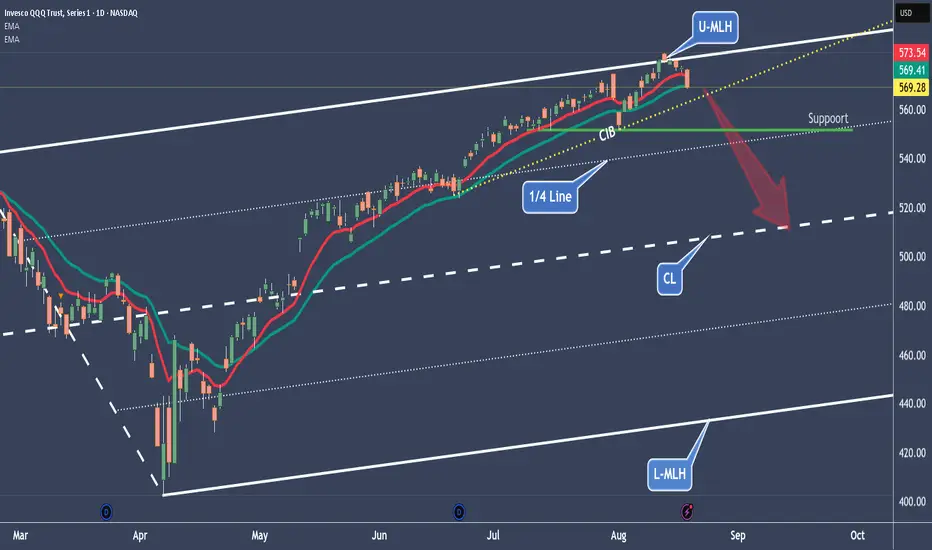
NQ – Nasdaq follows the witch’s SPY prophecyNot only is the S&P 500 following the oracle in the SPY, but the Nasdaq has also given us a short signal. So, the scenario is the same as with SPY: short down to the Centerline.
For the indicator traders, I’ve also added the EMA(10) and EMA(20). Look at how well they’ve provided support so far. If the EMA(20) cracks, things will get hot. And if the CIB line (Change In Behavior) also breaks, then all hell breaks loose!
As already mentioned in the SPY post, it wouldn’t be a shame to take at least 50% of the profits you’ve accumulated so far. Because if it goes further up, e.g. above the U-MLH, you still have 50% left to benefit. If it goes down, we’ve already bagged 50%.
BTW: At the 1/4 line, we can usually expect support.
Exciting times, when maybe it’s better to sit still and keep your hands to yourself.
I’ll create the YT video with details tomorrow.
Happy profits to you all!
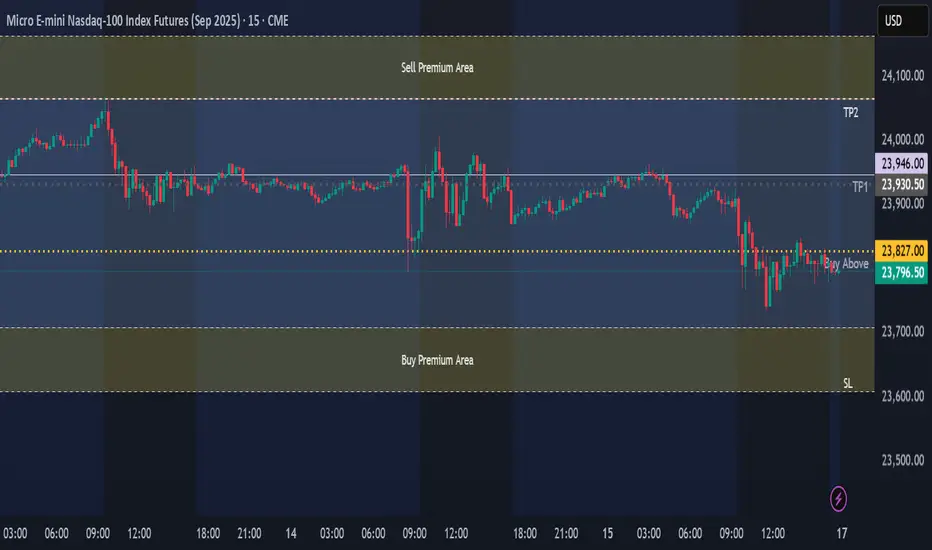
MNQ Trade IdeaCurrent Price: 23,796 (Green Line)
Setup Analysis
Price is approaching the Buy Signal level with defined premium zones. Current positioning suggests potential for upward momentum from key support levels.
Trade Parameters
• Buy Entry: 23,827 (Buy Signal Level)
• Target 1 (TP1): 23,946
• Target 2 (TP2): 24,065
• Stop Loss: 23,608
• Risk/Reward: Approximately 1:2.5 to 1:4
Key Premium Zones
• Premium Buy Area: 23,707 - 23,608
• Premium Sell Area: 24,064 - 24,163
Trading Strategy
🔍 Price Action Focus: Observe price behavior at all key levels:
• Buy Entry (23,827): Wait for confirmation before entering
• TP1 (23,946): Monitor for continuation or reversal signals
• TP2 (24,065): Watch price action near premium sell zone
• SL (23,608): Respect the stop loss level
💡 Flexible Approach:
• Entry decisions should be based on price action at these levels
• Consider short-term reversal trades at key levels with appropriate position sizing
• Premium zones offer opportunities for counter-trend plays with proper risk management
⚠️ Risk Management:
• Position size appropriately for your account
• Honor your stop loss at all times
• Take partial profits at TP1
• Adjust position size for reversal trades in premium zones
This is not financial advice. Trade at your own risk and always do your own research.
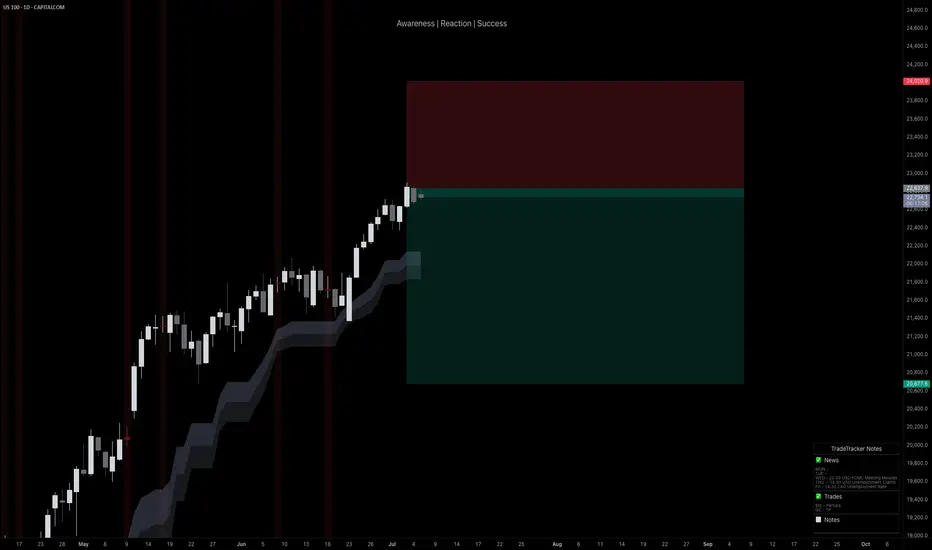
NASDAQ After the Fireworks: Bearish Setup LoadedAfter the classic 4th of July rally, I stepped in on the short side of Nasdaq, targeting 22,000 and 21,400 zones. The market structure shows exhaustion, and with the cloud retest failing to hold new highs, I positioned accordingly.
Technical:
• Price stalled at prior expansion highs with tight compression near 23,000.
• Daily FibCloud offered resistance confirmation.
• Bearish risk-reward skew forms after extended rally and thin retraces.
• Volume divergence spotted.
Fundamentals:
Multiple overlapping uncertainties:
• Trump confirmed tariffs will take effect on August 1, threatening a 10% surcharge on BRICS-aligned nations.
• Treasury Secretary Bessent anticipates several trade deal announcements within 48h—but stresses quality over quantity.
• Bank of America maintains its base case of 0 rate cuts in 2025, citing strong economic data and sticky inflation risks.
The combination of tariff escalation, hawkish monetary expectations, and global trade friction creates a perfect backdrop for volatility and correction—especially in overextended tech indices like the Nasdaq.
Note: Please remember to adjust this trade idea according to your individual trading conditions, including position size, broker-specific price variations, and any relevant external factors. Every trader’s situation is unique, so it’s crucial to tailor your approach to your own risk tolerance and market environment.
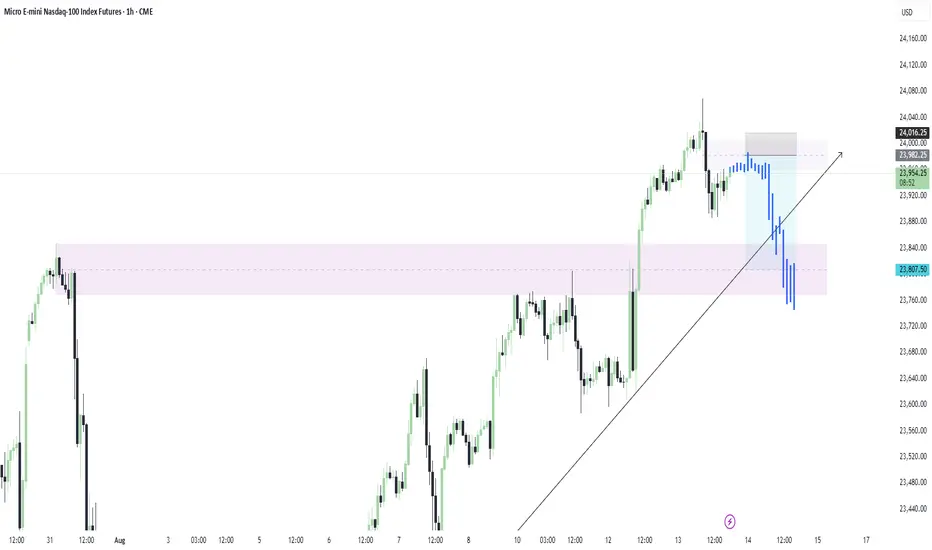
Head and Shoulders trade idea ahead of PPI Planning to short from 23,982.25, targeting 23,807.50. If this setup plays out, I expect it to complete overnight—ideally before the PPI release.
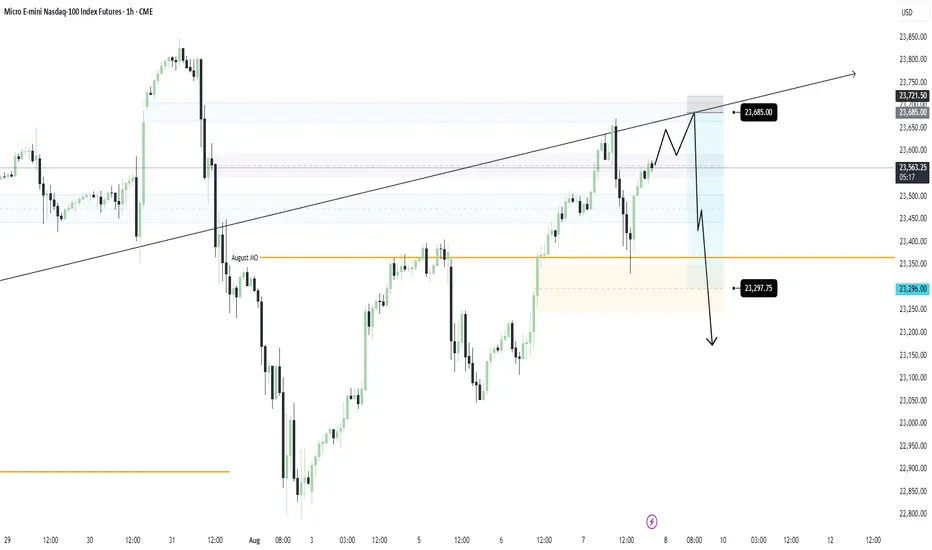
NQ Short Bias: Previous NWOG RejectionI missed today’s sell-off by 60 ticks, but price respected Monthly Open support and retraced back near intraday highs. That reaction reinforces my bias: I’m still anticipating the dump that will likely happen tomorrow.
Ideally, price completes the Double Top within the prior NWOG zone, then falls slightly before or exactly at NY Open for a clean downhill ride.
My entry will be at 23,685.00
Target will be around the low 23,300.00s
I feel like we can definitely fall further than my target, so I will have trailing Stop in place once price reaches my target.
Lets see how this goes⚡
SPY/QQQ Plan Your Trade Update For 8-5This short video is to provide my followers with an update.
I'm still here. I'm still working on projects and new TV code. I have developed a couple of new strategies that I like and that seem to continue to perform.
Overall, I'm still doing my best to deliver superior analysis/results for my followers.
This video covers the SPY/QQQ, Gold/Silver, and BTCUSD (plus extras).
Hope you are all getting some great profits from these moves.
GET SOME.
#trading #research #investing #tradingalgos #tradingsignals #cycles #fibonacci #elliotwave #modelingsystems #stocks #bitcoin #btcusd #cryptos #spy #gold #nq #investing #trading #spytrading #spymarket #tradingmarket #stockmarket #silver

Potential Shorts for NAS100After Last weeks NFP, price displaced very strongly to the downside. I would be considering shorts at the Daily CISD, which price is approaching rapidly.

NQ | NASDAQ - Weekly Recap & Gameplan - 03/08/25📈 Market Context:
The market is pricing in a potential 0.25% rate cut in the September FOMC meeting, keeping the overall structure bullish.
Although we saw a retracement after the Non-Farm Employment Change came in weaker than expected, bullish sentiment remains intact.
Currently, market sentiment has shifted to neutral from last week’s greed. Augusts are often choppy and prone to retracement/accumulation, but structurally, bulls still hold the upper hand.
🧾 Weekly Recap:
• NQ started the week strong with price discovery, pushing higher from Monday to Thursday.
• Eventually, price ran a key 4H swing liquidity, which led to another all-time high.
• That move was followed by the start of a healthy retracement, signaling short-term distribution.
📌 Technical Outlook & Game Plan:
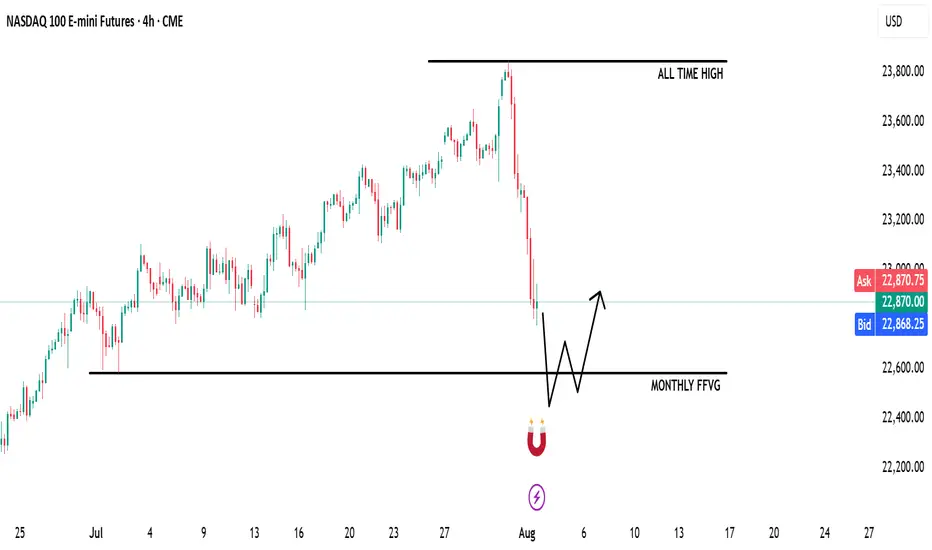
→ I'm expecting price to run into the Monthly Fair Value Gap — a major liquidity magnet in my model.
→ That move could generate significant bullish energy — at least a short-term bounce, if not a full reversal.
→ Until then, I remain bearish targeting 22,583 (my marked black line).
🎯 Setup Trigger:
After price takes 22,583, I’ll watch for:
• 4H–1H break of structure (BOS)
• Formation of fresh demand zones
→ Upon LTF confirmation, I’ll look to go long aiming for another test of all-time highs.
📋 Trade Management:
• Stoploss: Below the 1H–4H demand zone
• Target: Trailing stop strategy; aggressive profit-taking on the way up
• Note: Final target could be all-time highs, but I’ll manage the position actively
💬 Like, follow, and comment if this outlook adds value to your trading. Educational content and more setups are coming soon — stay tuned!
NASDAQ & NFP- I expect BullishnessHello fellow traders,
Today is NFP and I expect a bulishness as per my PD Arrays analysis. Lets se if it words out.
I have higlighted all important PD Arrays in my chart, keep an eye.
NASDAQ-Lets catch 250 Points togetherHello Fellow Traders,
Nasdaq has been wild since a time now. Today, I have spotted a rade to share with my fellow traders.
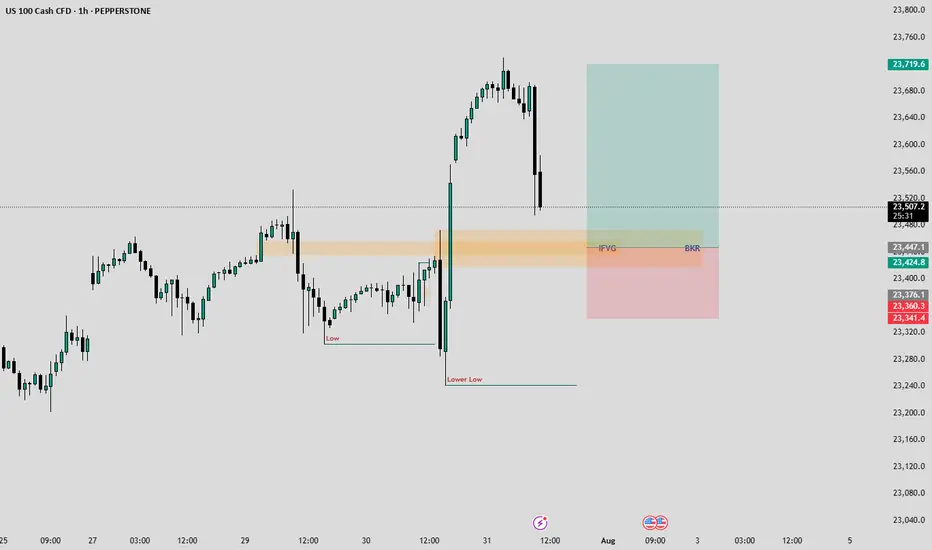
Yesterday closed with a good bullish candle. As the NY seesion has begun now, I am anticipating price to retrace to the highlighted breaker block that accurately aligns with an IFVG as well.
I am waiting for the price to fall into my area where I will monitor price's reaction, if we see signs of ejection from the highlighted areas, I wuld love to take a Buy Trade.
Entry= If rice enters the Breaker and IFVG and shows a good rejection.
SL= 23340
TP= Today's highs or 23700.
Manage your risk according toyour capital and only enter the trade if we happen to see a good rejection from the area. Be patient and don't hurry.
Why Are Markets Rising Despite the Tariffs?Because of the
1) Set timeline on finalizing the tariff rates and
2) The ongoing negotiations,
They aimed at striking a balanced deal between the U.S. and its trading partners.
The Liberation Day tariffs were announced on 2nd April, and markets initially crashed in response. However, just seven days later, on 9th April, the U.S. postponed the higher tariff increases for most countries by 90 days. Since then, markets have rebounded and even broken above their all-time highs set in December last year.
Now that the dust is settling with the expiration of timeline and ongoing negotiations, the big question is:
Where will the markets head next?
Mirco Nasdaq Futures and Options
Ticker: MNQ
Minimum fluctuation:
0.25 index points = $0.50
Disclaimer:
• What presented here is not a recommendation, please consult your licensed broker.
• Our mission is to create lateral thinking skills for every investor and trader, knowing when to take a calculated risk with market uncertainty and a bolder risk when opportunity arises.
CME Real-time Market Data help identify trading set-ups in real-time and express my market views. If you have futures in your trading portfolio, you can check out on CME Group data plans available that suit your trading needs tradingview.sweetlogin.com

Tuesday Long Trade for the NASDAQ 7/29I'm feeling ultra bullish on NQ right now. Ideally, I want to see price carve out an inverse head and shoulders or a double bottom—either could serve as a springboard to new highs. I took two longs this morning and captured solid gains off the weekly opening gap. Would love to see one final wick into that zone before we blast off.
Long Entry:23,476.75
Target: Break of the Highs | Trailing SL
Today's trades:
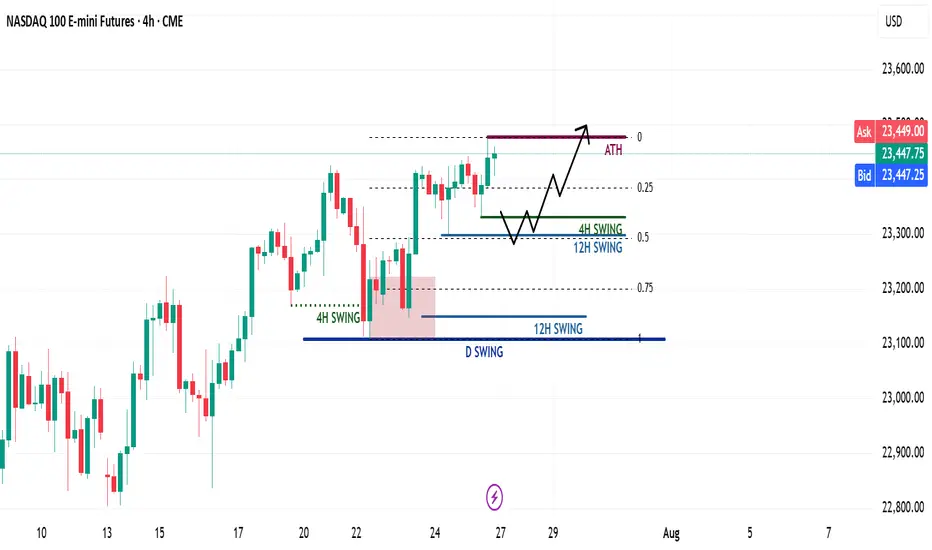
NQ Weekly Recap & Gameplan – 27.07.2025🧭 Market Sentiment
The overall sentiment remains bullish, supported by:
• Lower inflation data
• Trump’s policy shift toward aggressive rate cuts
This creates a strong risk-on environment across U.S. indices.
🔙 Previous Week Recap
• NQ continued its price discovery phase
• Price swept 4H swing liquidity and triggered a market structure shift
• A new 1H demand zone was formed after MSS
• Price revisited the 1H demand and launched toward new all-time highs (ATH)
• While I anticipated a deeper retracement, ES provided the cleaner pullback
• I executed longs on both ES and NQ using SMT divergence (ICT SMT concept)
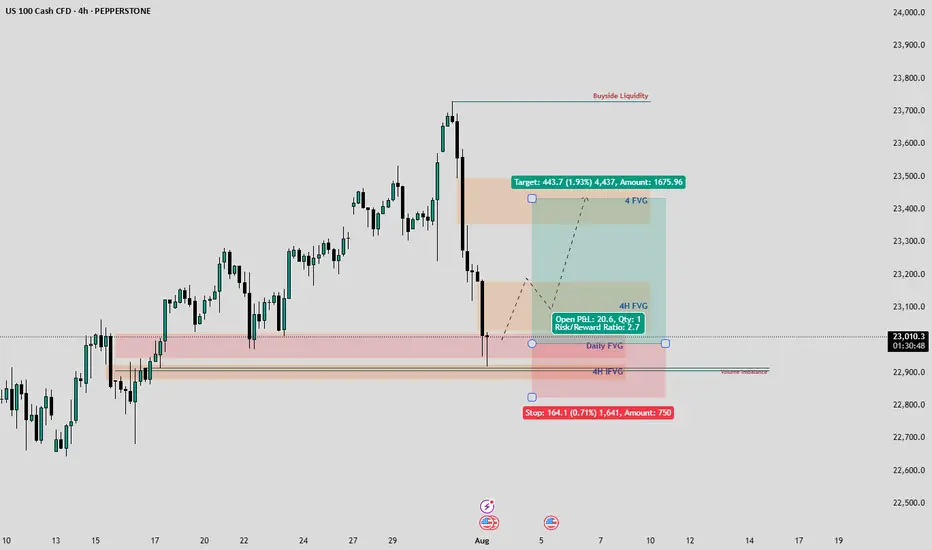
📊 Technical Analysis
My bias remains bullish as long as the higher timeframe structure holds.
For the upcoming week:
• Watching for either the 4H or 12H swing high to get swept
• Ideally, a retracement toward the 0.5 Fib level, which aligns with my bullish discount zone
• A clean liquidity sweep into this zone could act as a launchpad for the next leg higher
⚙️ Trade Setup & Execution Plan
Entry Strategy:
• Wait for a new 1H–4H Market Structure Shift
• Identify the new demand zone post-MSS
• Look for price to return to the zone for a long opportunity with LTF confirmation
Trade Management:
🎯 Target: New ATH
⛔ Stoploss: Swing low of the 1H–4H demand zone
📌 Chart will include Fib levels, MSS zones, and execution trigger areas.
Let me know your thoughts or share your plan below.
Happy trading!