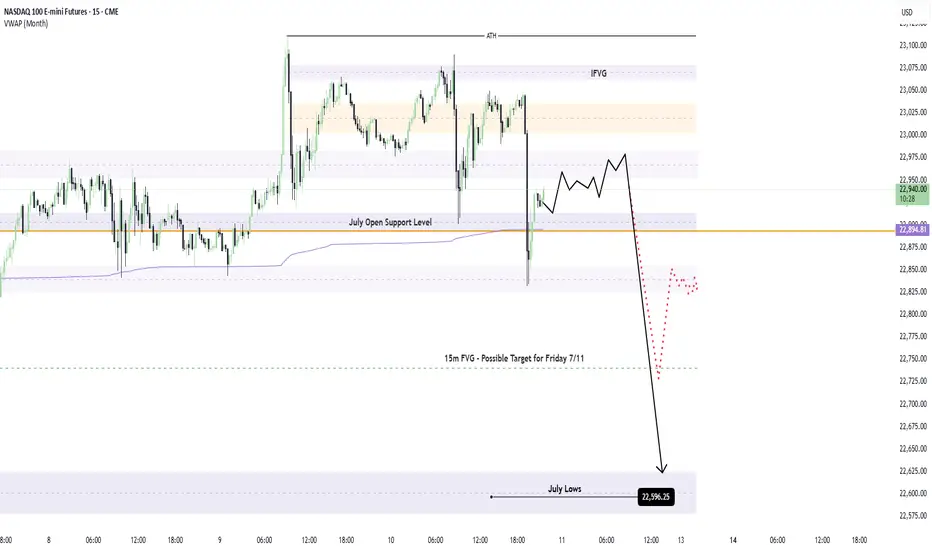
A Bearish July for Nasdaq?I hadn’t anticipated the -212 point move unfolding during the After Hours session—I'd mapped that reaction for the upcoming New York AM session open. That said, with momentum already in play, I’m maintaining my short bias. Price appears poised to revisit the July lows, with a high probability of trading through them and pressing further beneath the Monthly VWAP. I’m eyeing continuation to the downside as long as structure confirms the move.
NASDAQ 100 E-MINI FUTURES
Watch me trade NQ LIVE!This is a just a quick video showing what I look for in order to take a trade.
I entered a short on NQ minutes ago, looking for 2.44 RR!
Apologies for this rough cut video. It was spur of the moment, and I wanted to share with my followers and viewers!
Enjoy!
May profits be upon you.
Leave any questions or comments in the comment section.
I appreciate any feedback from my viewers!
Like and/or subscribe if you want more accurate analysis.
Thank you so much!
Disclaimer:
I do not provide personal investment advice and I am not a qualified licensed investment advisor.
All information found here, including any ideas, opinions, views, predictions, forecasts, commentaries, suggestions, expressed or implied herein, are for informational, entertainment or educational purposes only and should not be construed as personal investment advice. While the information provided is believed to be accurate, it may include errors or inaccuracies.
I will not and cannot be held liable for any actions you take as a result of anything you read here.
Conduct your own due diligence, or consult a licensed financial advisor or broker before making any and all investment decisions. Any investments, trades, speculations, or decisions made on the basis of any information found on this channel, expressed or implied herein, are committed at your own risk, financial or otherwise.

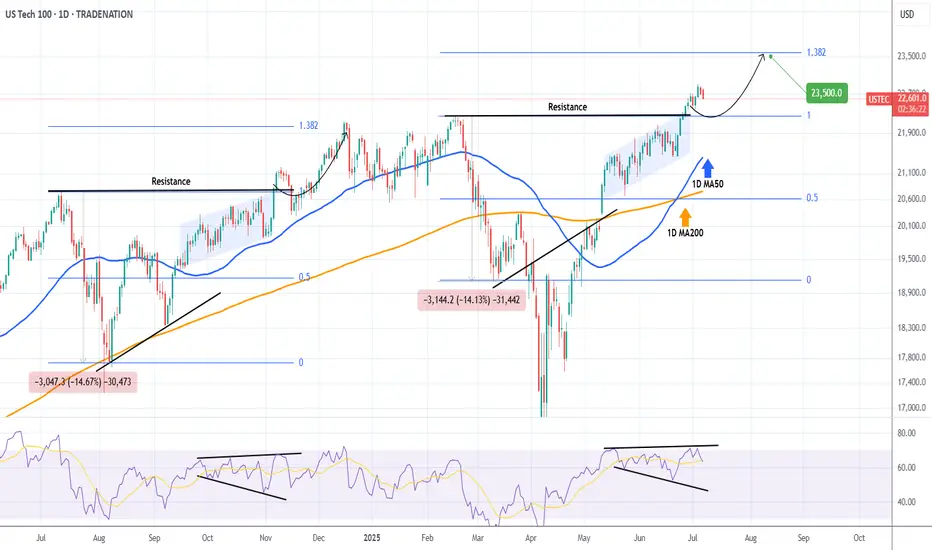
NASDAQ going to 23500 by August.Nasdaq (NDX) is trading above the previous All Time High (ATH) Resistance, staging a very structured uptrend that has recently gotten out of a 1D Golden Cross.
As long as the 1D MA50 (blue trend-line) continues to support, we might get a repeat of the November - December 2024 rally that peaked on the 1.382 Fibonacci extension level from he August 2024 Low.
That whole July - October 2024 pattern is quite similar to the February - June 2025 of today. A quick pull-back is possible at this stage but by the end of August, we expect the index to test at least the 23500 level.
-------------------------------------------------------------------------------
** Please LIKE 👍, FOLLOW ✅, SHARE 🙌 and COMMENT ✍ if you enjoy this idea! Also share your ideas and charts in the comments section below! This is best way to keep it relevant, support us, keep the content here free and allow the idea to reach as many people as possible. **
-------------------------------------------------------------------------------
Disclosure: I am part of Trade Nation's Influencer program and receive a monthly fee for using their TradingView charts in my analysis.
💸💸💸💸💸💸
👇 👇 👇 👇 👇 👇
Weekly Market Outlook: E-mini Nasdaq 100 Futures NQCME_MINI:NQ1!
It’s a quiet week for US economic news. However, the RBA and RBNZ are scheduled to announce interest rate decisions.
As has been the theme this year, markets remain highly sensitive to headline news and associated risks.
US President Trump signed the One Big Beautiful Bill Act into law at the White House.
Treasury Secretary Bessent is currently giving an interview on CNBC as we write this outlook. Explanation of the near-term impact of Trump’s BBB Act, tariffs, and trade deals will be key to monitor, as this may be fuel for further movement. The US is set to announce more trade deals in the next 48 hours, while trading partners who did not reach a deal will revert to April 2nd tariff levels, with the tariffs to take effect on August 1st.
As many as 100 smaller countries will get a set tariff rate.
How does this all translate into price action and expectations for the market?
NQ and ES are currently trading near all-time highs. RTY has potential upside as it plays catch-up. With the BBB Act signed into law, many of the investment banks anticipate a near-term positive impact on GDP.
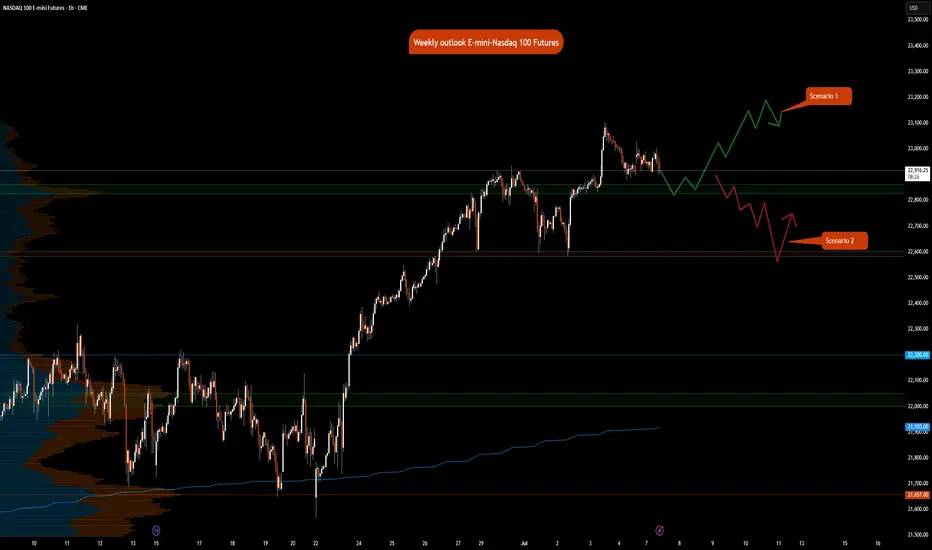
In NQ, we are looking at the following scenarios:
Key LIS zone: 22860.50 – 22825.50
Support Zone: 22600 – 22582.25
Key Support Zone: 22000 – 22050
Scenario 1: Hold above key LIS
In this scenario, we expect new ATHs and continuing price discovery higher.
Scenario 2: Hold below key LIS
In this scenario, we expect the price to re-test the support zone at 22600 – 22582.25 and consolidate to build value higher. A break below support may lead to further short opportunities to retest the 22000 level.
NASDAQ After the Fireworks: Bearish Setup LoadedAfter the classic 4th of July rally, I stepped in on the short side of Nasdaq, targeting 22,000 and 21,400 zones. The market structure shows exhaustion, and with the cloud retest failing to hold new highs, I positioned accordingly.
Technical:
• Price stalled at prior expansion highs with tight compression near 23,000.
• Daily FibCloud offered resistance confirmation.
• Bearish risk-reward skew forms after extended rally and thin retraces.
• Volume divergence spotted.
Fundamentals:
Multiple overlapping uncertainties:
• Trump confirmed tariffs will take effect on August 1, threatening a 10% surcharge on BRICS-aligned nations.
• Treasury Secretary Bessent anticipates several trade deal announcements within 48h—but stresses quality over quantity.
• Bank of America maintains its base case of 0 rate cuts in 2025, citing strong economic data and sticky inflation risks.
The combination of tariff escalation, hawkish monetary expectations, and global trade friction creates a perfect backdrop for volatility and correction—especially in overextended tech indices like the Nasdaq.
Note: Please remember to adjust this trade idea according to your individual trading conditions, including position size, broker-specific price variations, and any relevant external factors. Every trader’s situation is unique, so it’s crucial to tailor your approach to your own risk tolerance and market environment.
July 7 - 11: Buy Stock Indices DIPs! Watch For Gold, Oil FVGs!In this Weekly Market Forecast, we will analyze the S&P 500, NASDAQ, DOW JONES, Gold and Silver futures, for the week of July 7 - 11th.
Stock Indices are strong, so dip opportunities should present themselves next week.
Gold is bullish-neutral. Could see strength enter this market as July 9th approaches.
Silver is bullish. No reason to short it.
Oil is in a Monthly +FVG. If the FVG fails, it will confirm bearishness. Couple that with the fundamentals, I am watching for that confirmations to sell US Oil.
Enjoy!
May profits be upon you.
Leave any questions or comments in the comment section.
I appreciate any feedback from my viewers!
Like and/or subscribe if you want more accurate analysis.
Thank you so much!
Disclaimer:
I do not provide personal investment advice and I am not a qualified licensed investment advisor.
All information found here, including any ideas, opinions, views, predictions, forecasts, commentaries, suggestions, expressed or implied herein, are for informational, entertainment or educational purposes only and should not be construed as personal investment advice. While the information provided is believed to be accurate, it may include errors or inaccuracies.
I will not and cannot be held liable for any actions you take as a result of anything you read here.
Conduct your own due diligence, or consult a licensed financial advisor or broker before making any and all investment decisions. Any investments, trades, speculations, or decisions made on the basis of any information found on this channel, expressed or implied herein, are committed at your own risk, financial or otherwise.

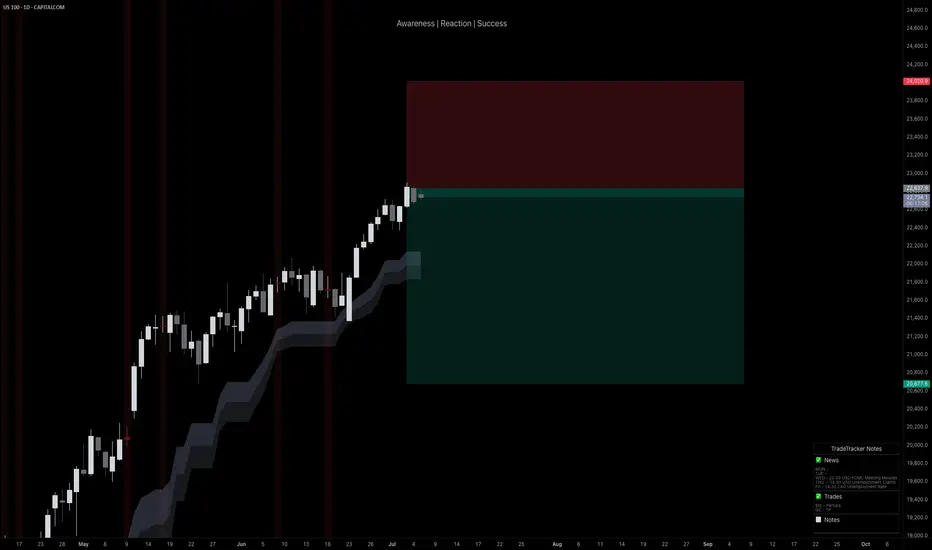
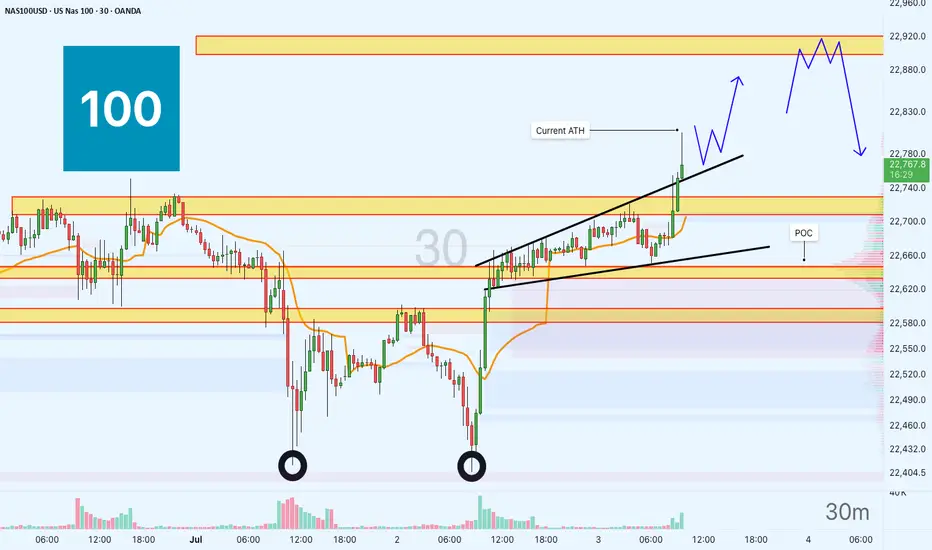
US100 — New ATH Trading SetupThe price recently previous ATH at the 22730 level. Current ATH is marked near 22,800, with a POC at 22,640.
Potential support around 22,500, below POC.
Watch for a bounce or further rise beyond 22,920.
Buyers probably will push right through 23,000 level today on Micros and Minis.
Live Market Walkthrough Emini Nasdaq 100Outlined the orderflow distribution and trading All time highs

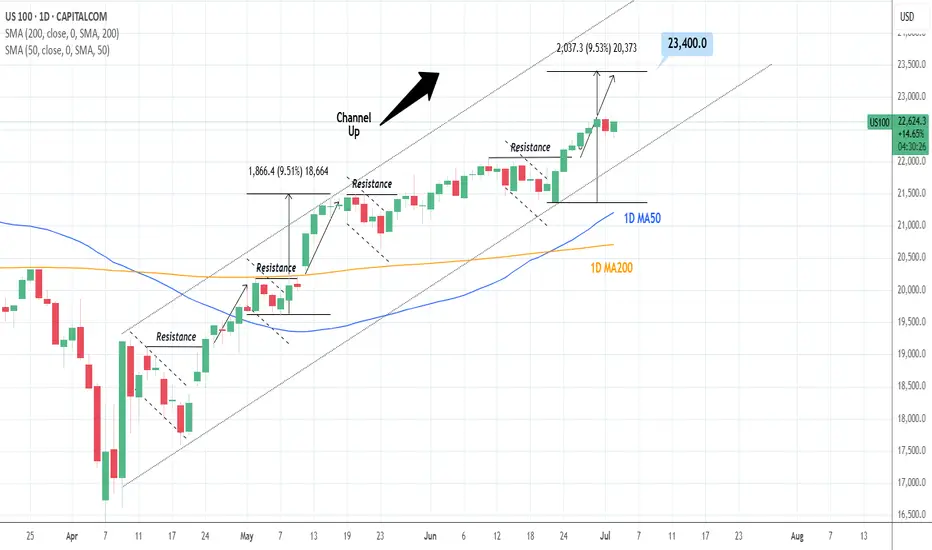
NASDAQ: Almost overbought but with no stop on this uptrend.Nasdaq is about to turn overbought on its 1D technical outlook (RSI = 68.420, MACD = 402.410, ADX = 22.800) but the current bullish wave shows no signs of stopping yet. The Channel Up since the April bottom indicates that a +9.50% rise is very likely before the next technical pullback, especially as long as the 1D MA50 is holding. Stay long, TP = 23,400.
## If you like our free content follow our profile to get more daily ideas. ##
## Comments and likes are greatly appreciated. ##
DIYWallSt Trade Journal: Why Traders Are Rotating from Nasdaq to**07/01/25 Trade Journal, and ES_F Stock Market analysis **
EOD accountability report: +1160
Sleep: 5 hours
Overall health: Need to catch up on sleep again
** VX Algo System Signals from (9:30am to 2pm) 4/4 success**
9:39 AM Market Structure flipped bullish on VX Algo X3! :check:
11:00 AM Market Structure flipped bearish on VX Algo X3 :check:
11:24 AM VXAlgo ES X1 Buy signal :check:
12:00 PM Market Structure flipped bullish on VX Algo X3! :check:
**What’s are some news or takeaway from today? and What major news or event impacted the market today? **
RTY and YM leading the way today
NQ lagging
Why is this?
The answer is, Simple Supply and Demand theory.
Money has to come from somewhere.
If Money is going to YM and RTY,
Money has to leave from NQ or ES or both.
There is not an infinite amount of money, So if one index is outperforming like crazy over the other. It must be draining from it
Why would it drain from NQ? Easy
Because NQ and ES already hit ATH,
YM and RTY has not hit ATH yet.
So people are selling NQ and buying YM because it is on Discount
News
N/A
**What are the critical support levels to watch?**
--> Above 6235= Bullish, Under 6210= Bearish
Video Recaps -->https://tradingview.sweetlogin.com/u/WallSt007/#published-charts


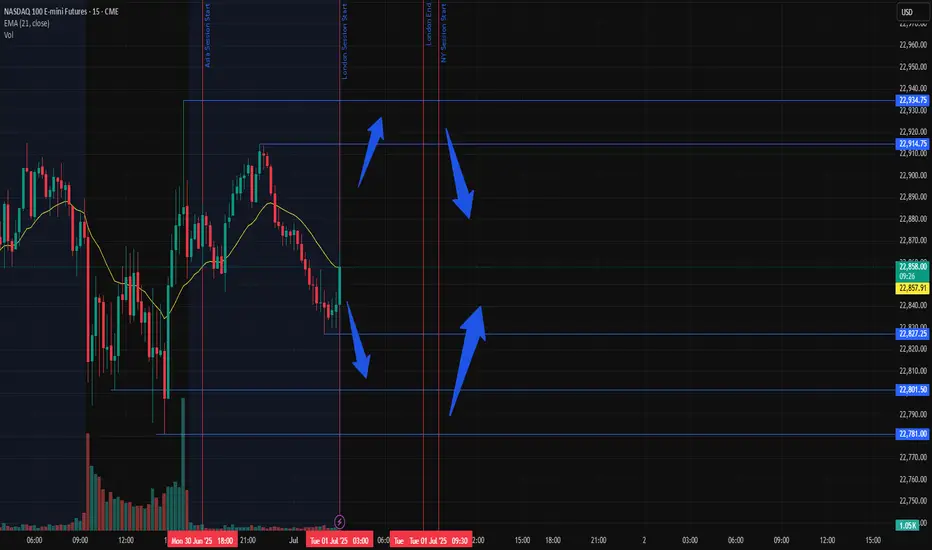
Expection for NQ London and NY SessionHi everyone, I expect London to Manipulate up, or down. The NY Move will then be a reversal of this move.
IF we stay in the Asian Range I expect the NY Session to take out either high, or low and then reverse to the opposite
NASDAQ: Minor Pullback, Still on TrackOn Friday, the Nasdaq experienced a slight pullback, which was quickly absorbed at the start of the week. Currently, the index is still developing the turquoise wave B, which should top out just below resistance at 23,780 points, signaling the start of the bearish wave C. This move should lead to the low of the magenta wave (4) within our turquoise Target Zone between 17,074 and 15,867 points. Alternatively, there is a 42% probability that wave alt.(4) is already complete. In this scenario, the magenta wave alt.(5) could carry the index immediately above the mentioned resistance.
📈 Over 190 precise analyses, clear entry points, and defined Target Zones - that's what we do.

NASDAQ Possible short-term pull-back.Last time we analyzed Nasdaq (NDX) was a week ago (June 23, see chart below), giving a comfortable buy signal as the price was rebounding at the bottom of the 6-week Channel Up:
The price hit our 22300 Target and has now touched the top of the Channel Up. Based on the 4H RSI, it resembles the May 15 price action, which soon after pulled back to the 0.382 Fibonacci retracement level.
It is possible to see such relief profit taking on the short-term and a test of 22200 (Fib 0.382).
-------------------------------------------------------------------------------
** Please LIKE 👍, FOLLOW ✅, SHARE 🙌 and COMMENT ✍ if you enjoy this idea! Also share your ideas and charts in the comments section below! This is best way to keep it relevant, support us, keep the content here free and allow the idea to reach as many people as possible. **
-------------------------------------------------------------------------------
Disclosure: I am part of Trade Nation's Influencer program and receive a monthly fee for using their TradingView charts in my analysis.
💸💸💸💸💸💸
👇 👇 👇 👇 👇 👇
Risk On! Buy Stock Indices, Sell Gold, Silver.In this Weekly Market Forecast, we will analyze the S&P 500, NASDAQ, DOW JONES, Gold and Silver futures, for the week of June 29 - July 4th..
Stock Indices are pointed to the all time highs. Take advantage of the "risk on" environment while it lasts!
Gold and Silver have seen the outflows and profit taking... so look for lower prices this week.
Oil ... be patient. After a huge dump in prices when the tensions eased up between Israel/US and Iran, price is moving sideways in consolidation. I suspect lower prices to come, but I urge patience! Wait for the signature of price to show it intends to move lower. A sweep of the range highs and a run of the range lows right after... is the signal to sell.
Enjoy!
May profits be upon you.
Leave any questions or comments in the comment section.
I appreciate any feedback from my viewers!
Like and/or subscribe if you want more accurate analysis.
Thank you so much!
Disclaimer:
I do not provide personal investment advice and I am not a qualified licensed investment advisor.
All information found here, including any ideas, opinions, views, predictions, forecasts, commentaries, suggestions, expressed or implied herein, are for informational, entertainment or educational purposes only and should not be construed as personal investment advice. While the information provided is believed to be accurate, it may include errors or inaccuracies.
I will not and cannot be held liable for any actions you take as a result of anything you read here.
Conduct your own due diligence, or consult a licensed financial advisor or broker before making any and all investment decisions. Any investments, trades, speculations, or decisions made on the basis of any information found on this channel, expressed or implied herein, are committed at your own risk, financial or otherwise.

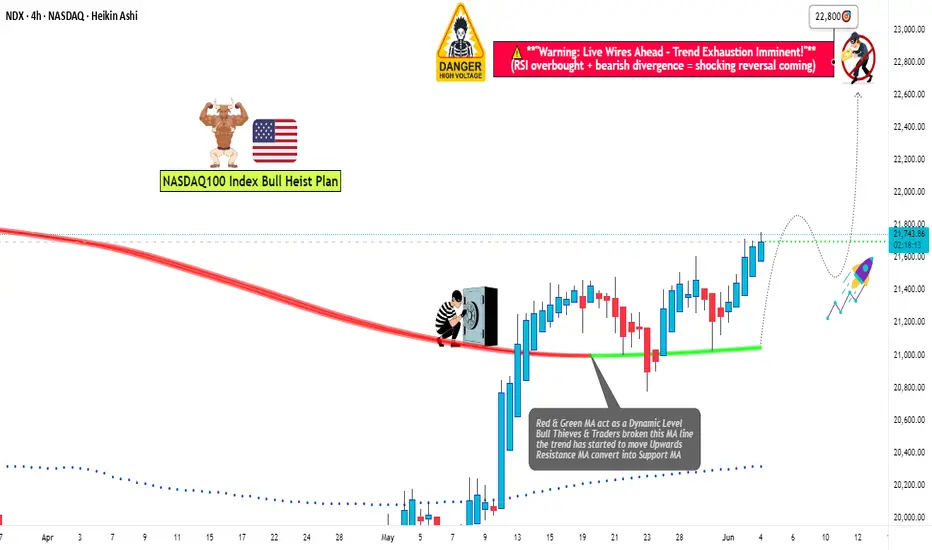
"NASDAQ 100: THE TECH ROBBERY! – Quick Profits Before Reversal?"🔥 "The NDX NASDAQ 100 INDEX Heist: Bullish Loot & Escape Before the Trap!" 🔥
🌟 Hi! Hola! Ola! Bonjour! Hallo! Marhaba! 🌟
Dear Money Makers & Market Robbers, 🤑💰💸✈️
Based on the 🔥Thief Trading Style🔥 (technical + fundamental analysis), here’s our master plan to heist the NDX - NASDAQ 100 INDEX. Follow the strategy on the chart—long entry is the play! Aim to escape near the high-risk RED Zone (overbought, consolidation, potential reversal). The bears are lurking, so take profits and treat yourself—you’ve earned it! 💪🏆🎉
🚀Entry (The Vault is Open!)
"Swipe the bullish loot at any price!"
For precision, place buy limit orders within 15-30min timeframe (recent swing lows/highs).
Set alerts! Don’t miss the heist.
🛑 Stop Loss (Safety Net)
Thief-style SL at nearest swing low (4H timeframe) → 21,000.00 (adjust based on risk/lot size).
🏴☠️ Target 🎯: 22,800.00
Bullish momentum is fueling this heist—ride the wave but exit before the trap!
📰 Fundamental Backing (Why This Heist Works)
Macroeconomic trends, COT data, geopolitics, and sentiment align for bullish moves.
Full analysis? Check our bio0 linkk! 👉🔗🌎
⚠️ Trading Alerts (News & Risk Mgmt)
Avoid new trades during high-impact news (volatility = danger).
Use trailing stops to lock profits and dodge sudden reversals.
💥 Boost This Heist!
Hit 👍 (Boost Button) to strengthen our robbery squad!
More heists = More profits—stay tuned for the next steal! 🚀🤑
See you soon, fellow thieves! 🤝🎉
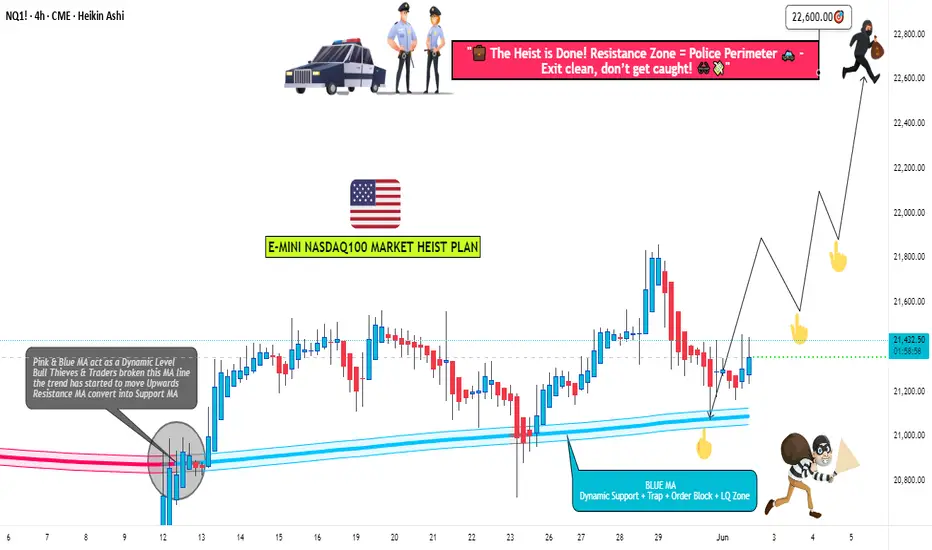
NASDAQ 100 TECH HEIST: Bullish Loot Before the Bear Trap!🚨 E-MINI NASDAQ 100 HEIST: Tech Rally or Bear Trap? (Thief Trading Blueprint) 🚨
🌟 Hola! Oi! Bonjour! Hallo! Salam! 🌟
Attention all Market Bandits & Tech Raiders! 🏴☠️💻💰
🔥 Thief Trading Intel: We're targeting the E-MINI NASDAQ 100 for a bullish loot grab! Long entry only—high-risk Red Zone ahead: overbought, consolidating, and primed for a reversal. Don’t let the bears ambush your profits!
"Claim your tech treasure and run—you’ve earned this steal!" 💰🚀
🚪 ENTRY: The Tech Vault is Open!
📈 "Swipe bullish loot at any price—the heist is LIVE!"
Buy Limit orders at recent swing lows/highs (15-30 min TF).
📌 Pro Thief Move: SET ALERTS! Don’t miss the breakout.
🛑 STOP LOSS: Escape Plan
📍 Thief SL (Smart Crew): Recent swing low (20,700.00, 4H TF).
📍 Adjust based on your risk, lot size, and orders.
🎯 TARGET: Loot & Exit!
🎯 22,600.00 (or bail early if the market flips!)
⚡ SCALPERS’ QUICK HIT
👀 Long scalps ONLY!
Deep pockets? Raid now.
Light wallet? Join swing traders.
Trailing SL = Your Profit Shield! 🛡️
📢 WHY THIS HEIST? (NASDAQ Bullish Momentum)
Tech rally brewing! Key drivers:
Fundamentals (COT, Macro, Geopolitics)
Sentiment & Intermarket Trends
Index-Specific Analysis & Positioning
🔗 Full intel? Bio linkss checkk! 👉🏻👉🏻👉🏻
⚠️ WARNING: News = Danger Zone! 📡🚨
Tech news moves FAST! Protect your loot:
❌ Avoid new trades during news.
🔒 Trailing SL = Lock profits.
💖 SUPPORT THE TECH HEIST CREW!
💥 SMASH THAT BOOST BUTTON! 💥
More boosts = bigger future heists!
Stronger crew = more $$$ for all!
Profit daily with Thief Trading Style! 📈🏆
Next tech raid coming soon—stay tuned! 🖥️🤑
US100 (NASDAQ) BREAKOUT BLUEPRINT: LOOT LIKE A SMART TRADER!🔥 NASDAQ 100 HEIST: STEAL THE TREND LIKE A MARKET BANDIT! 🚨💰
Locked & loaded for the US100 (NASDAQ 100) heist? This slick blueprint cracks the code to loot profits—blending killer technicals with macro intel. Ride the bullish wave, but dodge traps near the Overbought Zone. Bears lurk, so secure your bag before the reversal hits! 🐻💨
🎯 ENTRY: STRIKE LIKE A PRO THIEF
Long the breakout near 21,500.0 (or ambush pullbacks at 20,400.0 & 19600.0).
Set stealth alerts to catch moves in real-time. 🕶️🔔
🛡️ STOP LOSS: ESCAPE ALIVE
Hide stops under the last 4H swing low/wick—no reckless bets!
Adjust for your risk—survivors play smart. ⚡
💸 TAKE PROFIT: VANISH WITH THE LOOT
Main Target: 22,250.0 (or bail early if momentum fades).
Scalpers: Trail stops & ghost out with quick wins. 🏃♂️💨
📡 WHY THIS HEIST WORKS
NASDAQ 100’s on fire: Fundamentals + COT data + macro tides align.
Sentiment’s bullish, but stay sharp—links below for the full intel. 🔍🌐
⚠️ WARNING: NEWS = POLICE SIRENS
Avoid new trades during high-impact news. 📢
Lock profits with trailing stops if you’re already in. 🔐
🤝 JOIN THE TRADING MAFIA
Smash LIKE, drop a comment, & let’s dominate the US100! �
Ready for the next big move? Stay tuned. 👀
Happy hunting, chart pirates! 🏴☠️📉

Nasdaq: At the Upper EdgeYesterday, the Nasdaq climbed above resistance at 22,475 points. Currently, the index is positioned outside our turquoise Target Zone (coordinates: 21,751 – 22,425 points), which remains active. Stops for short positions 1% above the zone have not yet been triggered. Our primary scenario remains intact for now: technically, there is room for wave B to reach the next resistance at 23,229 points. Following the B-wave peak, a downtrend is expected with the corrective wave C. With a 42% probability, we anticipate that wave alt.(4) is already complete, and the index may break directly higher within the magenta-colored wave alt.(5), surpassing the 23,229-point mark.
📈 Over 190 precise analyses, clear entry points, and defined Target Zones - that's what we do.

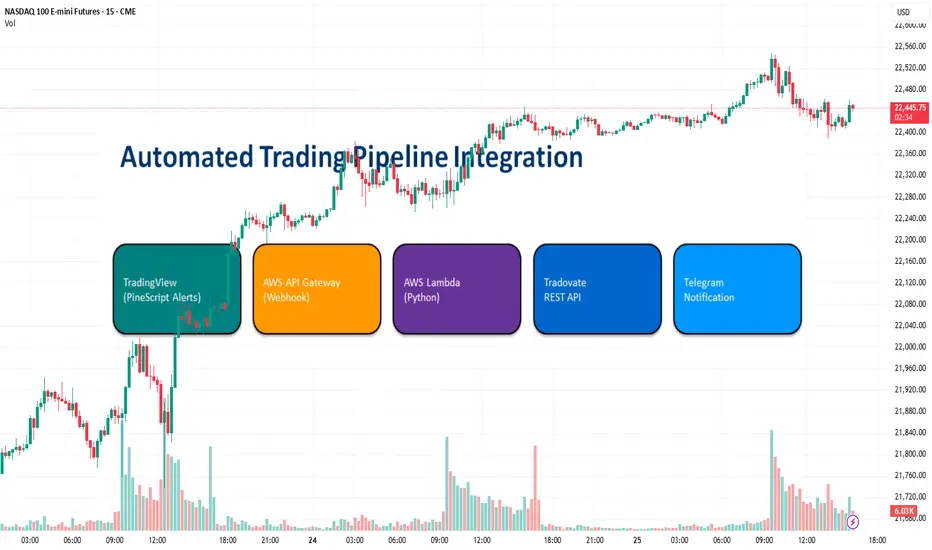
Automating Your Trading Pipeline: Series Overview
Hello fellow traders!
Over the next week I’ll be rolling out a short series on how to take your TradingView alerts all the way through to live orders—fully automated—using AWS and the Tradovate API.
Today’s post is just the big-picture overview. In the days ahead we’ll peel back the layers and show you exactly how each piece fits together:
TradingView PineScript Alerts: how to craft alert payloads in Pine.
AWS API Gateway web-hook: receiving and validating your alerts.
AWS Lambda Python – processing payloads & calculating SL and TP.
Tradovate REST API – placing bracket (OCO) orders.
Telegram Notifications – real-time trade confirmations to your phone.
At the end of this series you’ll have a fully-automated end-to-end pipeline, no more manual order entry!
Stay tuned for Part 2 , when we’ll dive into crafting precise JSON alerts in PineScript.
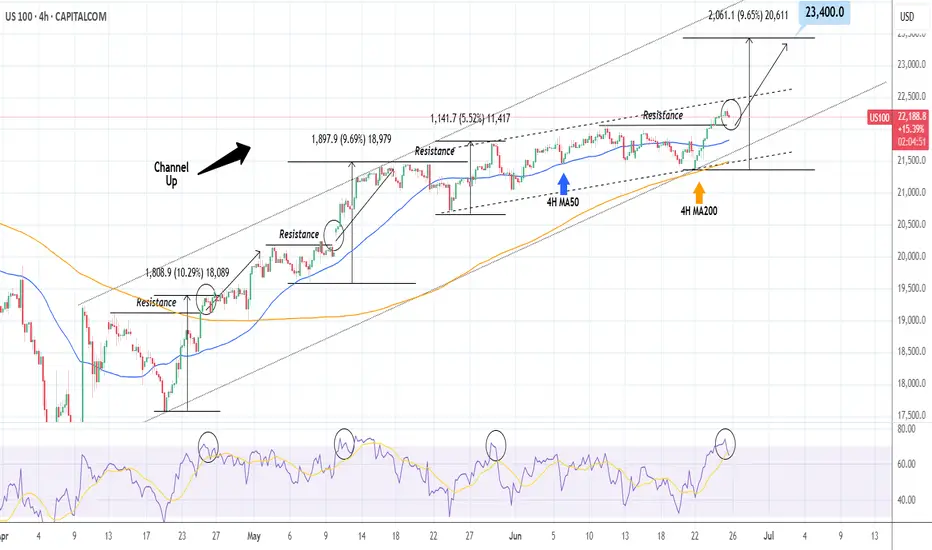
NASDAQ: Short-lived pullback ahead of major breakout.Nasdaq has entered strong bullish territory on its 1D technical outlook (RSI = 66.290, MACD = 331.080, ADX = 18.600). Despite that, it remains inside a slow moving Channel Up for the past month in contrast to the more aggressive bullish waves of the Channel Up in April and May. The 4H RSI peak may be similar to May 12th and April 24th. We believe that at least a +9.69% rally will emerge to approach the top of this 3 month Channel Up. Stay bullish, TP = 23,400.
## If you like our free content follow our profile to get more daily ideas. ##
## Comments and likes are greatly appreciated. ##

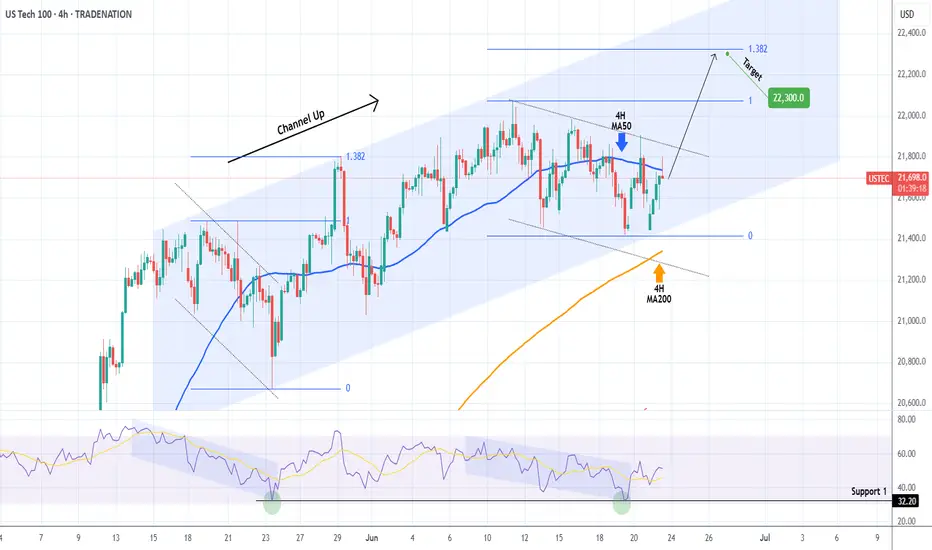
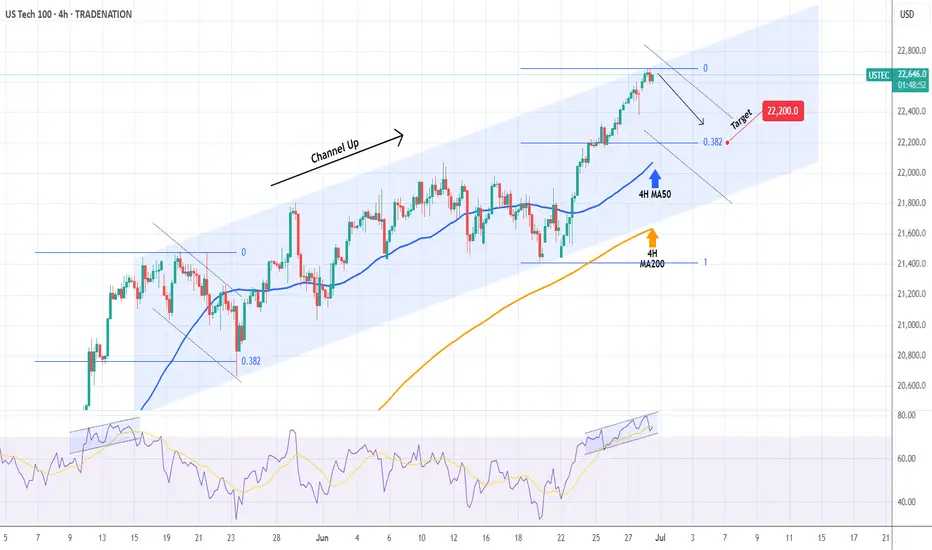
NASDAQ Will the 4H MA200 support the Channel Up?Nasdaq (NDX) has been trading within a Channel Up since mid-May and today almost touched the pattern's bottom, making a Higher Low. At the same time, the 4H MA200 (orange trend-line) is right below it, the medium-term's natural Support.
Since the 4H RSI also bounced on the 32.20 Support, which is where the pattern bottomed on May 23, we expect the new Bullish Leg to start, as long as of course the 4H MA200 holds. The Target is the 1.382 Fibonacci extension at 22300.
-------------------------------------------------------------------------------
** Please LIKE 👍, FOLLOW ✅, SHARE 🙌 and COMMENT ✍ if you enjoy this idea! Also share your ideas and charts in the comments section below! This is best way to keep it relevant, support us, keep the content here free and allow the idea to reach as many people as possible. **
-------------------------------------------------------------------------------
Disclosure: I am part of Trade Nation's Influencer program and receive a monthly fee for using their TradingView charts in my analysis.
💸💸💸💸💸💸
👇 👇 👇 👇 👇 👇