GC1! Gold Futures Weekly Outlook. Expecting Mid week reversalCOMEX:GC1!
Expecting a massive meltdown on Gold after $3400. On the Daily Internal Range Liquidity.
Trading All Time Highs is different compare to trading when you have a data on the left. Very volatile conditions on GOLD. I will buy from a 4H orderflow upto $3400. Then would short from $3400 CME_MINI:NQ1!
NASDAQ 100 E-MINI FUTURES

E-mini S&P 500 Outlook for next week. Thought process is the same just like NQ1!. Want massive buyside expansion. But weekly profiles need to be there. Tuesday/Wednesday Low of the Week is what I' personally looking for.
So expecting an SMT Divergence on the Previous Weekly Sellside . And then a massive push up.
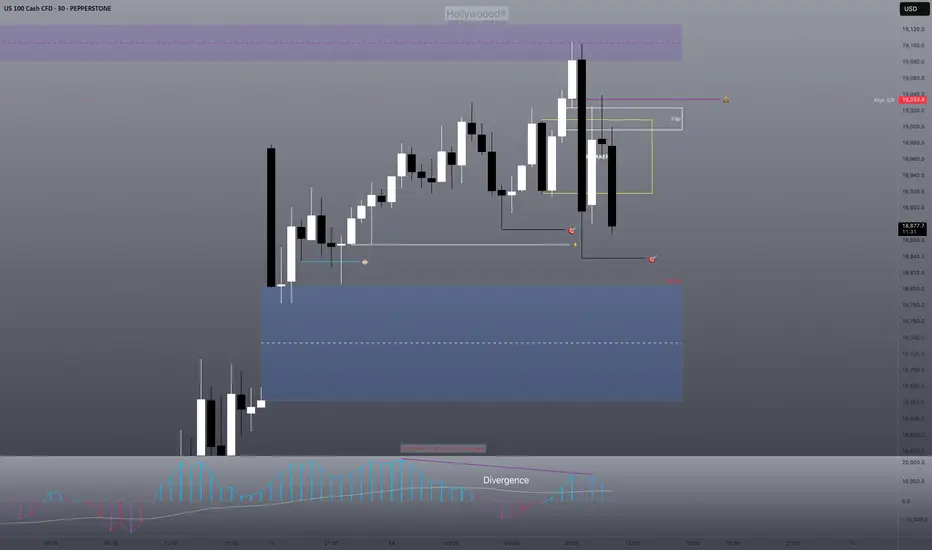
2nd Stage Distribution on Market Maker Buy Model. Offset it is. Crosshairs on 5529

E-mini Nasdaq 100 Weekly Overview & Outlook for next weekIntroduction of Gap Quadrants. Weekly Orderflow Review. Expecting classic Weekly "Power of Three" next week. Along with a SMT Divergence on the lows with ES1!

Stock Market Forecast | TSLA NVDA AAPL AMZN META MSFTStock Market Forecast | NASDAQ:QQQ AMEX:SPY
Mag 7 Forecast | NASDAQ:TSLA NASDAQ:NVDA AAPL AMZN META MSFT

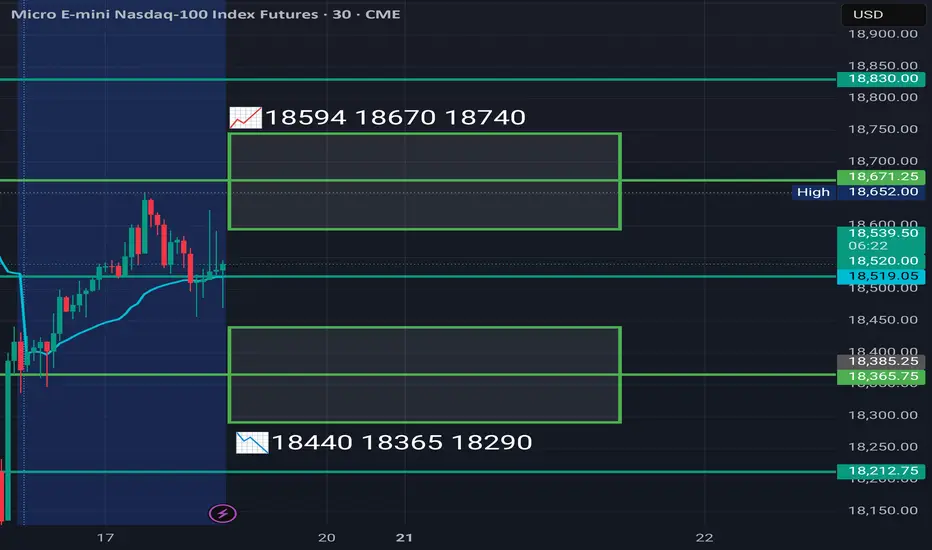
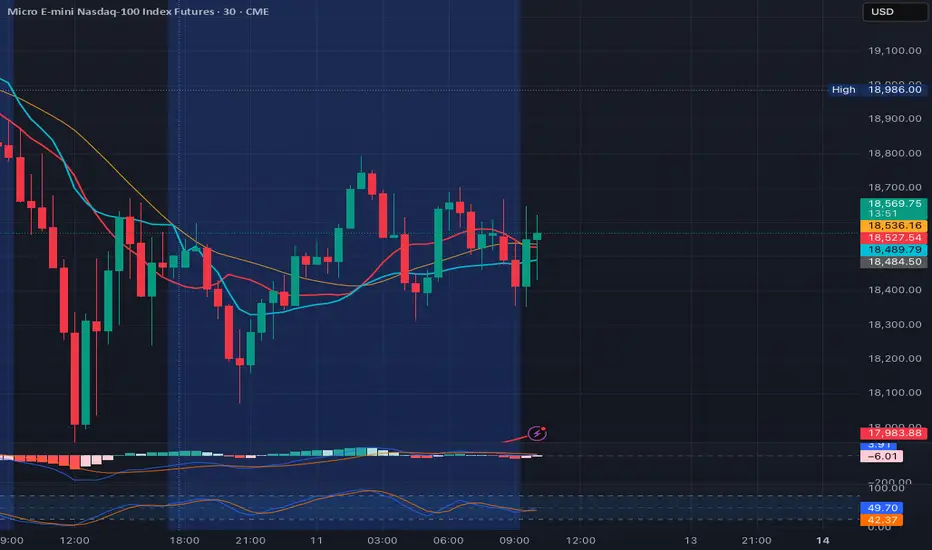
MNQ!/NQ1! Day Trade Plan for 04/17/2025MNQ!/NQ1! Day Trade Plan for 04/17/2025
📈18594 18670 18740
📉18440 18365 18290
Thanks to all my followers! Truly appreciate the support!
Please like and share for more NQ levels Tues & Thurs 🤓📈📉🎯💰
*These levels are derived from comprehensive backtesting and research and a quantitative system demonstrating high accuracy. This statistical foundation suggests that price movements are likely to exceed initial estimates.*
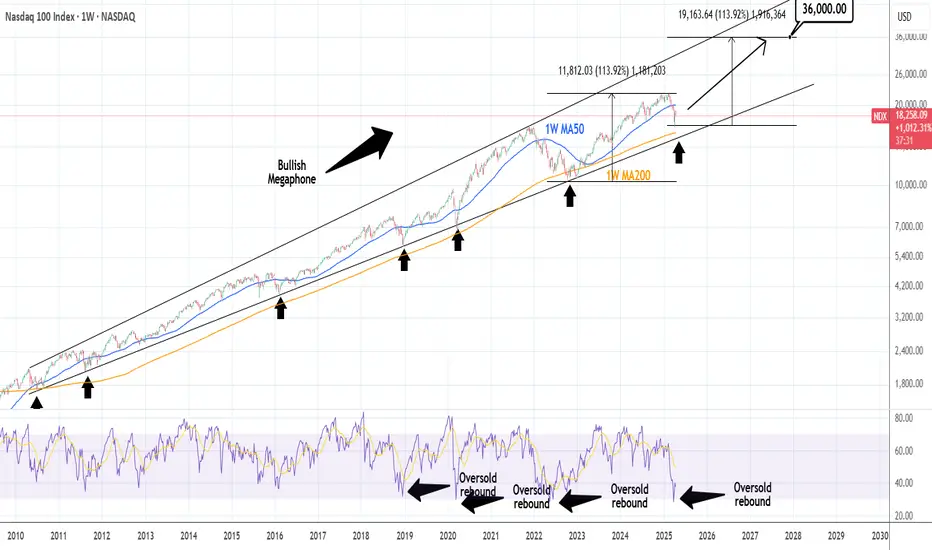
NASDAQ: Stop the noise. Long term investors are buying here.Nasdaq may be recovering on its 1D technical outlook but remains bearish on the 1W (RSI = 37.616, MACD = -451.790, ADX = 38.564) as the timeframe is still under the dramatic effect of the 3 month correction. The market however appears to be finding support a little over the 1W MA200 and may turn out to be the new long term technical bottom as the 1W RSI rebounded from oversold grounds.
The last three times that happened, the index rose aggressively. The 15 year pattern is a Bullish Megaphone and every rally inside it obviously gets stronger. As long as the market is holding the 1W MA200, the trend will be bullish and this is the right opportunity to buy for the long term, aiming at another +113.90% bullish wave (TP = 36,000) to get hit towards the end of 2027.
## If you like our free content follow our profile to get more daily ideas. ##
## Comments and likes are greatly appreciated. ##
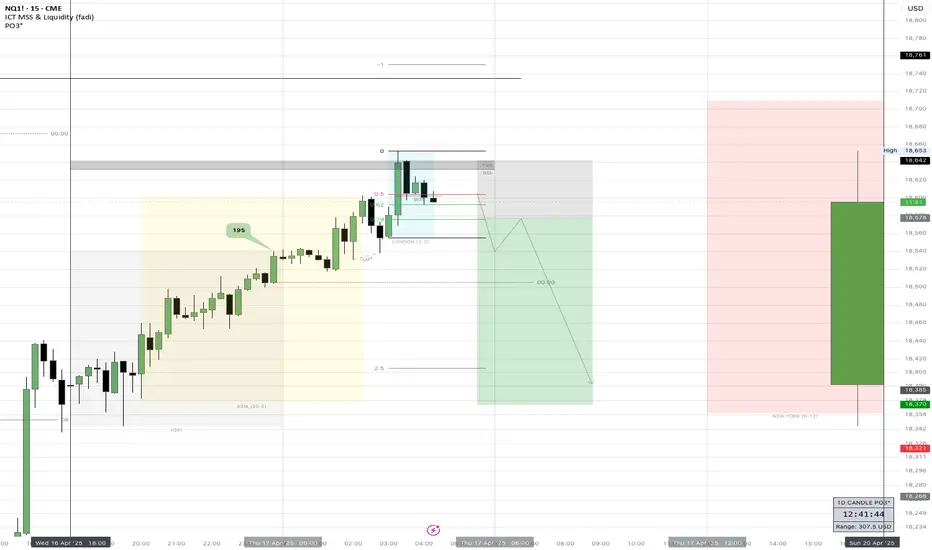
NQ! Short Idea (MMXM, Quarterly Theory) LONDON REVERSALHello everyone, today you will see my current Short Idea on the Nasdaq. I want to see the reaction of the 15M OB that we are sitting in, if we show Disrespect of that Area, I will be looking for Shorts.
Praise be to God
-T-
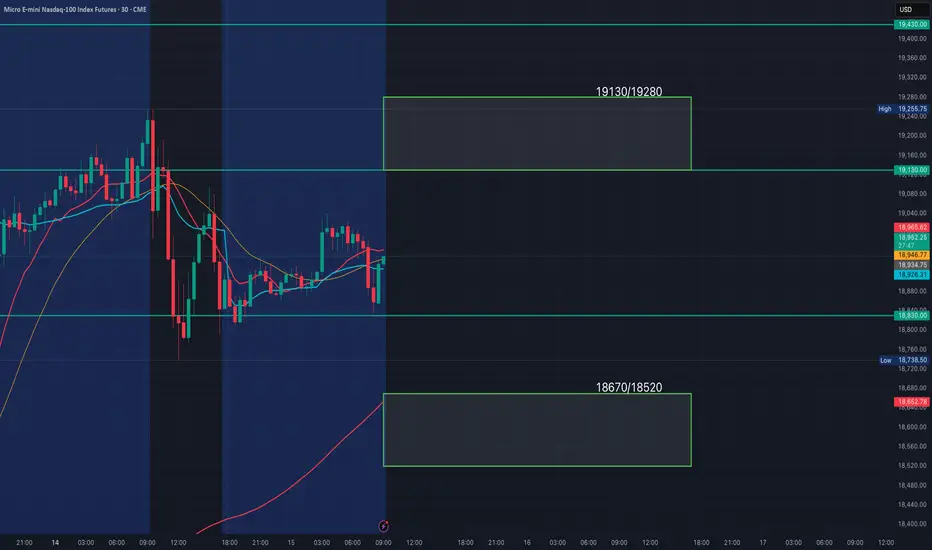
MNQ!/NQ1! Day Trade Plan for 04/15/2025MNQ!/NQ1! Day Trade Plan for 04/15/2025
📈19130 19280
📉18670 18520
Thanks to all my followers! Truly appreciate the support!
Please like and share for more NQ levels Tues & Thurs 🤓📈📉🎯💰
*These levels are derived from comprehensive backtesting and research and a quantitative system demonstrating high accuracy. This statistical foundation suggests that price movements are likely to exceed initial estimates.*
Daily Price Action: Futures Nasdaq NQ1! Tuesday 4/15/2025In this video, we are looking into the potential daily price action of NQ1!.

Does the Nasdaq keep dropping after approaching the nearby high?I have 2 zone that are coded as a "no close above" that should have held no issue
The reason why I am short mainly is because we haven't visit 50% of the New Week Opening Gap and we have rejected from 50% of the bearish gap above the range. As well as volumetric divergence after the rally.
I want to see this gap at least partially filled before anything else this week can happen.
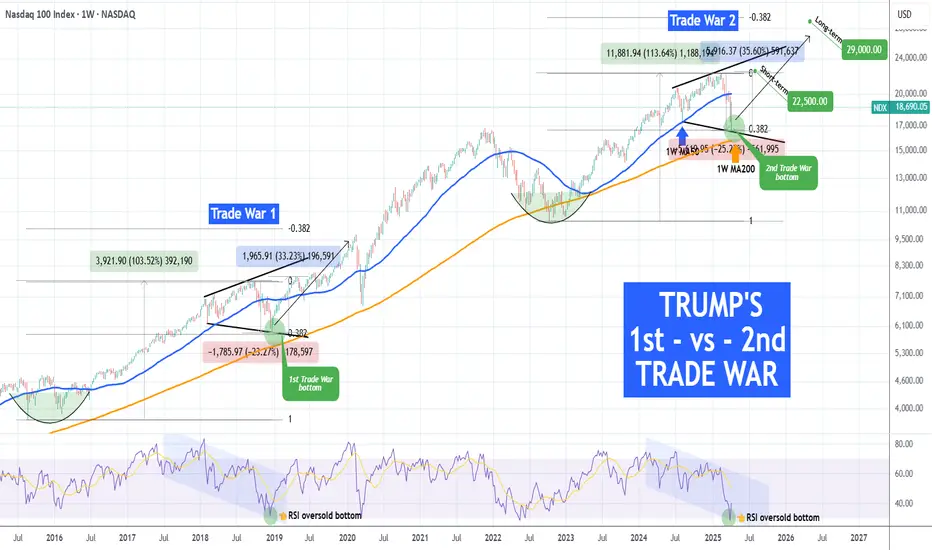
NASDAQ Trump's 2 TRADE WARS are identical! What you need to knowNASDAQ (NDX) had a massive bullish reversal 1W candle last week as, despite a Lower Low opening, the intra-week rebound surpassed the opening of the previous week. The sell-off reached almost as low as the 1W MA200 (orange trend-line) , which has been the Support level of the late 2022 Inflation Crisis bottom and has been untouched for more than 2 year.
This is not the first time we see this pattern. In an interesting twist of events, we saw the exact same formation during Trump's 1st Trade War, which bottomed on the week of December 24 2018, near the 1W MA200 as well and exactly on the 0.382 Fibonacci retracement level from the Top.
The similarities don't stop there as both Trade War periods were manifested within Megaphone patterns. Their sell-off/ Bearish Leg was -25% (now) and -23% (2018) respectively, while the set-up leading to those Megaphones was a +103.50% and +113.50% Bull Cycle respectively. Also both sell-offs got an oversold (30.00 or lower) 1W RSI bottom.
So, since NDX has currently completed a -25% correction near the 1W MA200 and the 0.382 Fib with the 1W RSI bouncing off the oversold barrier, it is very likely that we've formed the pattern's bottom, especially if the global fundamentals point towards trade deals.
If this Low remains intact, we expect a similar +35% short-term Top at 22500 within a 3-4 month period and then long-term rally near the -0.382 Fibonacci extension at 29000.
-------------------------------------------------------------------------------
** Please LIKE 👍, FOLLOW ✅, SHARE 🙌 and COMMENT ✍ if you enjoy this idea! Also share your ideas and charts in the comments section below! This is best way to keep it relevant, support us, keep the content here free and allow the idea to reach as many people as possible. **
-------------------------------------------------------------------------------
💸💸💸💸💸💸
👇 👇 👇 👇 👇 👇
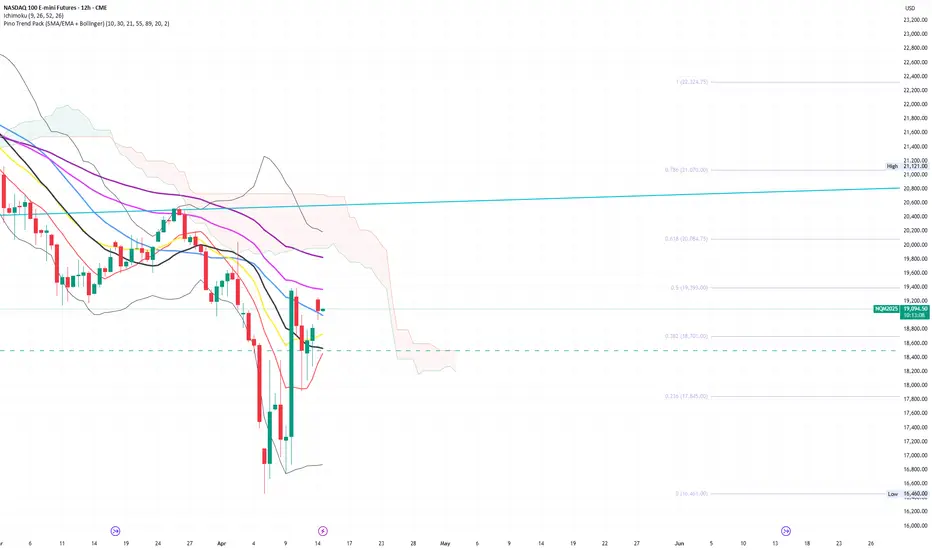
Nasdaq Technical Analysis. What Makes Nasdaq a Trader’s Favorite📊 Nasdaq Technical Analysis – Week 15, 2025
This week’s Nasdaq structure suggests a high probability of sideways movement between 19,500 and 18,700,
despite recent macro-driven volatility.
Key headlines include: – U.S. tariff adjustments & China’s 125% retaliation
– March CPI hitting the lowest level since early 2021
– Bond market instability and capital outflows
From a technical perspective:
🔹 volatility on the weekly is overheated — suggesting reduced volatility ahead
🔹 Fibonacci 0.618 near 20,084 may act as short-term resistance
🔹 Ideal long zone sits between 18,600 and 18,700, with invalidation below 18,500
(by 12H closure)
🔹 Ideal long zone sits between 18,000 and 18,300, with invalidation below 17,900
(Just a touch of 17,900 might invalidate this idea)
This analysis includes trendline setups held since 2023, confirming the value of clean charting.
A full structure review from Yearly to 4H charts is included.
No news-based guesswork. Just structured, chart-driven insight.
📌 If this chart aligns with your bias, feel free to save, comment, or follow.
Weekly Market Forecast: Stocks Markets Could Push Higher!In this video, we will analyze the S&P 500, NASDAQ, and DOW JONES futures for the week of April 14-18th.
The Stock Market Indices ended a turbulent week on a bullish note, and next week could see some continuation. The markets have peeked above the consolidation, and could be on the way to resume the overall bullish trend.
Wait for confirmations of the trend before jumping in! One bad report of tariffs or geo-political news can turn the markets down at any time.
Enjoy!
May profits be upon you.
Leave any questions or comments in the comment section.
I appreciate any feedback from my viewers!
Like and/or subscribe if you want more accurate analysis.
Thank you so much!
Disclaimer:
I do not provide personal investment advice and I am not a qualified licensed investment advisor.
All information found here, including any ideas, opinions, views, predictions, forecasts, commentaries, suggestions, expressed or implied herein, are for informational, entertainment or educational purposes only and should not be construed as personal investment advice. While the information provided is believed to be accurate, it may include errors or inaccuracies.
I will not and cannot be held liable for any actions you take as a result of anything you read here.
Conduct your own due diligence, or consult a licensed financial advisor or broker before making any and all investment decisions. Any investments, trades, speculations, or decisions made on the basis of any information found on this channel, expressed or implied herein, are committed at your own risk, financial or otherwise.

MNQ!/NQ1! Day Trade Plan for 04/11/2025MNQ!/NQ1! Day Trade Plan for 04/11/2025 (Just because 😏)
📈18670 18820
📉18220 18060
Thanks to all my followers! Truly appreciate the support!
Please like and share for more NQ levels Tues & Thurs 🤓📈📉🎯💰
*These levels are derived from comprehensive backtesting and research and a quantitative system demonstrating high accuracy. This statistical foundation suggests that price movements are likely to exceed initial estimates.*
Is Stock Market Bottom Here or Continue Crashing?Stock Market Analysis | NASDAQ:QQQ AMEX:SPY
Mag 7 Analysis | NASDAQ:TSLA NASDAQ:NVDA AAPL AMZN META GOOGL MSFT

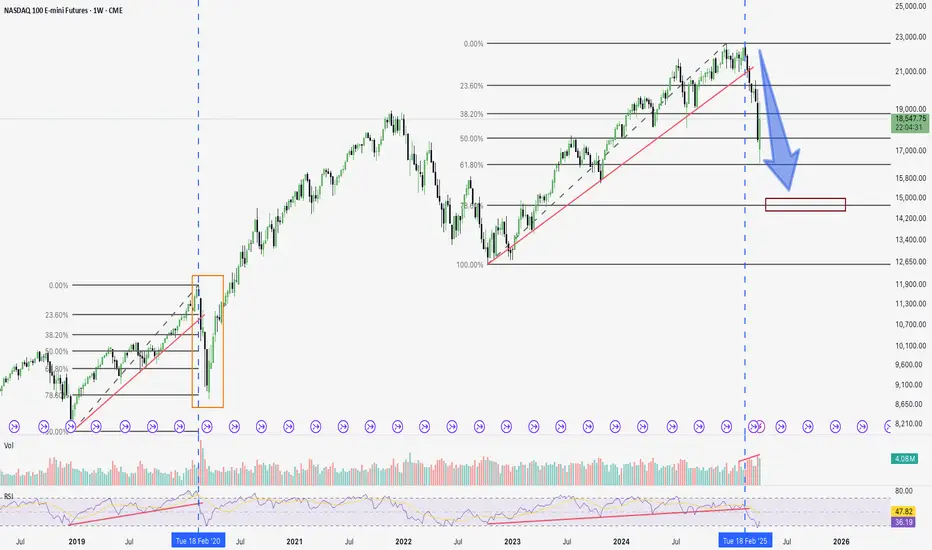
Does History Repeat Itself? How Far Can the Nasdaq Fall?Let's examine the current 2025 correction on a logarithmic chart: the price movements show significant similarities to the February 2020 decline. At that time, the global crisis—then driven by COVID-19 panic—fundamentally influenced market movements, while now, trade uncertainties are generated by President Trump's aggressive tariff announcements.
The chart reveals that the Nasdaq is declining steeply, and technical levels play a decisive role: yesterday, the price bounced back from the 61.8% Fibonacci retracement level. However, it is clear that supporting technical indicators—such as the break of the RSI convergence trend on the days triggering the decline—confirm the downward movement.
In the earlier 2020 decline, massive volume accompanied the initial weeks' movements, while this year's movement is characterized by steadily increasing volume. Nevertheless, the current volume peak falls short of the peak measured in the 2020 week (4.45 million vs. 6.8 million), indicating that the trend may continue with further declines.
Overall, technical analysis—the examination of logarithmic charts, the break of the RSI trend, and volume movements—suggests that the current correction may deepen further, and the Nasdaq's target price can be estimated between 14,500 and 15,000 points.
Observing a similar scenario in history, when global events triggered high volatility, it appears that market reactions now do not differ from past patterns. If the current negative trend continues, a further deepening of the correction is plausible, as the lag in market volume (4.45M vs. 6.8M) indicates that investors have not yet been able to offset the negative sentiment prevailing in the sector.
MNQ!/NQ1! Day Trade Plan for 04/10/2025MNQ!/NQ1! Day Trade Plan for 04/10/2025
📈19130
📉18530
Thanks to all my followers! Truly appreciate the support!
Please like and share for more NQ levels Tues & Thurs 🤓📈📉🎯💰
*These levels are derived from comprehensive backtesting and research and a quantitative system demonstrating high accuracy. This statistical foundation suggests that price movements are likely to exceed initial estimates.*

Trade the range until it breaks Nvidia updateThis video is a quick recap on the previous video after the levels I gave produced 30% move to the upside after patiently waiting for the move down to 90$.
So what now is the big question after the unprecedented move we had yesterday .
I outline the next best Short/Long setup and define why I think we stay inside of the range until Earnings Data .

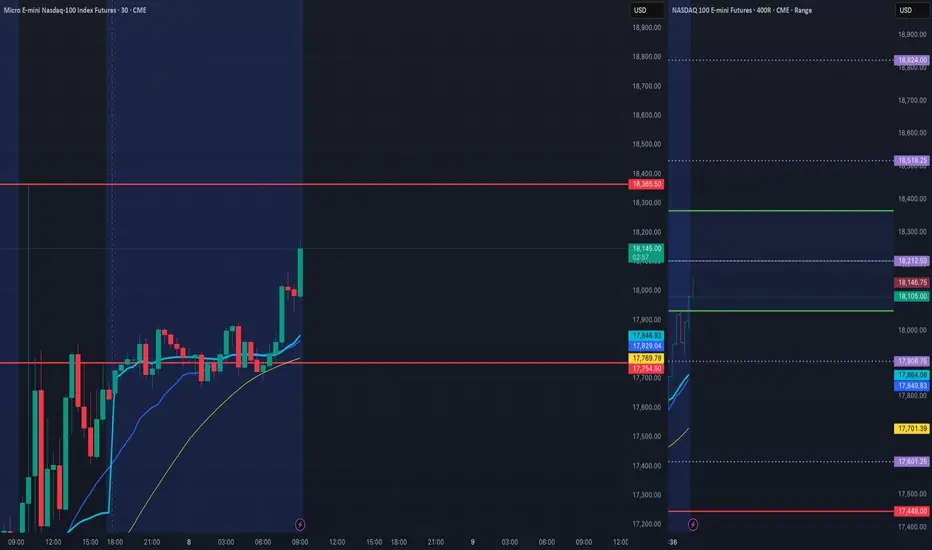
MNQ!/NQ1! Day Trade Plan for 04/08/2025MNQ!/NQ1! Day Trade Plan for 04/08/2025
📈18365
📉17755
Thanks to all my followers! Truly appreciate the support!
Please like and share for more NQ levels Tues & Thurs 🤓📈📉🎯💰
*These levels are derived from comprehensive backtesting and research and a quantitative system demonstrating high accuracy. This statistical foundation suggests that price movements are likely to exceed initial estimates.*
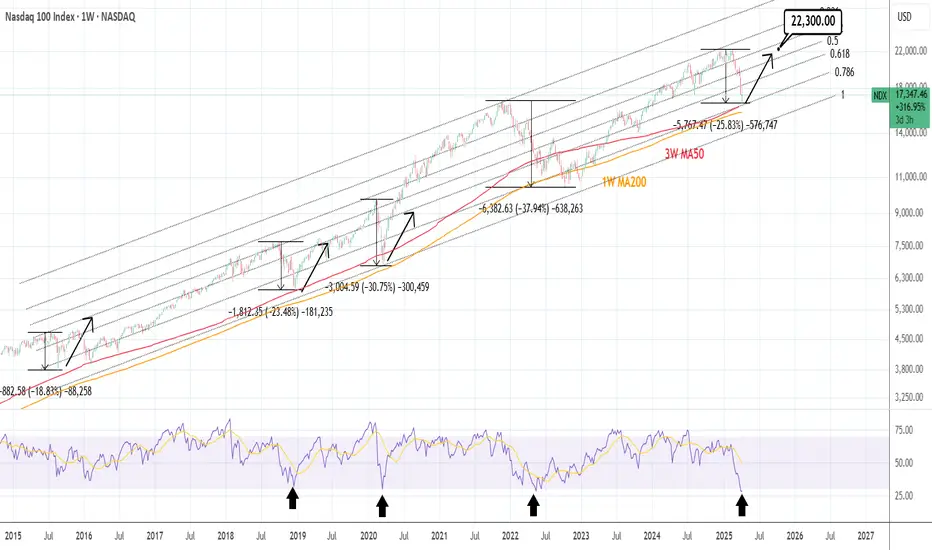
NASDAQ: Cyclical correction most likely completed. ATH by June?Nasdaq remains oversold both on its 1D (RSI = 25.630) and 1W (RSI = 28.851, MACD = -442.980, ADX = 36.399) technical outlook as yesterday's rally is being corrected today on strong technical selling. Long term it looks like this was a cyclical correction, reached -25%, hit the 3W MA50/1W MA200 zone (which has been the best buy entry in the past 10 years) that has most likely been completed. In addition, the 1W RSI is on the same oversold levels as May 16th 2022, the lowest it has been since 2008. According to the Fibonacci Channel Up, the market can hit 22,300 as early as June.
## If you like our free content follow our profile to get more daily ideas. ##
## Comments and likes are greatly appreciated. ##
Nasdaq trading insights: 08-APRIL-2025Nasdaq trading insights: Not signals, but informative zones to aid your decision-making. Please note: These zones are not trading advice. Use them as a starting point for your own analysis.

Nasdaq Enters Correction Territory Do we go Deeper
Monthly analysis done on the NQ with the ambition to connect with current price activity and gauge a deeper technical understanding on if this is just the start of a bigger correction for the year ahead . Tools used in this video Standard Fib , TR Pocket , CVWAP/ PVWAP Incorporating PVWAP and CVWAP into trading strategies allows for a more nuanced understanding of market dynamics used to assess trading performance and market trends.
Date and price range and trend line .
Some research below regarding the previous correction that I reference the technicals to in the video .
In November 2021, the Nasdaq reached record highs
However, concerns over rising inflation, potential interest rate hikes by the Federal Reserve, and supply chain disruptions led to increased market volatility. These factors contributed to a correction in the Nasdaq, with the index experiencing notable declines as investors reassessed valuations, particularly in high-growth technology stocks.
VS Today
March 2025 Correction:
As of March 2025, the Nasdaq Composite has faced another significant correction. On March 10, 2025, the index plummeted by 4%, shedding 728 points, marking its third-worst point loss ever, with only earlier losses during the COVID-19 pandemic surpassing this.
This downturn has been attributed to several factors:
Economic Policies: President Trump's announcement of increased tariffs on Canada, Mexico, and China has unsettled markets, raising fears of a potential recession
Inflation Concerns: Investors are closely monitoring upcoming consumer-price index (CPI) reports to gauge inflation trends, as higher-than-expected inflation could hinder the Federal Reserve's ability to lower interest rates, exacerbating stock market declines
Sector-Specific Declines: Major technology companies, including Tesla, have experienced significant stock price declines, contributing to the overall downturn in the Nasdaq
Comparison of the Two Corrections:
Catalysts: The November 2021 correction was primarily driven by concerns over rising inflation and potential interest rate hikes. In contrast, the March 2025 correction has been influenced by geopolitical factors, including new tariff announcements, and ongoing inflation concerns.
Magnitude: While both corrections were significant, the March 2025 correction has been more severe in terms of single-day point losses. The 4% drop on March 10, 2025, resulted in a loss of 728 points, marking it as one of the most substantial declines in the index's history.
Investor Sentiment: Both periods saw increased market volatility and a shift towards risk aversion. However, the recent correction has been accompanied by heightened fears of a potential recession, partly due to inconsistent government messaging regarding economic prospects.
In summary, while both corrections were driven by concerns over inflation and economic policies, the March 2025 correction has been more pronounced, with additional factors such as new tariffs and recession fears playing a significant role.

Nasdaq Update after hitting 16.5Target This video is a recap for the short video I done at 21000 and the reaction zone at 16500.
Played out exactly as laid out in the original video although much faster than I had anticipated.
I cover the current PA and what could occur next .
