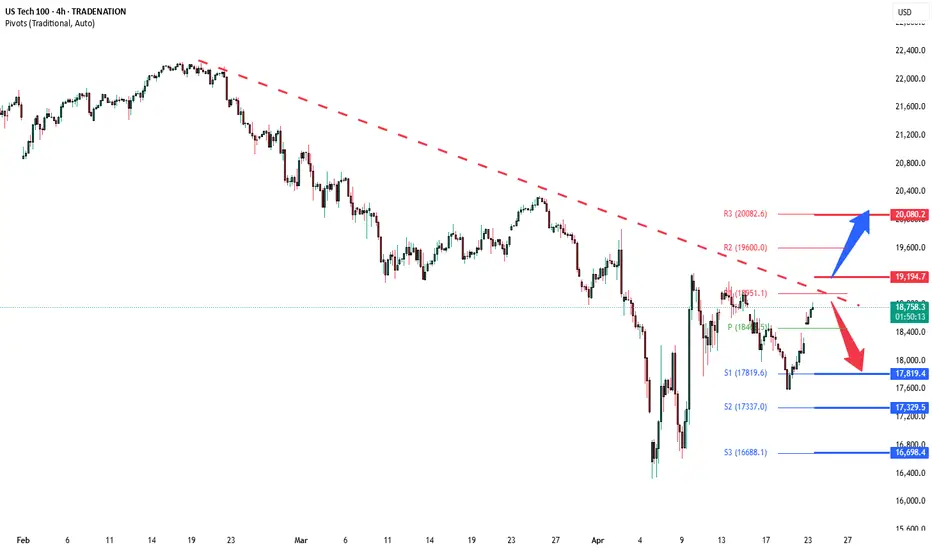
NSDQ100 INTRADAY resistance retest U.S. futures rose and the dollar strengthened after Donald Trump eased concerns that had been weighing on markets. He stated he has no plans to fire Fed Chair Jerome Powell, despite ongoing frustrations over interest rates. While this helped calm nerves, Bloomberg's John Authers cautions against viewing it as a major shift in sentiment.
Trump also struck a more conciliatory tone on China, saying he intends to be “very nice” in trade talks and suggested tariffs could be lowered if a deal is reached—indicating a possible softening of his approach toward Beijing.
Key Support and Resistance Levels
Resistance Level 1: 19195
Resistance Level 2: 19600
Resistance Level 3: 20080
Support Level 1: 17820
Support Level 2: 17330
Support Level 3: 16700
This communication is for informational purposes only and should not be viewed as any form of recommendation as to a particular course of action or as investment advice. It is not intended as an offer or solicitation for the purchase or sale of any financial instrument or as an official confirmation of any transaction. Opinions, estimates and assumptions expressed herein are made as of the date of this communication and are subject to change without notice. This communication has been prepared based upon information, including market prices, data and other information, believed to be reliable; however, Trade Nation does not warrant its completeness or accuracy. All market prices and market data contained in or attached to this communication are indicative and subject to change without notice.
Nsdq100
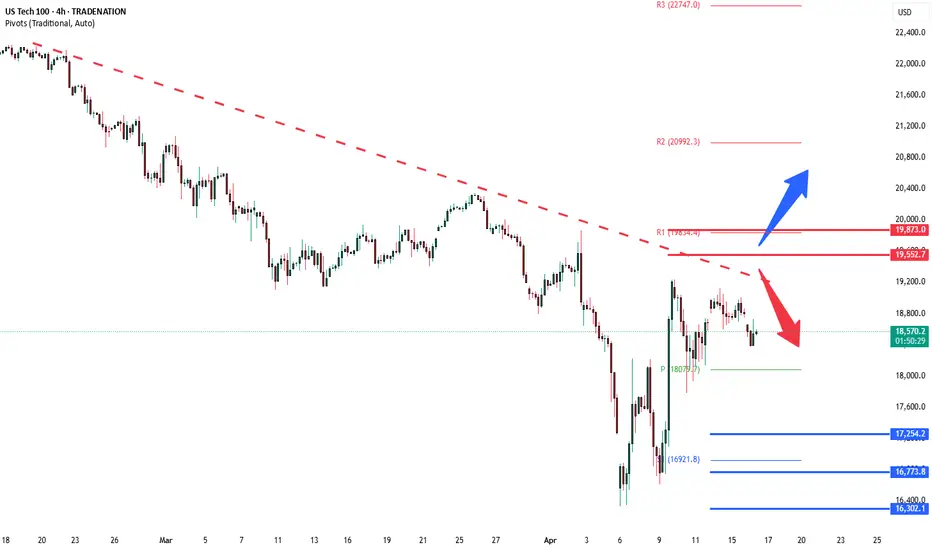
NSDQ100 INTRADAY resistance retest Tech stocks tumbled after the U.S. announced new restrictions on Nvidia chip exports to China and ASML posted weaker-than-expected results, sparking renewed trade war fears. The selloff wiped out $155 billion in market value between the two companies.
Meanwhile, China is holding off on trade talks, wanting the U.S. to take certain steps first—like toning down harsh rhetoric from officials—according to a source familiar with Beijing’s stance.
U.S. stock futures trimmed losses after that China news but still point to a lower open due to the tech slump. The dollar slid to a six-month low, while investors moved into safe havens, gold hit a record high and the Swiss franc gained.
Key Support and Resistance Levels
Resistance Level 1: 19200
Resistance Level 2: 19550
Resistance Level 3: 19870
Support Level 1: 17250
Support Level 2: 16773
Support Level 3: 16300
This communication is for informational purposes only and should not be viewed as any form of recommendation as to a particular course of action or as investment advice. It is not intended as an offer or solicitation for the purchase or sale of any financial instrument or as an official confirmation of any transaction. Opinions, estimates and assumptions expressed herein are made as of the date of this communication and are subject to change without notice. This communication has been prepared based upon information, including market prices, data and other information, believed to be reliable; however, Trade Nation does not warrant its completeness or accuracy. All market prices and market data contained in or attached to this communication are indicative and subject to change without notice.
NSDQ100 China to Hike Tariffs on All US Goods – Market MixedChina to Hike Tariffs on All US Goods – Market Reaction Mixed
China announced it will raise tariffs on all US imports from 84% to 125%, effective April 12. The move follows Washington’s decision to increase levies on Chinese goods to 145% earlier this year.
However, Beijing signaled it will no longer respond to future US tariff increases, calling the back-and-forth “a joke,” suggesting a shift in tone from retaliation to dismissal.
Market Reaction:
USD: The dollar weakened further following the announcement, reflecting rising trade tensions and risk-off sentiment.
Equities: US futures turned lower as traders priced in the potential economic drag from escalating tariffs.
Gold: Continued to rise, reinforcing its role as a preferred safe-haven amid geopolitical uncertainty.
US Treasuries: Traditionally seen as a safe-haven, Treasuries underperformed, suggesting investor confidence in them may be weakening under mounting fiscal and trade concerns.
Analysis:
Markets are increasingly pricing in the fallout from an intensifying US-China trade standoff. The rise in gold and the dip in Treasuries suggest a shift in investor preference toward alternative safe-haven assets. If trade tensions continue to escalate, further downside in risk assets and USD strength reversal are possible.
Key Support and Resistance Levels
Resistance Level 1: 19000
Resistance Level 2: 19552
Resistance Level 3: 19873
Support Level 1: 17254
Support Level 2: 16773
Support Level 3: 16400
This communication is for informational purposes only and should not be viewed as any form of recommendation as to a particular course of action or as investment advice. It is not intended as an offer or solicitation for the purchase or sale of any financial instrument or as an official confirmation of any transaction. Opinions, estimates and assumptions expressed herein are made as of the date of this communication and are subject to change without notice. This communication has been prepared based upon information, including market prices, data and other information, believed to be reliable; however, Trade Nation does not warrant its completeness or accuracy. All market prices and market data contained in or attached to this communication are indicative and subject to change without notice.

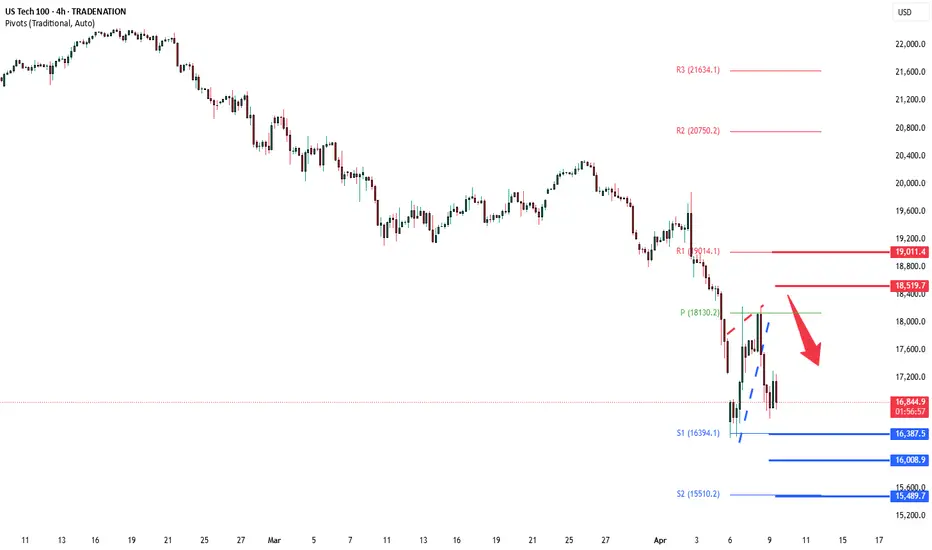
NSDQ100 INTRADAY oversold bounce backDonald Trump’s new reciprocal tariffs are now in place, adding pressure to the global economy as he aims to reshape international trade. Unlike past moves, China hasn’t responded immediately, marking a shift from its usual quick retaliation.
European and Japanese stocks fell on rising trade tensions, while U.S. futures remain steady ahead of the open. According to Goldman Sachs’s John Flood, the S&P 500 has dropped to a level where long-term investors are beginning to step in.
Key Support and Resistance Levels
Resistance Level 1: 18130
Resistance Level 2: 18520
Resistance Level 3: 19000
Support Level 1: 16387
Support Level 2: 16000
Support Level 3: 15490
This communication is for informational purposes only and should not be viewed as any form of recommendation as to a particular course of action or as investment advice. It is not intended as an offer or solicitation for the purchase or sale of any financial instrument or as an official confirmation of any transaction. Opinions, estimates and assumptions expressed herein are made as of the date of this communication and are subject to change without notice. This communication has been prepared based upon information, including market prices, data and other information, believed to be reliable; however, Trade Nation does not warrant its completeness or accuracy. All market prices and market data contained in or attached to this communication are indicative and subject to change without notice.
Russell 2000 INTRADAY oversold bounce back
Key Support and Resistance Levels
Resistance Level 1: 1889
Resistance Level 2: 1920
Resistance Level 3: 2000
Support Level 1: 1700
Support Level 2: 1640
Support Level 3: 1590
This communication is for informational purposes only and should not be viewed as any form of recommendation as to a particular course of action or as investment advice. It is not intended as an offer or solicitation for the purchase or sale of any financial instrument or as an official confirmation of any transaction. Opinions, estimates and assumptions expressed herein are made as of the date of this communication and are subject to change without notice. This communication has been prepared based upon information, including market prices, data and other information, believed to be reliable; however, Trade Nation does not warrant its completeness or accuracy. All market prices and market data contained in or attached to this communication are indicative and subject to change without notice.
NSDQ100 INTRADAY key trading levels ahead of US NFPKey Support and Resistance Levels
Resistance Level 1: 18435
Resistance Level 2: 18800
Resistance Level 3: 19580
Support Level 1: 17680
Support Level 2: 17300
Support Level 3: 17000
This communication is for informational purposes only and should not be viewed as any form of recommendation as to a particular course of action or as investment advice. It is not intended as an offer or solicitation for the purchase or sale of any financial instrument or as an official confirmation of any transaction. Opinions, estimates and assumptions expressed herein are made as of the date of this communication and are subject to change without notice. This communication has been prepared based upon information, including market prices, data and other information, believed to be reliable; however, Trade Nation does not warrant its completeness or accuracy. All market prices and market data contained in or attached to this communication are indicative and subject to change without notice.

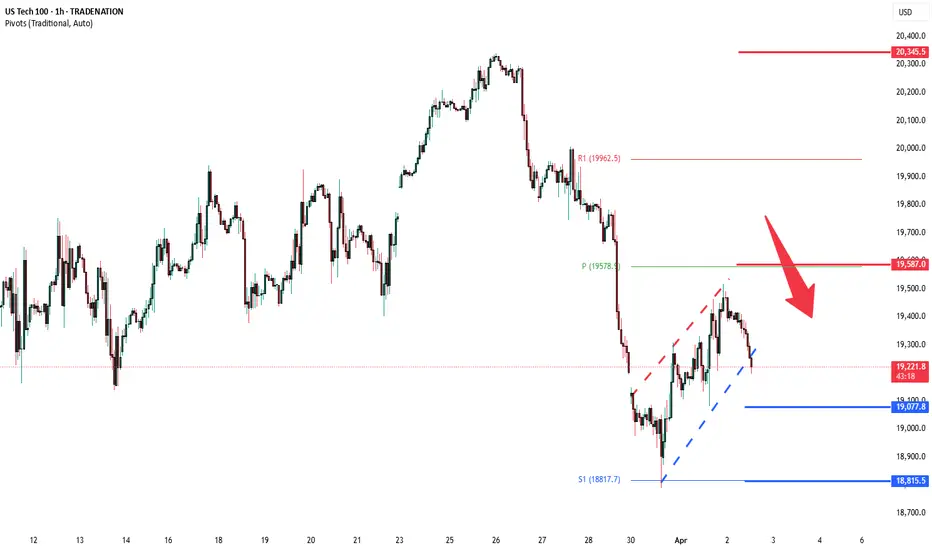
NSDQ100 INTRADAY ahead of tariff announcement Donald Trump’s team is finalizing options for a reciprocal tariff plan, with proposals including a tiered system and a customized approach. Markets await clarity from the president’s 4 p.m. Rose Garden announcement, which could impact trade and financial markets.
Resistance Level 1: 19579
Resistance Level 2: 19962
Resistance Level 3: 20345
Support Level 1: 19077
Support Level 2: 18815
Support Level 3: 18434
This communication is for informational purposes only and should not be viewed as any form of recommendation as to a particular course of action or as investment advice. It is not intended as an offer or solicitation for the purchase or sale of any financial instrument or as an official confirmation of any transaction. Opinions, estimates and assumptions expressed herein are made as of the date of this communication and are subject to change without notice. This communication has been prepared based upon information, including market prices, data and other information, believed to be reliable; however, Trade Nation does not warrant its completeness or accuracy. All market prices and market data contained in or attached to this communication are indicative and subject to change without notice.
NSDQ100 INTRADAY bearish reaction to US PCE data US PCE Inflation – Market Impact (NASDAQ Focus)
Headline PCE YoY: 2.5% (steady, in line with expectations).
Core PCE YoY: 2.8% (higher than 2.7% prior, above forecasts).
MoM Figures: Headline +0.3%, Core +0.4% (showing steady inflation pressure).
Market Implications for NASDAQ:
Slightly hawkish as Core PCE remains elevated—could delay Fed rate cuts.
Tech stocks (NASDAQ) may face short-term selling pressure as yields react.
If risk appetite holds, dips could present buying opportunities in growth stocks.
Watch Treasury yields & Fed commentary for further market direction.
Key Support and Resistance Levels
Resistance Level 1: 20000
Resistance Level 2: 20350
Resistance Level 3: 20650
Support Level 1: 19,440
Support Level 2: 19,140
Support Level 3: 18880
This communication is for informational purposes only and should not be viewed as any form of recommendation as to a particular course of action or as investment advice. It is not intended as an offer or solicitation for the purchase or sale of any financial instrument or as an official confirmation of any transaction. Opinions, estimates and assumptions expressed herein are made as of the date of this communication and are subject to change without notice. This communication has been prepared based upon information, including market prices, data and other information, believed to be reliable; however, Trade Nation does not warrant its completeness or accuracy. All market prices and market data contained in or attached to this communication are indicative and subject to change without notice.
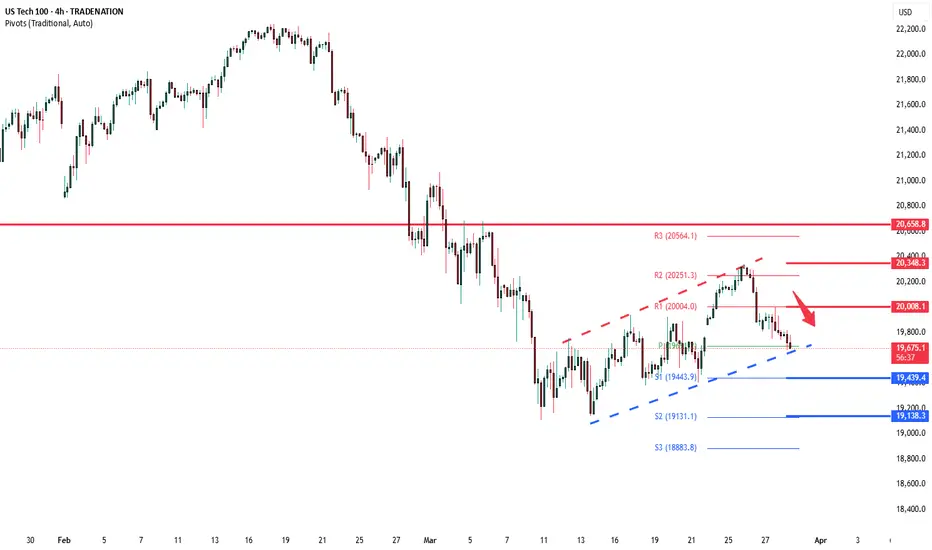
NSDQ100 INTRADAY no reaction to durable goods dataThe US Census Bureau reported that Durable Goods Orders increased 0.9% ($2.7 billion) in February, reaching $289.3 billion. This follows a revised 3.3% gain in January and beats market expectations of a 1% decline.
Excluding transportation, orders rose 0.7%.
Excluding defense, orders increased 0.8%.
Transportation equipment led the gains, up 1.5% ($1.4 billion) to $98.3 billion.
Despite the positive data, equity markets showed little reaction.
Key Support and Resistance Levels
Resistance Level 1: 20,386
Resistance Level 2: 20,658
Resistance Level 3: 21,000
Support Level 1: 19,692
Support Level 2: 19,443
Support Level 3: 19,131
This communication is for informational purposes only and should not be viewed as any form of recommendation as to a particular course of action or as investment advice. It is not intended as an offer or solicitation for the purchase or sale of any financial instrument or as an official confirmation of any transaction. Opinions, estimates and assumptions expressed herein are made as of the date of this communication and are subject to change without notice. This communication has been prepared based upon information, including market prices, data and other information, believed to be reliable; however, Trade Nation does not warrant its completeness or accuracy. All market prices and market data contained in or attached to this communication are indicative and subject to change without notice.
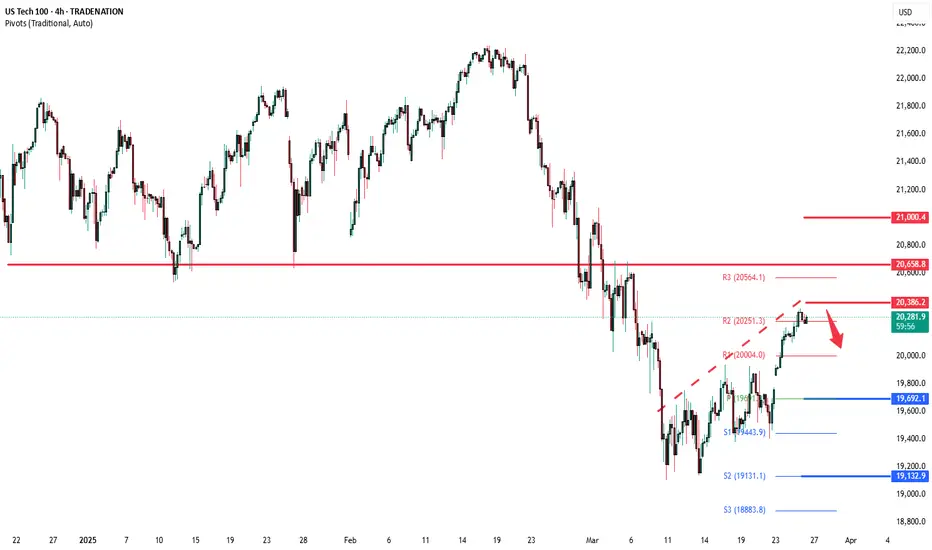
NSDQ100 The Week Ahead 24th March '25NSDQ100 bearish & oversold, the key trading level is at 20090
This communication is for informational purposes only and should not be viewed as any form of recommendation as to a particular course of action or as investment advice. It is not intended as an offer or solicitation for the purchase or sale of any financial instrument or as an official confirmation of any transaction. Opinions, estimates and assumptions expressed herein are made as of the date of this communication and are subject to change without notice. This communication has been prepared based upon information, including market prices, data and other information, believed to be reliable; however, Trade Nation does not warrant its completeness or accuracy. All market prices and market data contained in or attached to this communication are indicative and subject to change without notice.

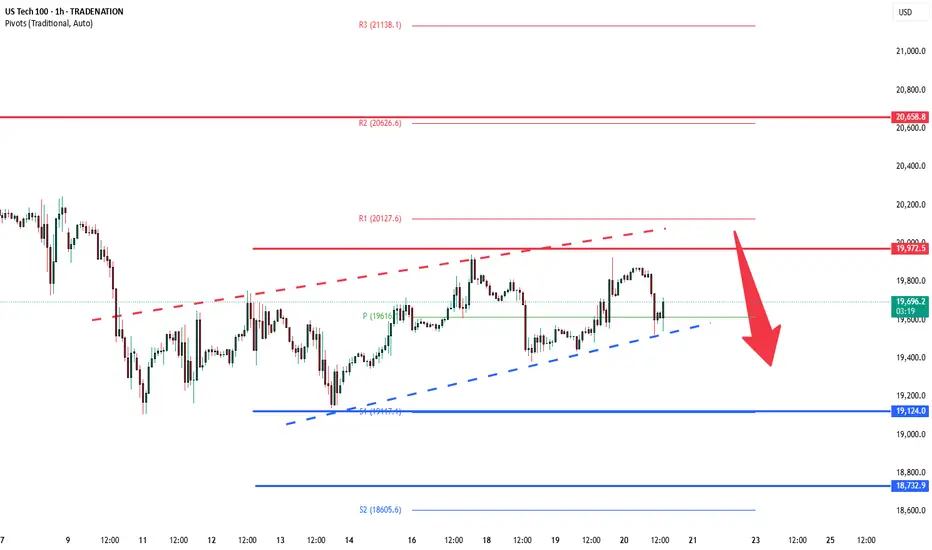
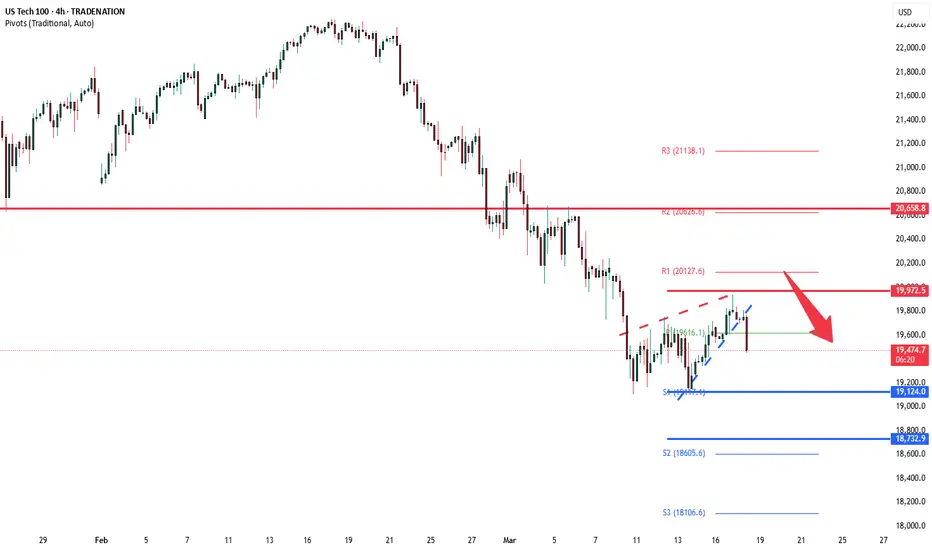
NSDQ100 INTRADAY Bearish oversold bounce back
Key Support and Resistance Levels
Resistance Level 1: 19972
Resistance Level 2: 20127
Resistance Level 3: 20658
Support Level 1: 19124
Support Level 2: 18732
Support Level 3: 18100
This communication is for informational purposes only and should not be viewed as any form of recommendation as to a particular course of action or as investment advice. It is not intended as an offer or solicitation for the purchase or sale of any financial instrument or as an official confirmation of any transaction. Opinions, estimates and assumptions expressed herein are made as of the date of this communication and are subject to change without notice. This communication has been prepared based upon information, including market prices, data and other information, believed to be reliable; however, Trade Nation does not warrant its completeness or accuracy. All market prices and market data contained in or attached to this communication are indicative and subject to change without notice.
NSDQ100 INTRADAY Oversold bounce back capped at 19972Key Support and Resistance Levels
Resistance Level 1: 19972
Resistance Level 2: 20127
Resistance Level 3: 20658
Support Level 1: 19124
Support Level 2: 18732
Support Level 3: 18100
This communication is for informational purposes only and should not be viewed as any form of recommendation as to a particular course of action or as investment advice. It is not intended as an offer or solicitation for the purchase or sale of any financial instrument or as an official confirmation of any transaction. Opinions, estimates and assumptions expressed herein are made as of the date of this communication and are subject to change without notice. This communication has been prepared based upon information, including market prices, data and other information, believed to be reliable; however, Trade Nation does not warrant its completeness or accuracy. All market prices and market data contained in or attached to this communication are indicative and subject to change without notice.
NSDQ100 The Week Ahead 17th March '25NSDQ100 INTRADAY bearish & oversold capped by resistance at 200 DMA.
This communication is for informational purposes only and should not be viewed as any form of recommendation as to a particular course of action or as investment advice. It is not intended as an offer or solicitation for the purchase or sale of any financial instrument or as an official confirmation of any transaction. Opinions, estimates and assumptions expressed herein are made as of the date of this communication and are subject to change without notice. This communication has been prepared based upon information, including market prices, data and other information, believed to be reliable; however, Trade Nation does not warrant its completeness or accuracy. All market prices and market data contained in or attached to this communication are indicative and subject to change without notice.

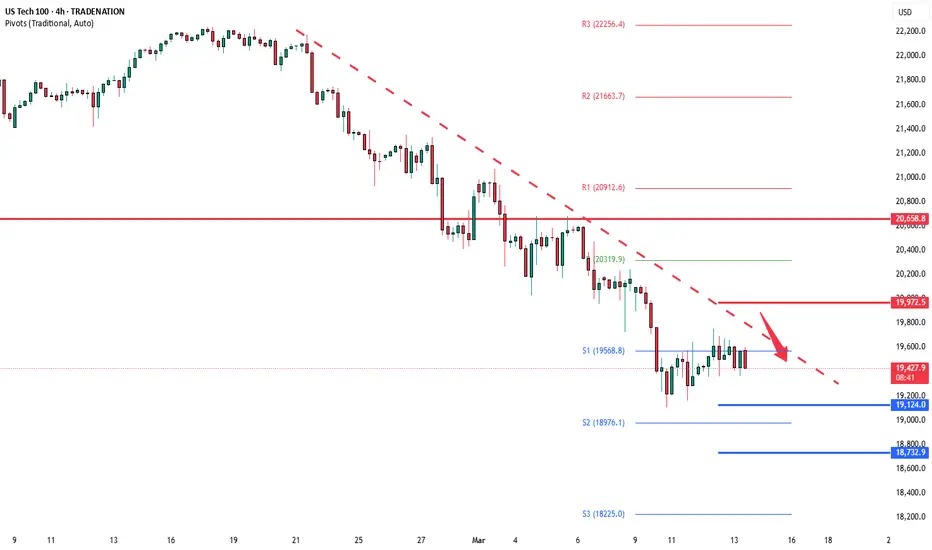
NSDQ INTRADAY Bearish continuation capped at 19970 New unemployment insurance claims in the US fell to 220,000 for the week ending March 8, slightly below expectations and down from the previous week's revised figure of 222,000 (originally 221,000). The insured unemployment rate remained steady at 1.2%, while the four-week moving average edged up by 1,500 to 226,000.
Meanwhile, continuing jobless claims dropped by 27,000 to 1.87 million for the week ending March 1.
Key Support and Resistance Levels
Resistance Level 19970
Resistance Level 2: 20300
Resistance Level 3: 20660
Support Level 1: 19124
Support Level 2: 18730
Support Level 3: 18220
This communication is for informational purposes only and should not be viewed as any form of recommendation as to a particular course of action or as investment advice. It is not intended as an offer or solicitation for the purchase or sale of any financial instrument or as an official confirmation of any transaction. Opinions, estimates and assumptions expressed herein are made as of the date of this communication and are subject to change without notice. This communication has been prepared based upon information, including market prices, data and other information, believed to be reliable; however, Trade Nation does not warrant its completeness or accuracy. All market prices and market data contained in or attached to this communication are indicative and subject to change without notice.
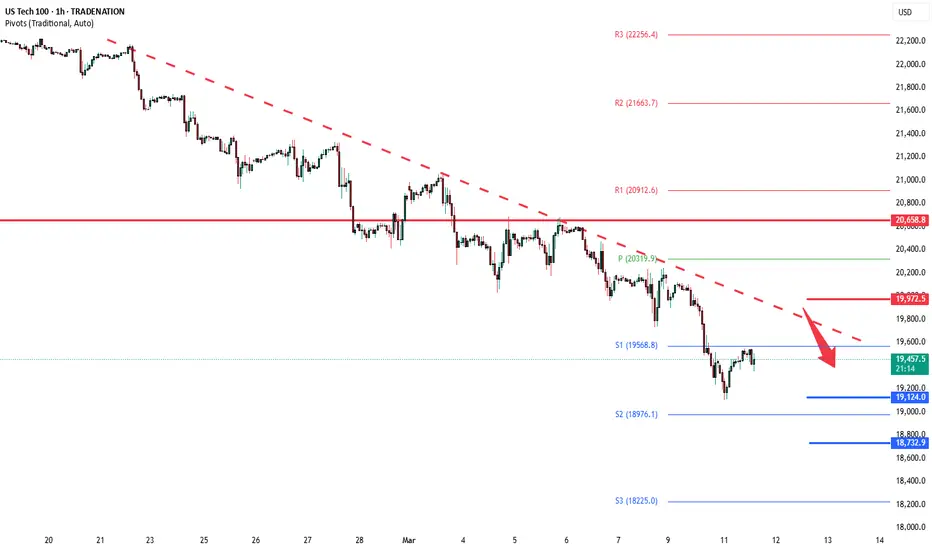
NSDQ100 INTRADAY Key Trading LevelsKey Support and Resistance Levels
Resistance Level 1: 19976
Resistance Level 2: 20300
Resistance Level 3: 20660
Support Level 1: 19570
Support Level 2: 19124
Support Level 3: 18750
This communication is for informational purposes only and should not be viewed as any form of recommendation as to a particular course of action or as investment advice. It is not intended as an offer or solicitation for the purchase or sale of any financial instrument or as an official confirmation of any transaction. Opinions, estimates and assumptions expressed herein are made as of the date of this communication and are subject to change without notice. This communication has been prepared based upon information, including market prices, data and other information, believed to be reliable; however, Trade Nation does not warrant its completeness or accuracy. All market prices and market data contained in or attached to this communication are indicative and subject to change without notice.
NSDQ100 The Week Ahead 10th March '25Sentiment: Neutral, Price action is consolidating in a tight trading range.
Resistance: Key Resistance is at 20660, followed by 21000 and 21315.
Support: Key support is at 19660 followed by 19300 and 18914.
This communication is for informational purposes only and should not be viewed as any form of recommendation as to a particular course of action or as investment advice. It is not intended as an offer or solicitation for the purchase or sale of any financial instrument or as an official confirmation of any transaction. Opinions, estimates and assumptions expressed herein are made as of the date of this communication and are subject to change without notice. This communication has been prepared based upon information, including market prices, data and other information, believed to be reliable; however, Trade Nation does not warrant its completeness or accuracy. All market prices and market data contained in or attached to this communication are indicative and subject to change without notice.

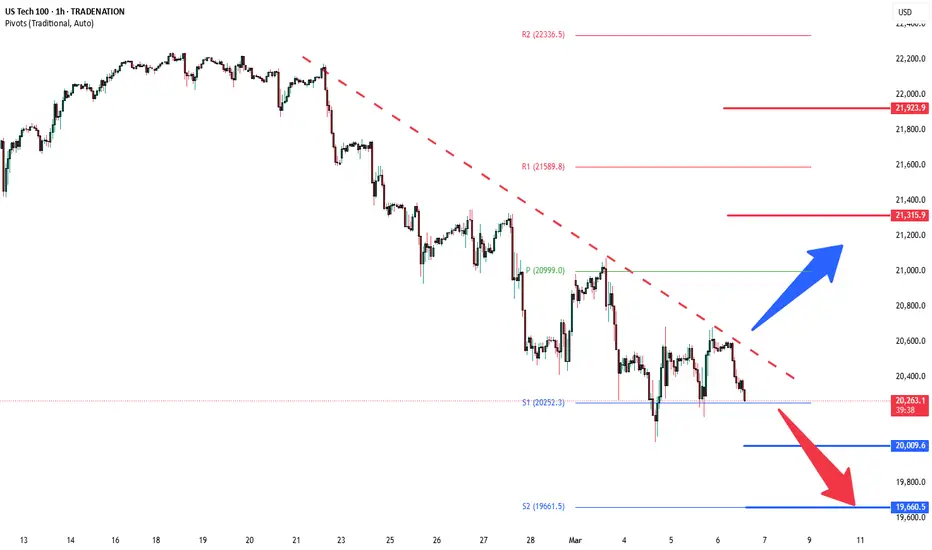
NASDAQ 100 INTRADAY capped by 20600 resistanceBearish Scenario:
The intraday sentiment remains bearish, with recent price action suggesting a corrective pullback. If the index faces rejection at the key resistance level of 20,600, it could trigger renewed selling pressure. A downside move could target 20,000 as the first support level, with further declines extending toward 19,800 and potentially 19,660 if bearish momentum strengthens.
Bullish Scenario:
A breakout above 20,600 and a daily close higher would invalidate the bearish outlook, signaling a potential shift in momentum. If sustained buying pressure emerges, the index could rally toward the next resistance at 21,000, followed by 21,315 and 21,590 as upside targets.
Conclusion:
The 20,600 level is pivotal in determining the next directional move. A failure to break above this resistance reinforces the bearish outlook, while a decisive breakout could signal renewed bullish strength. Traders should monitor price action at this key level for confirmation of the prevailing trend.
This communication is for informational purposes only and should not be viewed as any form of recommendation as to a particular course of action or as investment advice. It is not intended as an offer or solicitation for the purchase or sale of any financial instrument or as an official confirmation of any transaction. Opinions, estimates and assumptions expressed herein are made as of the date of this communication and are subject to change without notice. This communication has been prepared based upon information, including market prices, data and other information, believed to be reliable; however, Trade Nation does not warrant its completeness or accuracy. All market prices and market data contained in or attached to this communication are indicative and subject to change without notice.
NSDQ China & Canada trigger “tariffs retaliations selloff”The tech-heavy NASDAQ dropped yesterday, underperforming the market, while the Mag-7 fell 3.09%, now down over 10% in the past two weeks. Nvidia led the decline, plunging 8.69%. The Nasdaq 100 (USTec) index maintains a long term bullish outlook supported by its long-term uptrend. However, recent price action suggests a corrective pullback following the all-time high, bringing the index to a key technical support zone.
Bullish Scenario:
The 20280 level (200-day moving average) serves as a critical support zone, aligning with the long-term rising trendline.
A pullback towards this level, followed by a bullish bounce, could reaffirm the prevailing uptrend.
Upside targets include:
21200 (key resistance)
21450 (50-day moving average)
21620 (20-day moving average)
A strong rebound from 20280 could reinforce bullish momentum and set the stage for further gains.
Bearish Scenario:
A confirmed breakdown below 20280 with a daily close beneath this level would weaken the bullish structure.
This could trigger a deeper retracement, leading to downside targets at:
19990 (next key support)
19560, if bearish pressure intensifies
A sustained loss of 20280 may indicate a broader correction, potentially shifting sentiment in favor of sellers.
Market Outlook:
The 20280 level is pivotal—holding above this support will sustain the bullish trend, while a decisive break below it could signal extended downside risks. Traders should monitor price action and volume at this critical level to gauge the market’s next move.
This communication is for informational purposes only and should not be viewed as any form of recommendation as to a particular course of action or as investment advice. It is not intended as an offer or solicitation for the purchase or sale of any financial instrument or as an official confirmation of any transaction. Opinions, estimates and assumptions expressed herein are made as of the date of this communication and are subject to change without notice. This communication has been prepared based upon information, including market prices, data and other information, believed to be reliable; however, Trade Nation does not warrant its completeness or accuracy. All market prices and market data contained in or attached to this communication are indicative and subject to change without notice.
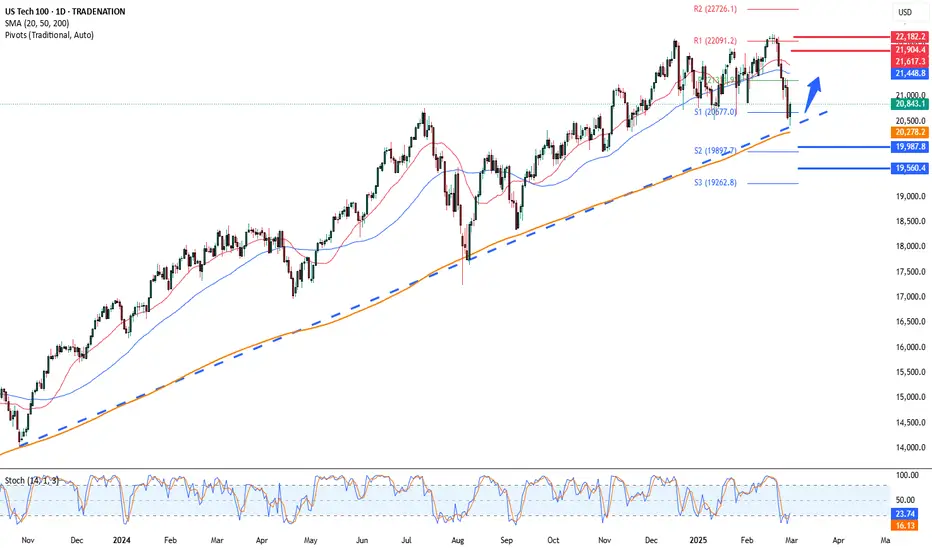
NSDQ100 oversold bounceback, The Week Ahead 03rd March '25The Nasdaq 100 (USTec) index maintains a bullish outlook, supported by its long-term uptrend. However, recent price action suggests a corrective pullback following the all-time high, bringing the index to a key technical support zone.
Bullish Scenario:
The 20280 level (200-day moving average) serves as a critical support zone, aligning with the long-term rising trendline.
A pullback towards this level, followed by a bullish bounce, could reaffirm the prevailing uptrend.
Upside targets include:
21200 (key resistance)
21450 (50-day moving average)
21620 (20-day moving average)
A strong rebound from 20280 could reinforce bullish momentum and set the stage for further gains.
Bearish Scenario:
A confirmed breakdown below 20280 with a daily close beneath this level would weaken the bullish structure.
This could trigger a deeper retracement, leading to downside targets at:
19990 (next key support)
19560, if bearish pressure intensifies
A sustained loss of 20280 may indicate a broader correction, potentially shifting sentiment in favor of sellers.
Market Outlook:
The 20280 level is pivotal—holding above this support will sustain the bullish trend, while a decisive break below it could signal extended downside risks. Traders should monitor price action and volume at this critical level to gauge the market’s next move.
This communication is for informational purposes only and should not be viewed as any form of recommendation as to a particular course of action or as investment advice. It is not intended as an offer or solicitation for the purchase or sale of any financial instrument or as an official confirmation of any transaction. Opinions, estimates and assumptions expressed herein are made as of the date of this communication and are subject to change without notice. This communication has been prepared based upon information, including market prices, data and other information, believed to be reliable; however, Trade Nation does not warrant its completeness or accuracy. All market prices and market data contained in or attached to this communication are indicative and subject to change without notice.
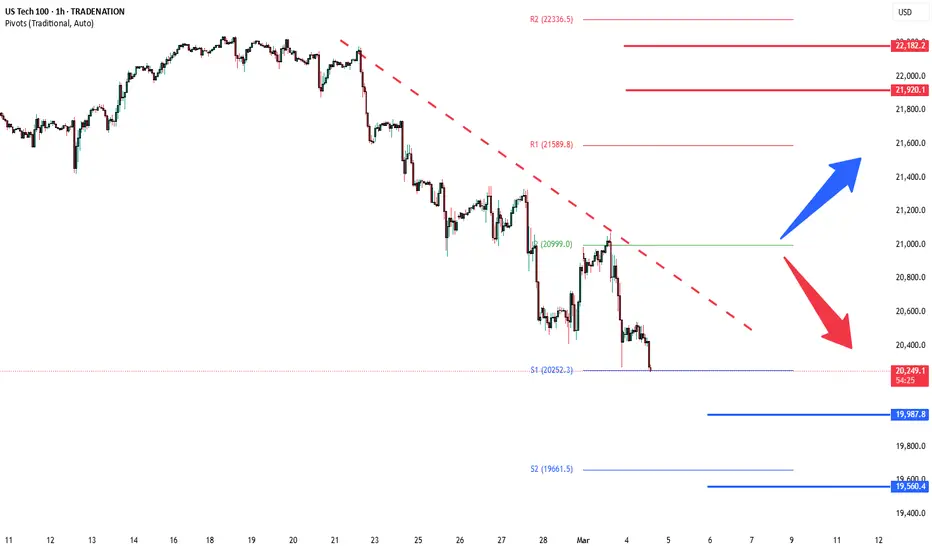
NSDQ100 INTRADAY support retestThe NSDQ (USTec) index pair price action sentiment appears bullish, supported by the longer-term prevailing uptrend. The recent intraday price action appears to be a corrective pullback after reaching the all-time high.
The key trading level is at 21230 level, the consolidation price range and also the support trendline zone. A corrective pullback from the current levels and a bullish bounce back from the 21230 level could target the upside resistance at 21815 followed by the 21890 and 22033 levels over the longer timeframe.
Alternatively, a confirmed loss of the 21230 support and a daily close below that level would negate the bullish outlook opening the way for a further retracement and a retest of the 21170 support level followed by 21050.
This communication is for informational purposes only and should not be viewed as any form of recommendation as to a particular course of action or as investment advice. It is not intended as an offer or solicitation for the purchase or sale of any financial instrument or as an official confirmation of any transaction. Opinions, estimates and assumptions expressed herein are made as of the date of this communication and are subject to change without notice. This communication has been prepared based upon information, including market prices, data and other information, believed to be reliable; however, Trade Nation does not warrant its completeness or accuracy. All market prices and market data contained in or attached to this communication are indicative and subject to change without notice.

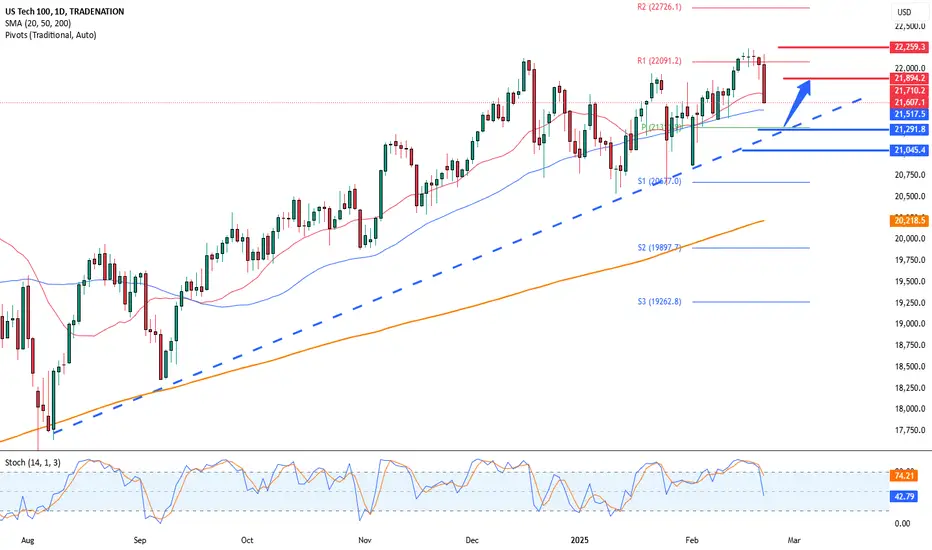
NSDQ100 drops on weaker than expected economic dataThe NSDQ (USTec) index pair price action sentiment appears bullish, supported by the longer-term prevailing uptrend. The recent intraday price action appears to be a corrective pullback after reaching the all-time high.
The key trading level is at 21290 level, the consolidation price range and also the previous resistance is now a newly formed support zone. A corrective pullback from the current levels and a bullish bounce back from the 21290 level could target the upside resistance at 21890 followed by the 22090 and 22260 levels over the longer timeframe.
Alternatively, a confirmed loss of the 21290 support and a daily close below that level would negate the bullish outlook opening the way for a further retracement and a retest of the 21045 support level followed by 21680.
This communication is for informational purposes only and should not be viewed as any form of recommendation as to a particular course of action or as investment advice. It is not intended as an offer or solicitation for the purchase or sale of any financial instrument or as an official confirmation of any transaction. Opinions, estimates and assumptions expressed herein are made as of the date of this communication and are subject to change without notice. This communication has been prepared based upon information, including market prices, data and other information, believed to be reliable; however, Trade Nation does not warrant its completeness or accuracy. All market prices and market data contained in or attached to this communication are indicative and subject to change without notice.
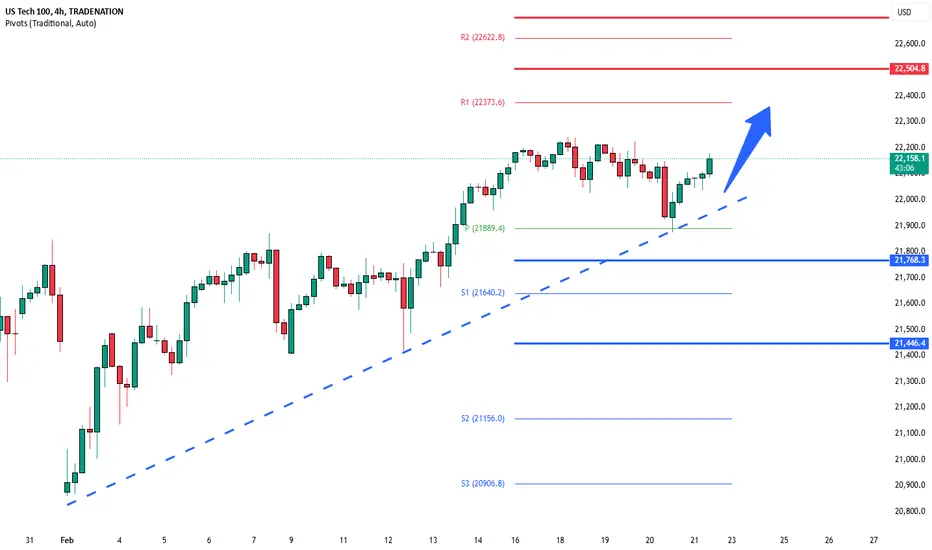
NSDQ100 INTRADAY Bullish Flag breakout The NSDQ (USTec) index pair price action sentiment appears bullish, supported by the longer-term prevailing uptrend. The recent intraday price action appears to be a sideways consolidation after reaching the intraday all time high.
The key trading level is at the 21890 level, the consolidation price range and also the previous resistance is now a newly formed support zone. A corrective pullback from the current levels and a bullish bounce back from the 21890 level could target the upside resistance at 22373 followed by the 22500 and 22620 levels over the longer timeframe.
Alternatively, a confirmed loss of the 21890 support and a daily close below that level would negate the bullish outlook opening the way for a further retracement and a retest of 21770 support level followed by 21640.
This communication is for informational purposes only and should not be viewed as any form of recommendation as to a particular course of action or as investment advice. It is not intended as an offer or solicitation for the purchase or sale of any financial instrument or as an official confirmation of any transaction. Opinions, estimates and assumptions expressed herein are made as of the date of this communication and are subject to change without notice. This communication has been prepared based upon information, including market prices, data and other information, believed to be reliable; however, Trade Nation does not warrant its completeness or accuracy. All market prices and market data contained in or attached to this communication are indicative and subject to change without notice.
NSDQ - sideways consolidation after reaching intraday ATHThe NSDQ (USTec) index pair price action sentiment appears bullish, supported by the longer-term prevailing uptrend. The recent intraday price action appears to be a sideways consolidation after reaching the intraday all time high.
The key trading level is at 21890 level, the consolidation price range and also the previous resistance now newly formed support zone. A corrective pullback from the current levels and a bullish bounce back from the 21890 level could target the upside resistance at 22373 followed by the 22500 and 22620 levels over the longer timeframe.
Alternatively, a confirmed loss of the 21890 support and a daily close below that level would negate the bullish outlook opening the way for a further retracement and a retest of 21770 support level followed by 21640.
This communication is for informational purposes only and should not be viewed as any form of recommendation as to a particular course of action or as investment advice. It is not intended as an offer or solicitation for the purchase or sale of any financial instrument or as an official confirmation of any transaction. Opinions, estimates and assumptions expressed herein are made as of the date of this communication and are subject to change without notice. This communication has been prepared based upon information, including market prices, data and other information, believed to be reliable; however, Trade Nation does not warrant its completeness or accuracy. All market prices and market data contained in or attached to this communication are indicative and subject to change without notice.

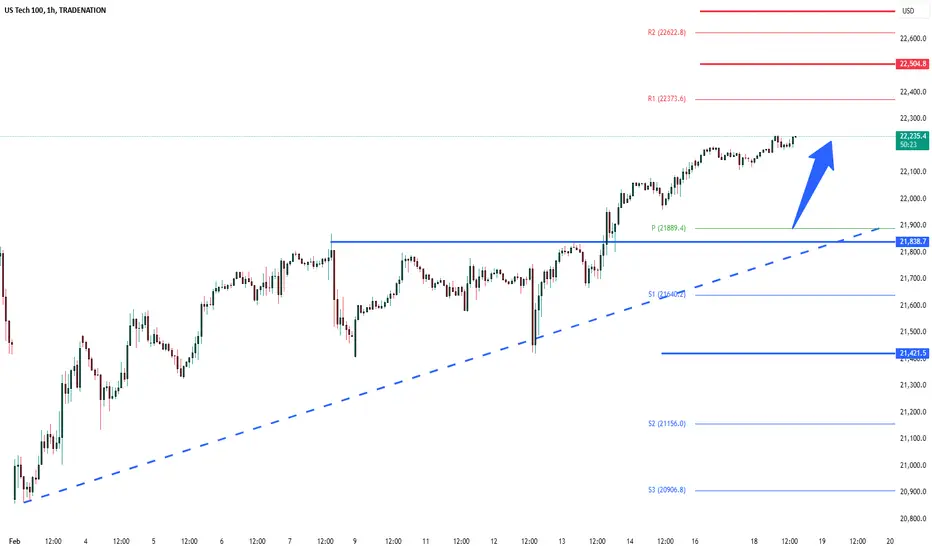
NSDQ Uptrend supported at 21840The NSDQ100 (USTec) price action sentiment appears bullish, supported by the longer-term prevailing uptrend. The recent intraday price action appears to be a bullish breakout.
The key trading level is at 21840 level, previous resistance now newly formed support. A corrective pullback from the current levels and a bullish bounce back from the 21840 level could target the upside resistance at 22250 followed by the 22500 and 22620 levels over the longer timeframe.
Alternatively, a confirmed loss of the 21840 support and a daily close below that level would negate the bullish outlook opening the way for a further retracement and a retest of 21640 support level followed by 21420.
This communication is for informational purposes only and should not be viewed as any form of recommendation as to a particular course of action or as investment advice. It is not intended as an offer or solicitation for the purchase or sale of any financial instrument or as an official confirmation of any transaction. Opinions, estimates and assumptions expressed herein are made as of the date of this communication and are subject to change without notice. This communication has been prepared based upon information, including market prices, data and other information, believed to be reliable; however, Trade Nation does not warrant its completeness or accuracy. All market prices and market data contained in or attached to this communication are indicative and subject to change without notice.