MANYAVAR: Analyzing Potential Bullish Reversal, Festive DemandNSE:MANYAVAR : Analyzing Potential Bullish Reversal Amidst Festive Demand Surge
Current Price: ₹1337
Date: 16 October 2024
In the dynamic landscape of the retail market, MANYAVAR is currently navigating a pivotal phase, with signs indicating a possible bullish turnaround. As the festive season unfolds, characterized by heightened consumer activity due to significant celebrations like Karwa Chauth and Diwali, this analysis provides a comprehensive outlook on key support and resistance levels that could influence trading strategies.
Key Technical Levels:
Support Levels:
₹1305: A significant psychological support level. A decisive move below this could trigger bearish sentiment and signal increased selling pressure.
₹1316: This level serves as a secondary support. Maintaining prices above this threshold is vital for sustaining bullish momentum.
₹1336: Currently serving as immediate support, this level is crucial for determining short-term price action and trader sentiment.
Resistance Levels:
₹1346: The first major resistance level. A breakout above this price point could catalyze bullish sentiment and attract momentum traders.
₹1357: An additional resistance zone. Close monitoring of price reactions here will be essential to confirm a potential uptrend.
₹1376: Further up the chart, this level is critical for the validation of sustained bullish momentum.
₹1427, ₹1466, ₹1496: Long-term resistance levels that, if breached, could signify a strong bullish phase and draw in significant institutional interest.
Breakout Zone:
The pivotal breakout zone lies between ₹1346 and ₹1357. A robust close above ₹1357 may set off a chain reaction of buying activity, propelling the stock towards higher resistance levels and potentially unlocking significant upside.
Market Sentiment and Context:
The approach of the festive season presents a unique opportunity for retail stocks, particularly in the ethnic wear segment. With consumer spending historically surging during this period, demand for jewelry and traditional attire is expected to increase. This favorable market environment positions MANYAVAR well to capitalize on the seasonal uptick in consumer behavior.
Strategic Outlook:
Given the current price action and the backdrop of impending festive demand, traders should closely observe key support and resistance levels to refine entry and exit strategies. A careful assessment of price movements around these thresholds will be critical for identifying potential bullish opportunities.
Conclusion:
MANYAVAR stands at a crucial crossroads that may lead to a bullish reversal, particularly as market conditions favor increased retail activity during the festive season. By monitoring key technical levels and market sentiment, traders can position themselves effectively to leverage potential price movements.
Disclaimer: I am not a SEBI Registered Research Analyst (RA). This analysis is for educational purposes only and should not be considered as investment advice. Please conduct your own research or consult a financial advisor before making any trading decisions.
Nseindia

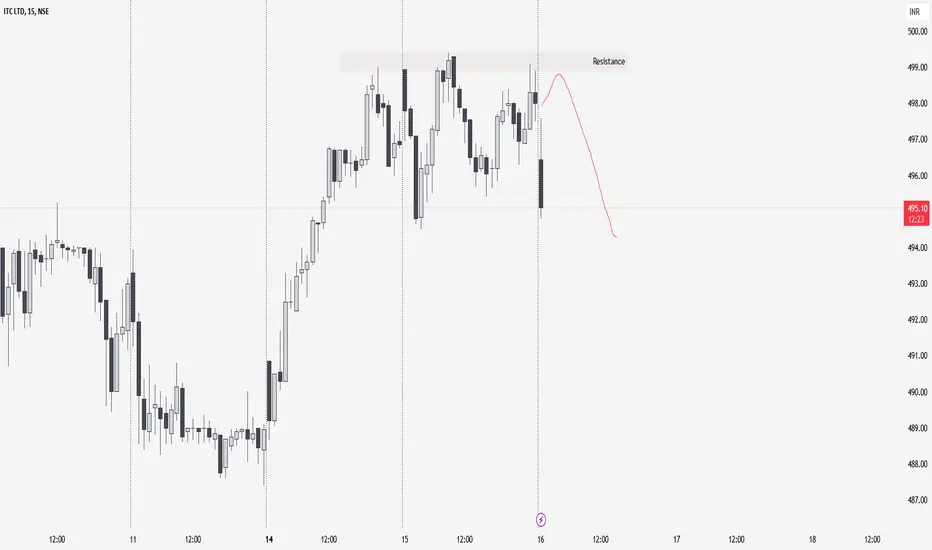
ITC | Intraday | NSE15m Time Frame : Price reached to strong resistance zone
failed multiple attempted to break the resistance zone
Today(16th Oct) likely to move bearish trend
take short position followed by buy-side LQ sweep and bearish candle confirmation
Muthoot Finance Long Trade on 15m Time Frame: Trade in ProgressA long entry was initiated at 1927.05 on the 9th of October at 10:15 am. The price is nearing Target 1 (1963.50) and remains on track for further movement towards the upper targets. We have now set a trailing stop at 1928.50 to lock in gains and manage risk.
Target Points:
TP 1: 1963.50 (close to being hit)
TP 2: 2022.50
TP 3: 2081.50
TP 4: 2117.95
Trailing Stop: 1928.50
Stop Loss (SL): 1897.55
We'll keep a close eye on this position as it progresses towards the remaining targets.

CGPower : Strong Bullish Momentum: Key Support & Resistance Zone NSE:CGPOWER in Strong Bullish Momentum: Key Support & Resistance Zones
NSE:CGPOWER continues to demonstrate solid upward momentum across multiple timeframes, with positive trends seen on the daily, weekly, and even shorter 75-minute charts. Here's an advanced look at key levels and insights:
Key Indicators to Watch:
Weekly 50 EMA: ₹605 – A strong long-term support level. The price remains well above this, indicating a sustained bullish trend.
Daily 50 EMA: ₹736 – Medium-term support. A key level to watch for any pullbacks or corrections.
Weekly 10 EMA: ₹745 – Immediate weekly support, offering a clear level for trend continuation.
Daily 10 EMA: ₹792 – The near-term support on the daily chart; holding this level is crucial for continued upward momentum.
75-min Chart:
50 EMA: ₹786 – This EMA offers intraday support, crucial for short-term traders.
21 EMA: ₹816 – Further intraday support, maintaining strength at this level keeps the bullish sentiment intact.
10 EMA: ₹840 – Immediate short-term support in intraday action.
Key Resistance Levels:
52-Week High : ₹874.70 – A breakout above this significant level could lead to a fresh rally with further upside potential.
₹846 – Short-term resistance that aligns with 75-min 10 EMA, a key test for continued bullish momentum.
₹875-₹900 – If the stock breaks its 52-week high, we may see this range as the next target zone.
Support Levels to Watch:
₹756 – Short-term support level; a strong dip-buying opportunity if prices pull back to this region.
₹786 – A key support level on the 75-minute 50 EMA; holding this strengthens the upward move.
₹816 – The 75-minute 21 EMA provides a solid intraday support level.
₹846 – A critical near-term support zone that should hold for the continuation of bullish movement.
Outlook:
NSE:CGPOWER is showing a healthy bullish momentum, with consistent support levels across the daily and weekly charts. Holding above ₹756 and breaking past ₹874.70 could fuel further bullish activity. Watch for pullbacks near support levels for potential buying opportunities. As long as the price holds above its key EMAs, especially the daily and 75-min EMAs, the trend remains strongly positive.
Conclusion:
With CGPower's upward momentum intact and strong support from its EMAs, it remains in a bullish trajectory. Monitoring price action near ₹756, ₹786, ₹816, and ₹874 is essential for confirming continued strength.
Disclaimer: I am not a SEBI Registered Research Analyst (RA). This analysis is for educational purposes only and should not be considered as investment advice. Please conduct your own research or consult a financial advisor before making any trading decisions.

GAIL Showing Strength Above 10 EMA: Key Support & Resistance NSE:GAIL Showing Strength Above 10 EMA: Key Support & Resistance Levels (Daily & Weekly Analysis)
NSE:GAIL is currently trading at ₹229.40, maintaining strength above the 10 EMA on the daily chart, indicating positive short-term momentum. A similar setup is reflected on the weekly chart, where the stock is trading well above its 50 EMA, reinforcing a bullish bias.
Key Resistance Levels:
₹236 – Immediate resistance zone, significant on both daily and weekly timeframes. A breakout above this level could trigger further bullish momentum.
₹246 – The 52-week high, acting as a strong resistance on the weekly chart. A decisive move above this would mark a fresh bullish breakout, potentially leading to accelerated gains.
Key Support Levels:
₹226 – Crucial short-term support on the daily chart, aligning closely with the 50 EMA (₹226.29). Holding this level is essential for sustaining the positive trend.
₹216 – Next significant support zone on both timeframes. A break below this could signal weakening momentum.
₹196 – Major support level corresponding to the weekly 50 EMA. This level acts as a long-term safety net, and a breach below would indicate a shift in the broader trend.
Outlook:
The stock’s alignment above key EMAs on both the daily and weekly charts suggests that GAIL is in a strong uptrend. A break above ₹236 could lead to a test of the 52-week high at ₹246, where a breakout would be a strong bullish signal. Traders should monitor price action around these levels closely.
If GAIL faces a pullback, holding support at ₹226 will be crucial to maintain its short-term momentum. A break below ₹216 could indicate potential weakness, with ₹196 (weekly 50 EMA) serving as a critical long-term support.
Disclaimer: I am not a SEBI Registered Research Analyst (RA). This analysis is for educational purposes only and should not be considered as investment advice. Please conduct your own research or consult a financial advisor before making any trading decisions.

HDFC Bank: Navigating Bearish Momentum Amid Key LevelsNSE:HDFCBANK : Navigating Bearish Momentum Amid Key Levels
NSE:HDFCBANK : is currently facing bearish momentum, encountering significant downward pressure as it tests key support levels. As traders, it’s crucial to analyze the following resistance and support zones to gauge potential market movements:
Resistance Levels:
1726 / 1716: These levels are pivotal resistance points. A failure to breach these zones may trigger sell-offs, reinforcing bearish sentiment in the stock.
Support Levels:
1676 / 1636 / 1596: The stock is attempting to establish support near 1636. A break below this critical level could accelerate downward momentum, signaling further weakness and inviting additional selling pressure.
Upcoming Catalysts:
HDFC Bank will announce its Q2 earnings report on October 18. This upcoming event is likely to introduce volatility, potentially influencing price action significantly.
Market Outlook:
Despite efforts to maintain support at 1636, HDFC Bank's overall trend appears weak. Traders should closely monitor price action around these key levels to anticipate potential shifts in momentum.
Disclaimer: I am not a SEBI Registered Research Analyst (RA). This analysis is for educational purposes only and should not be considered as investment advice. Please conduct your own research or consult a financial advisor before making any trading decisions.
If you found this analysis helpful, please consider sharing, following, or boosting this idea! Your support is greatly appreciated!

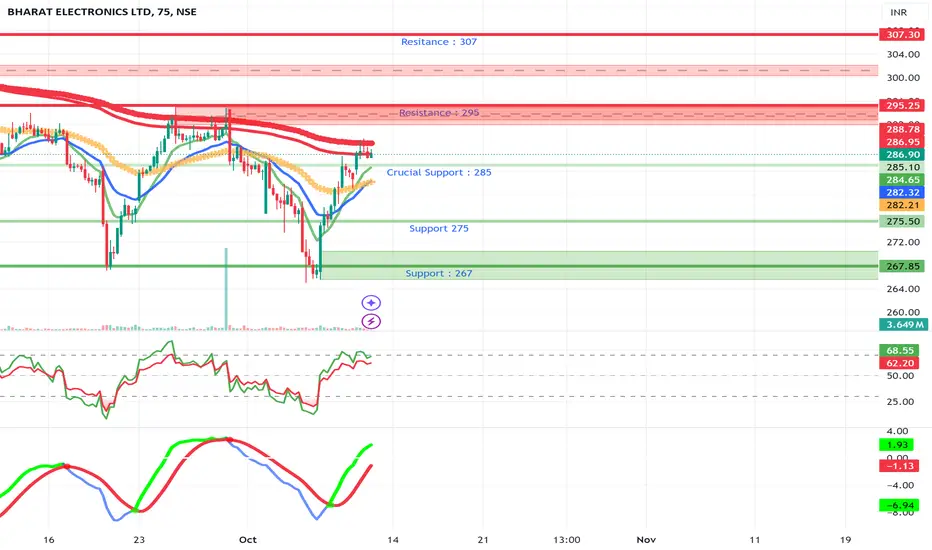
BEL : Key Support & Resistance Levels at Current Price of 286.90NSE:BEL : Key Support & Resistance Levels at Current Price of 286.90
As NSE:BEL trades around 286.90, it shows signs of weakness, and it's essential to focus on the following support and resistance levels for potential trading strategies:
Resistance Levels:
Immediate Resistance: 295 – This level may act as a barrier for upward movement.
Psychological Resistance: 300 – A significant psychological level that traders watch; a breakout above this could attract more buying interest.
Key Resistance: 307 – A crucial level for confirming bullish momentum; a strong close above here may indicate a sustained upward trend.
Support Levels:
Crucial Support: 285 – This key level may provide buying interest. A break below this could lead to further downside.
Stronger Support: 275 – Acts as backup support, offering a safety net for traders.
Lower Support: 267 – If tested, it would indicate significant selling pressure, warranting close attention.
Outlook: BEL appears to be weak at the moment. Holding below the 285 support could lead to further declines, potentially testing 275 and 267. A bounce back above 285 may provide a chance for a retest of 295, but caution is advised given the current weakness.
Disclaimer: I am not a SEBI Registered Research Analyst (RA). This analysis is for educational purposes only and should not be considered as investment advice. Please conduct your own research or consult a financial advisor before making any trading decisions.
If you found this analysis helpful, please consider sharing, following, or boosting this idea! Your support is greatly appreciated!
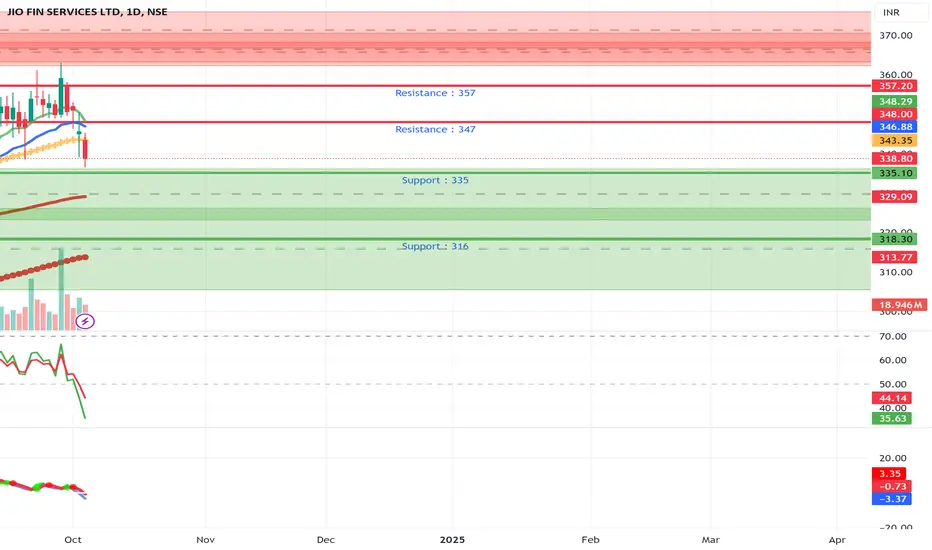
Jio Financial Services (JFS): Navigating Key Levels with PositivJio Financial Services (JFS): Navigating Key Levels with Positive Momentum
NSE:JIOFIN (JFS) is currently at a critical juncture, testing key support and resistance zones amidst positive market sentiment.
Resistance Zones: 346 / 356 – The stock may face selling pressure near these resistance levels, but a breakout could signal renewed bullish momentum, especially considering the favorable news surrounding the company.
Support Zones: 335 / 316 – These levels are crucial for short-term support. If breached, it could lead to downside pressure, but strong buying interest at these levels may act as a cushion, preventing further decline.
Positive News Catalyst:
JFS recently received SEBI's in-principle approval to establish a mutual fund business in collaboration with BlackRock. This strategic 50:50 joint venture, dubbed Jio BlackRock, combines BlackRock's global expertise in investment and risk management with JFS’s strong local presence and digital infrastructure. This marks a significant re-entry for BlackRock into the Indian market, positioning JFS for expanded offerings in the investment space.
With this venture, JFS is poised to bring innovative financial products to the Indian market, which could attract investor interest and drive future growth. Positive sentiment from this news may create bullish momentum, and a break above the 356 resistance level could trigger further upside.
Key Takeaway: The stock is likely to be influenced by both technical and fundamental factors in the near term. Traders should watch for price action near the 346 and 356 levels for potential breakouts, while monitoring support at 335 and 316 for signs of strength.
Disclaimer: I am not a SEBI-registered Research Analyst. This analysis is for educational purposes only. Please conduct your own research or consult a financial advisor before making any trading decisions.
SWING IDEA - KPR MILL LTDToday, we delve into KPR Mill Ltd , where a confluence of technical factors suggests a potential swing buying opportunity.
Reasons are listed below :
KPR Mill Ltd recently revisited the critical support at 760 levels, a zone that has historically proven significant. The noteworthy aspect is the successful breach and subsequent retest, signaling potential strength.
Weekly charts showcase a bullish dragonfly doji, signaling a potential trend reversal, while daily charts reveal a bullish hammer pattern, enhancing positive sentiment.
The stock bounced precisely off the 200-day Exponential Moving Average (EMA) on the daily chart, highlighting this level as a robust support.
Continuous formation of higher highs affirms the sustained uptrend in KPR Mill Ltd, reflecting positive market sentiment.
With the stock trading above both the 50-day and 200-day EMAs, there is added strength to the current positive trend.
Target - 861 // 928 // 1050
StopLoss - weekly close below 716
DISCLAIMER -
Decisions to buy, sell, hold or trade in securities, commodities and other investments involve risk and are best made based on the advice of qualified financial professionals. Any trading in securities or other investments involves a risk of substantial losses. The practice of "Day Trading" involves particularly high risks and can cause you to lose substantial sums of money. Before undertaking any trading program, you should consult a qualified financial professional. Please consider carefully whether such trading is suitable for you in light of your financial condition and ability to bear financial risks. Under no circumstances shall we be liable for any loss or damage you or anyone else incurs as a result of any trading or investment activity that you or anyone else engages in based on any information or material you receive through TradingView or our services.
@visionary.growth.insights

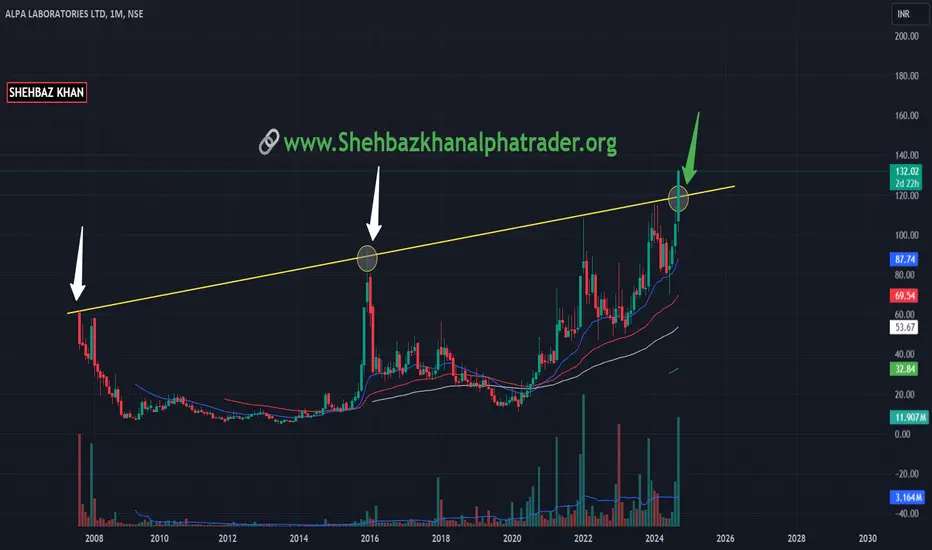
Alpa Laboratories investment ideaObservation
Stock Breakout it resistance with huge trading Volume. Stock trade above all the EMA RSI above 60 on all TF
Technical Analysis & indicators 🔍
Rounding Bottom
Monthly Chart
For more detail you can visit on given website
POLE FLAG WITH ROUNDING BOTTOM IN DALMIA BHARATWe can See a trend change in Dalbharat...
Phase 1 Downside - Done
Phase 2 Sideways Consolidation - on going
Phase 3 Trend continuation or Reversal - NEXT
For Short term we can see Pole flag formation in Dalbharat after trendline break
For long term if the pole and flag gets activated we can see Cup and Handle next.
Dalbharat has been trading in range and consolidating...
Dotted Trendline should act as Upside support
Idea Invalid if 1840 broken on DCB

POTENTIAL INVESTMENT TARDE FOR VODAFONE IDEA
Here we look at the Quarterly chart since 2008, We see price was rallying up violating Resistances and respecting the Support areas, until it starts doing the opposite.
Now recently Price has violated a Supply area which indicates that the Buyers have just won over the sellers and now Price has given a Pullback in a 6 Months Demand.
Now we have a 6 Months Demand; So understanding the timeframe role into this Trade as the Demand in which we buy this a 6 months Demand hence we will have to consider a minimum of 1 to 2 years considering at least 2 to 4 candles of 6 months each to achieve the Target.
Here we have the following to consider before entering the Trade
Trade Type : Investment Trade
Entry : 10.10
SL : 5.70
TGT : 39.74
Risk : Rs. 4.4
Reward : Rs. 29.64
Ratio for Reward to Risk : 6.7/1

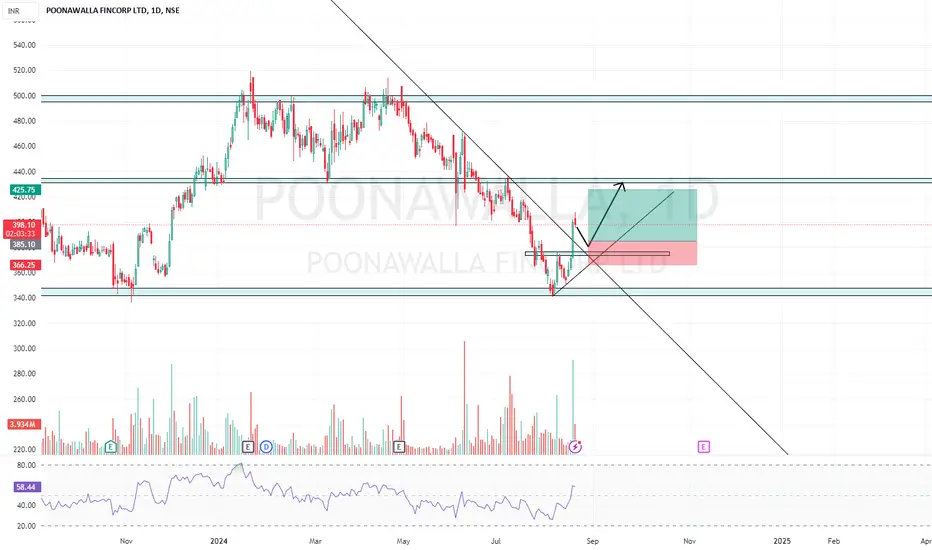
POONAWALLA TRENDLINE BREAKOUTDynamic Trendline Breakout with Volumes in Daily TF.
Took Support from Previous Support Zone.
Buy on Dip till 385.. Need some Retracement for Further Upside.
RR Favorable
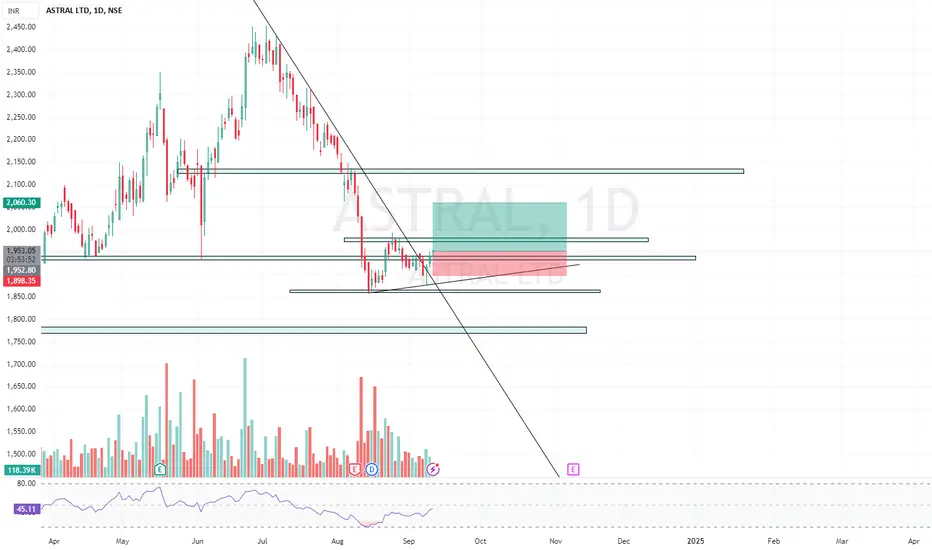
TREND REVERSAL IN ASTRALLong Term Trendline Broken
We can expect W pattern above 1980
RR Favorable at CMP
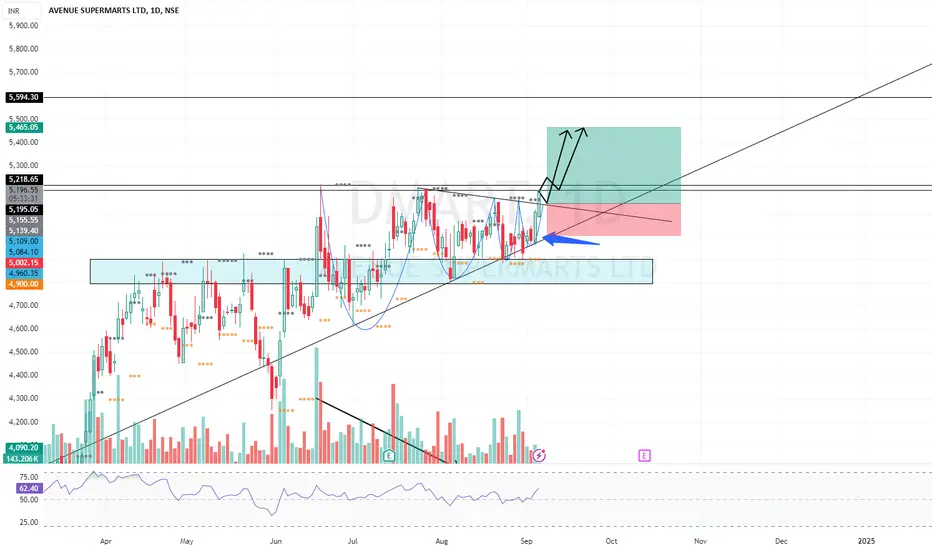
DMART RANGE BREAKOUT VOLATILITY COMPRESSIONDmart Given BO on Daily TF
Volumes Increasing
Its VSP type pattern.. Volatility Compression BO
Expecting Good Target
Todays Closing Deciding factor.
Idea Invalid If dynamic Support Broken on Downside
LTIM LONG BUY TRADE IDEALTIM long trade idea
buy signal/call
1. stock have completed a cup & handle kind of pattern
2. consolidation of considerable time period happend at this breakout level
3. us fed cut will benefit this stock
4. strong fundamentals
5. big investors with healthy holdings
buy @ 6450 SL @ 6200-6300 target 1 - @7000 target 2nd @7500 target 3 @ 8000 target 4 @ 8500
time period - around coming 3-9 months
NSE:LTIM

IDEAFORGE TECHNOLOGY LONG TERM VIEWIDEAFORGE TECHNOLOGY LTD is forming a Double Bottom Pattern and a channel pattern within the double bottom formation as well.
Entry is given at 712
Stop Loss is given at 556
Targets are as follows:
Target 1-886
Target 2-1056
Target 3-1260
Target 4-1345
(These targets will be achieved within 2 years from the date of entry)
NOTE:- This view is purely based on Technical Analysis and is for educational purposes only.
Please consult your Financial Advisor Before taking any trade.

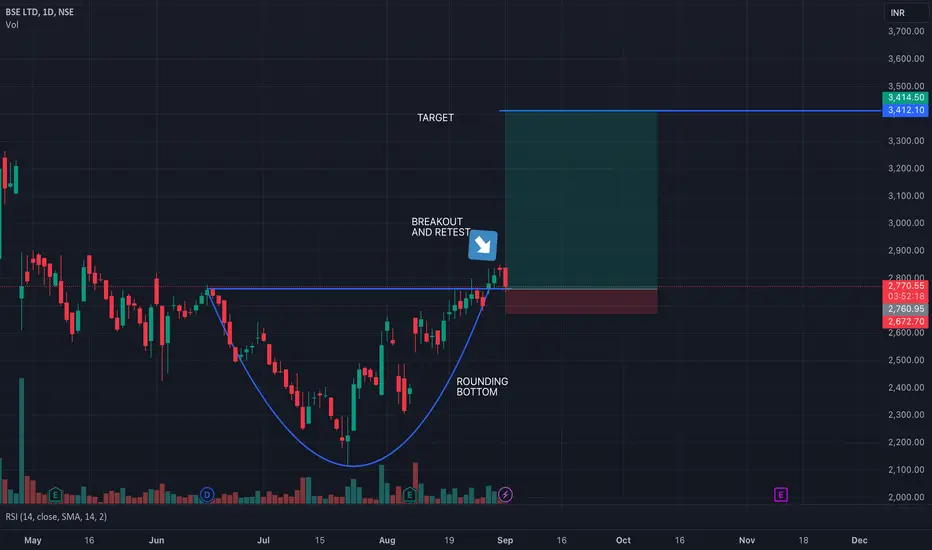
BSE LONGBSE share has made a rounding bottom, did a breakout and retest and now should follow to the target.
Bharat Dynamics BDL Short Setup on 1D Daily TF on RisologialBharat Dynamics BDL Short Setup on 1D Daily TF on Risologial
After 125% upside rally, BDL has given signs of a possible SHORT trade.
The BDL price is crossing under the Risological trend line, and if we see a red candle today, it is a sign of a good short trade.
Once the trade is confirmed, the Risological swing trading indicator will set the Entry, stoploss and profit targets for this trade.
I will update on this trade post 3:30 closing.
Take care.
Namaste!

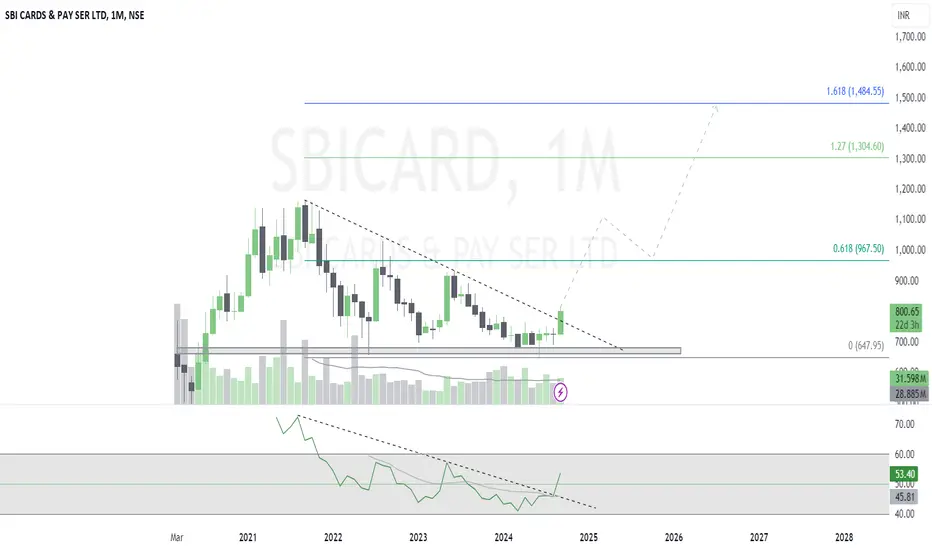
SBICARD CMP 800.65SBI CARD is You turn after touch its IPO price.
Chart looks good as trendline is broken after few months of consolidation.
RSI Trendline also suggest upside move.
Targeting for Fib 1.61% in Long Run.
SWING IDEA - SBI CARDS AND PAYMENTSThis setup presents an attractive opportunity for swing traders to capitalize on the potential uptrend in SBI Cards .
Reasons are listed below :
Strong Support at 670-700 Levels : SBI Cards has established a robust support zone in the range of 670-700 levels, indicating strong buying interest and potential reversal points.
Bullish Marubozu Candle : A bullish Marubozu candlestick pattern has formed in both the weekly and daily timeframes, suggesting strong buying momentum and potential upward movement.
Engulfing Pattern : The bullish engulfing pattern on the weekly chart, engulfing four previous candles, reinforces the bullish sentiment and indicates a potential reversal of the downtrend.
Double Bottom Pattern : A double bottom pattern has emerged on the daily timeframe, indicating a potential trend reversal and bullish continuation.
Target - 790 // 855 // 935
Stoploss - weekly close below 670
DISCLAIMER -
Decisions to buy, sell, hold or trade in securities, commodities and other investments involve risk and are best made based on the advice of qualified financial professionals. Any trading in securities or other investments involves a risk of substantial losses. The practice of "Day Trading" involves particularly high risks and can cause you to lose substantial sums of money. Before undertaking any trading program, you should consult a qualified financial professional. Please consider carefully whether such trading is suitable for you in light of your financial condition and ability to bear financial risks. Under no circumstances shall we be liable for any loss or damage you or anyone else incurs as a result of any trading or investment activity that you or anyone else engages in based on any information or material you receive through TradingView or our services.
@visionary.growth.insights

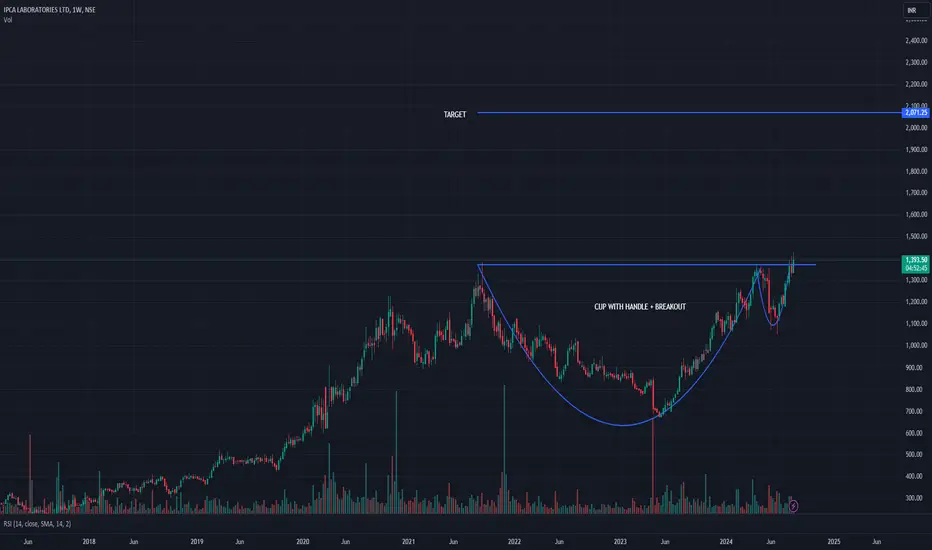
IPCALAB Cup with handle pattern breakoutIPCA LABS a leading pharma company with good fundamentals have been moving to make a cup-with-handle pattern. As shown in the idea the pattern has given a breakout and might move to the target of the pattern. Good stock to learn about cup-with-handle pattern.
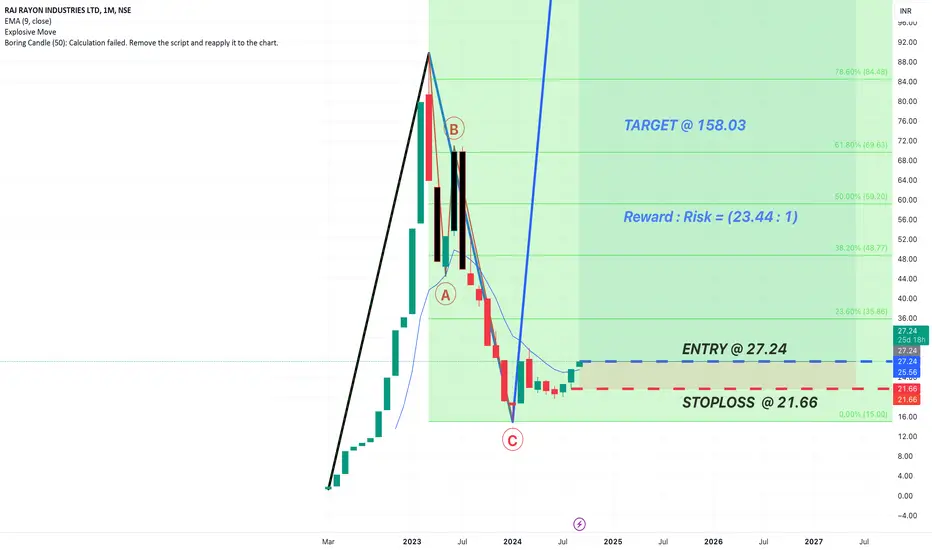
Raj Rayon : {"Potential for Best investment for 2024";}
We are at the Biggest Picture available as per the data;
Price has formed a Wave 1 which is an Impulse Wave In the Upward direction;
Wave 2 is a downward 3-Wave-Simple-Correction Structure, retracing Wave 1 by less than a 100% which suffices the Laws of Wave as per the Elliott Wave Theory and now.
======================================================================
Let's talk about the most interesting part The Most Awaited Wave 3 is expected to come out, showing the move which is the reason why we trade,
According to the Elliot Wave Theory the Projection of Wave 3 is at least 161.80% of the Wave 1.
Let's see on the charts the Extension Levels as per the Best Leading Indicactor Fibonacci Extension;
Yo !!!!
Now Last Month that's in August 24, Price has closed above the EMA and hence I see a Buying Momentum in the Monthly chart,
Looking at the Promotor Holding of this company which is more than 90% only confirms my belief in the future growth of the company.
So we have an Overall Target Projection of Rs. 158.03 {Derived as per Fibonacci Extension}
Now Let's look at the other side the {downside/ stop loss/ risk against the reward}