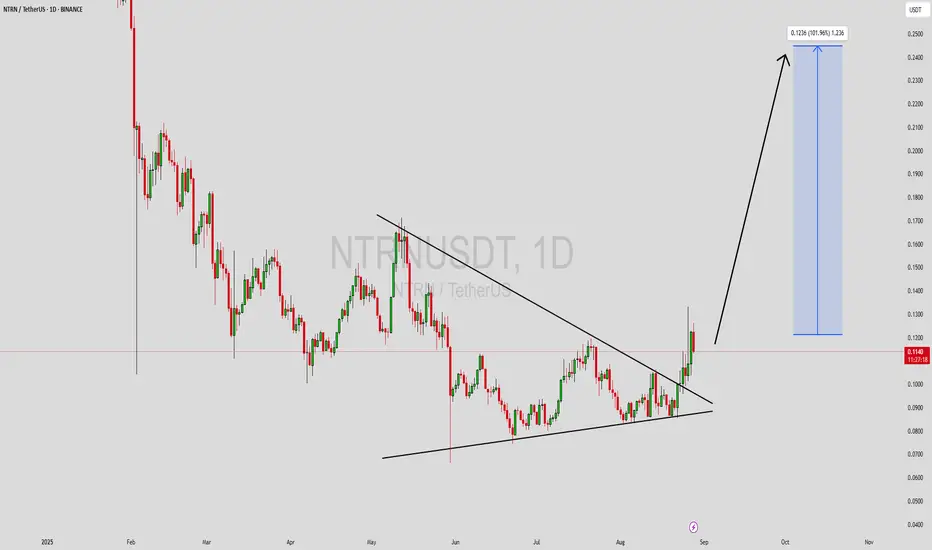
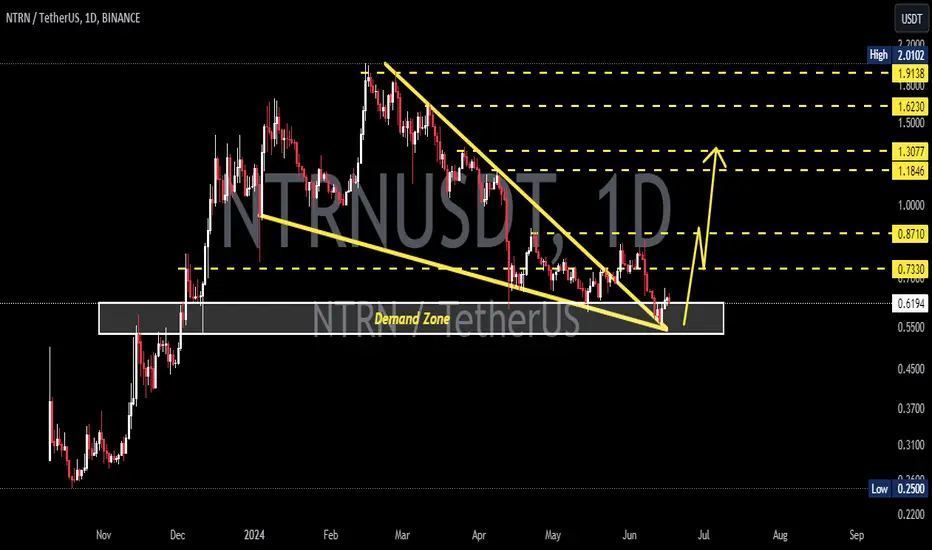
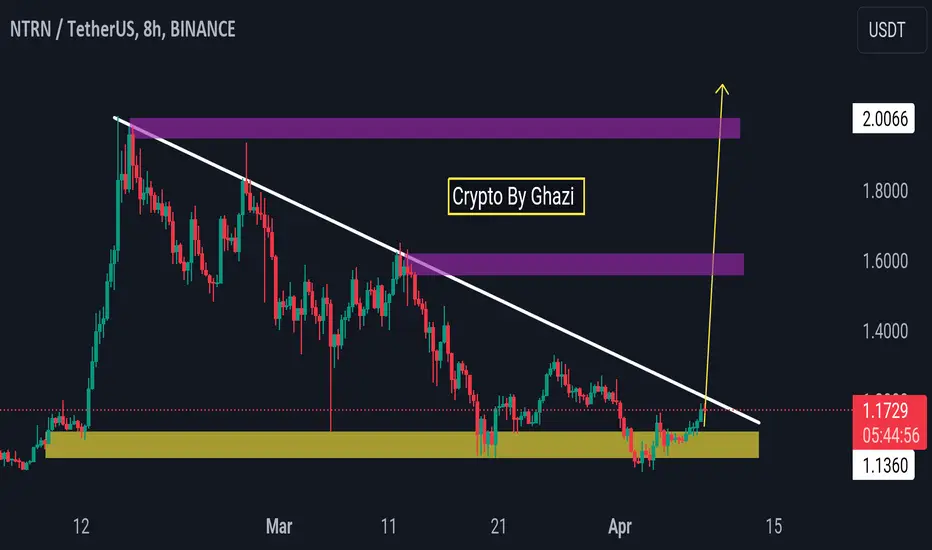
NTRNUSDT Forming Symmetrical TriangleNTRNUSDT is displaying a strong technical setup, recently breaking out of a consolidation phase that had been forming for weeks. The chart structure indicates a breakout from a symmetrical triangle pattern, which often signals the beginning of a new bullish trend. With good trading volume supporting the move, momentum is favoring buyers, and the market sentiment appears to be shifting toward accumulation.
Based on the current structure, this breakout has the potential to push NTRNUSDT toward significant upside targets. The projected move suggests possible gains in the range of 90% to 100%+, making this an attractive setup for traders looking for high-reward opportunities. The clear breakout level and continuation signal add further strength to the bullish case, particularly if volume continues to support the move.
Investors are beginning to take a stronger interest in this project, adding more confidence to the long-term outlook. As adoption grows and the technical picture aligns with investor demand, NTRNUSDT could continue to build momentum and challenge higher resistance levels. Keeping an eye on retests of the breakout zone may provide solid entry opportunities for those waiting on confirmation.
✅ Show your support by hitting the like button and
✅ Leaving a comment below! (What is You opinion about this Coin)
Your feedback and engagement keep me inspired to share more insightful market analysis with you!
Ntrn
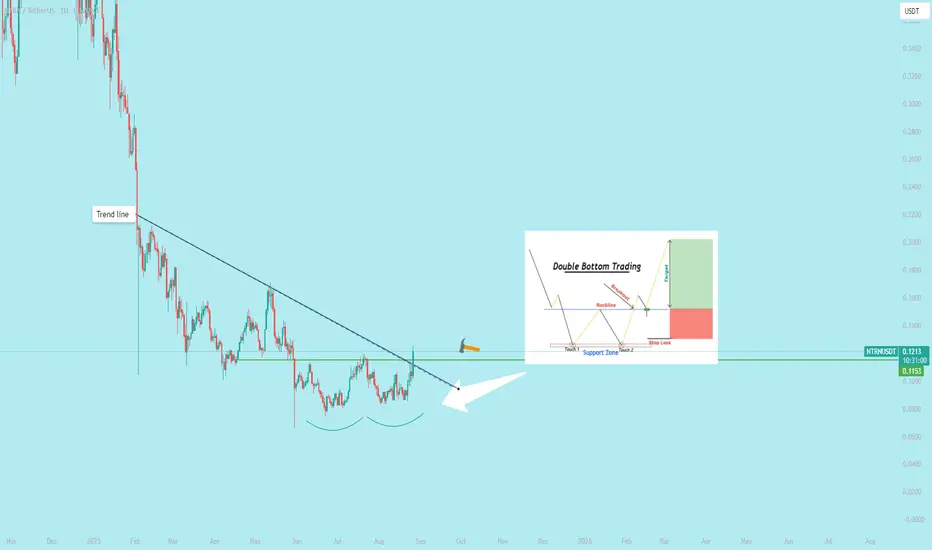
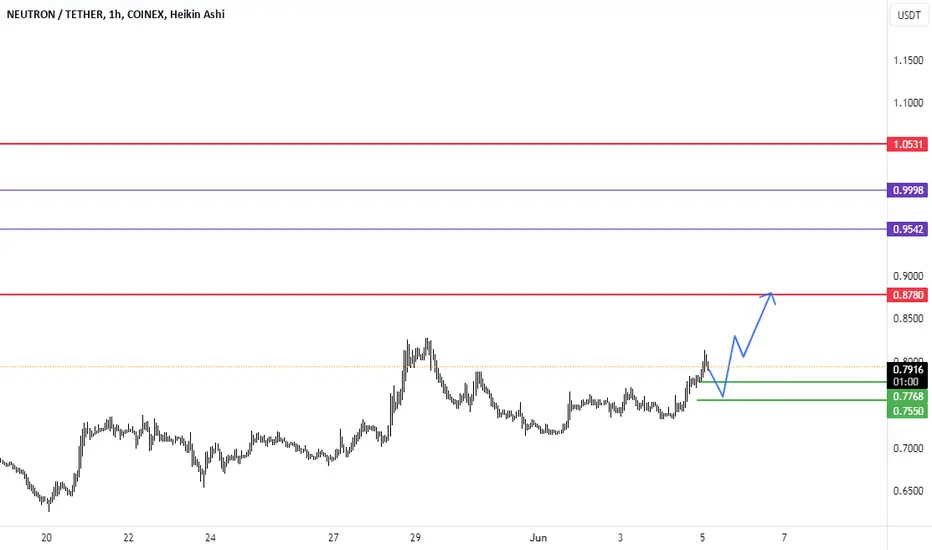
$NTRN shows a Double bottom pattern.Steps to Trade the Double Bottom PatternIdentify the Pattern
Look for a downtrend in the price chart.
Spot two lows (bottoms) at approximately the same price level, forming a support zone. These lows should be separated by a peak (the middle of the "W").
The pattern is more reliable on higher timeframes (e.g., daily or 4-hour charts).
Confirm the Pattern:Ensure the two bottoms are well-defined and not too far apart in time.
Check for increased volume on the second bottom or during the breakout, as it supports the pattern's validity.
Use additional indicators like RSI or MACD to confirm bullish momentum (e.g., RSI showing oversold conditions or a bullish divergence).
Define Key Levels:Support: The price level of the two bottoms.
Neckline: The horizontal line connecting the high point between the two bottoms (the peak of the "W").
Target: Measure the vertical distance from the bottoms to the neckline and project it upward from the breakout point for a potential price target.
Entry Point:Enter a long (buy) position when the price breaks above the neckline with strong momentum (e.g., a strong bullish candle or increased volume).
Alternatively, wait for a retest of the neckline (now acting as support) after the breakout to confirm the move.
Set Stop-Loss:Place a stop-loss just below the second bottom to protect against false breakouts.
A tighter stop-loss can be placed below the neckline if you're entering on a retest, but ensure it accounts for market volatility.
Set Profit Target:Use the height of the pattern (distance from bottoms to neckline) to estimate the target. For example, if the distance is $10, the target is $10 above the neckline.
Alternatively, trail your stop-loss or use resistance levels to lock in profits.
Manage the Trade:Monitor volume and momentum during the breakout. Weak volume may indicate a false breakout.
Adjust your stop-loss to breakeven once the price moves significantly in your favor.
Be cautious of news or events that could invalidate the pattern.
ExampleStock/Forex/Crypto: Price drops to $50 (first bottom), rises to $55 (neckline), drops back to $50 (second bottom), then breaks above $55.
Entry: Buy at $55.50 (breakout confirmation).
Stop-Loss: $49.50 (below the second bottom).
Target: $60 (neckline $55 + pattern height $5).
Risk-Reward Ratio: Calculate to ensure at least 1:2 (risk $1 to gain $2).
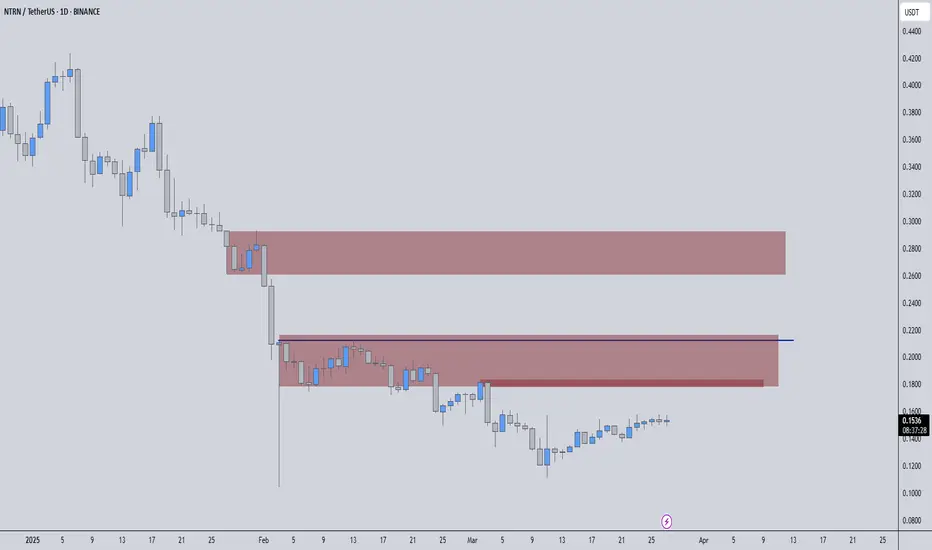
NTRNUSDT – Watch Out! Red Boxes Are Strong Resistance ZonesThe red boxes on NTRUSDT mark powerful resistance areas where significant selling pressure is likely to emerge. These levels are not to be taken lightly, as they have historically been strong barriers for price movement.
🔴 Key Takeaways:
Strong Resistance: The red boxes act as tough resistance zones where sellers are likely to step in.
Exercise Caution: Before making any decisions, ensure you wait for lower timeframe (LTF) breakouts and confirmation using CDV and volume analysis.
Don't Rush: Be patient and allow the market to show you the proper direction. Only engage when the signals are crystal clear.
💡 Plan Your Trade:
Watch the market carefully, be disciplined, and only enter when confirmations align. If you don’t get the right setup, don’t force the trade—let the market come to you.
📌I keep my charts clean and simple because I believe clarity leads to better decisions.
📌My approach is built on years of experience and a solid track record. I don’t claim to know it all but I’m confident in my ability to spot high-probability setups.
📌If you would like to learn how to use the heatmap, cumulative volume delta and volume footprint techniques that I use below to determine very accurate demand regions, you can send me a private message. I help anyone who wants it completely free of charge.
🔑I have a long list of my proven technique below, (I created this list in a couple of months here, most of the traders doesn't have these much runners in their lifes) :
🎯 ZENUSDT.P: Patience & Profitability | %230 Reaction from the Sniper Entry
🐶 DOGEUSDT.P: Next Move
🎨 RENDERUSDT.P: Opportunity of the Month
💎 ETHUSDT.P: Where to Retrace
🟢 BNBUSDT.P: Potential Surge
📊 BTC Dominance: Reaction Zone
🌊 WAVESUSDT.P: Demand Zone Potential
🟣 UNIUSDT.P: Long-Term Trade
🔵 XRPUSDT.P: Entry Zones
🔗 LINKUSDT.P: Follow The River
📈 BTCUSDT.P: Two Key Demand Zones
🟩 POLUSDT: Bullish Momentum
🌟 PENDLEUSDT.P: Where Opportunity Meets Precision
🔥 BTCUSDT.P: Liquidation of Highly Leveraged Longs
🌊 SOLUSDT.P: SOL's Dip - Your Opportunity
🐸 1000PEPEUSDT.P: Prime Bounce Zone Unlocked
🚀 ETHUSDT.P: Set to Explode - Don't Miss This Game Changer
🤖 IQUSDT: Smart Plan
⚡️ PONDUSDT: A Trade Not Taken Is Better Than a Losing One
💼 STMXUSDT: 2 Buying Areas
🐢 TURBOUSDT: Buy Zones and Buyer Presence
🌍 ICPUSDT.P: Massive Upside Potential | Check the Trade Update For Seeing Results
🟠 IDEXUSDT: Spot Buy Area | %26 Profit if You Trade with MSB
📌 USUALUSDT: Buyers Are Active + %70 Profit in Total
🌟 FORTHUSDT: Sniper Entry +%26 Reaction
🐳 QKCUSDT: Sniper Entry +%57 Reaction
📊 BTC.D: Retest of Key Area Highly Likely
📊 XNOUSDT %80 Reaction with a Simple Blue Box!
📊 BELUSDT Amazing %120 Reaction!
I stopped adding to the list because it's kinda tiring to add 5-10 charts in every move but you can check my profile and see that it goes on..
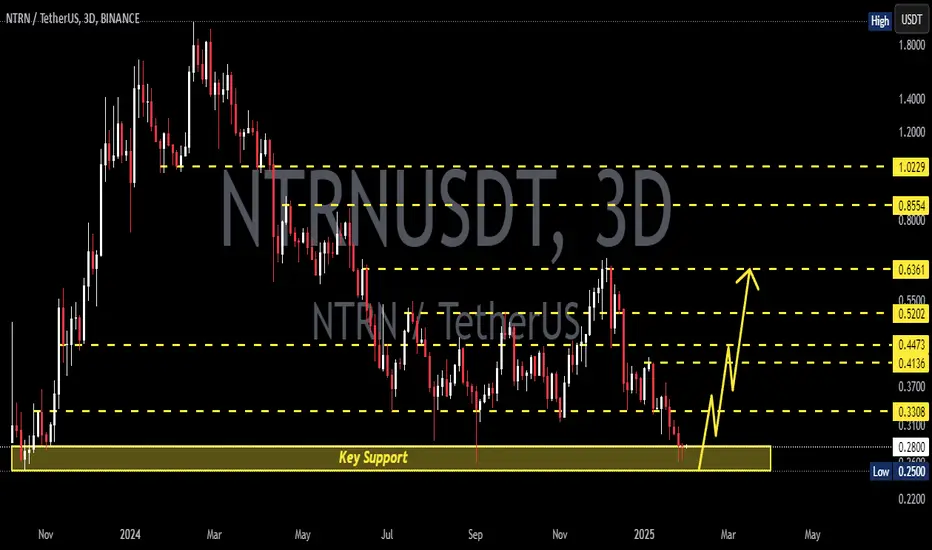
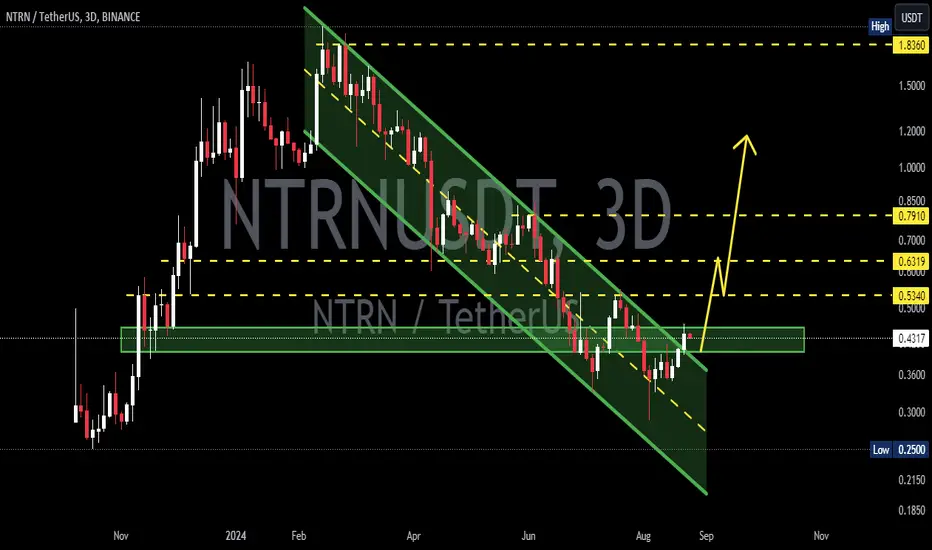
NTRNUSDT 3DNTRN ~ 3D
#NTRN This is the last support for this coin. If you still have a Conviction on this coin,. Buy from here with a minimum target of 20%+
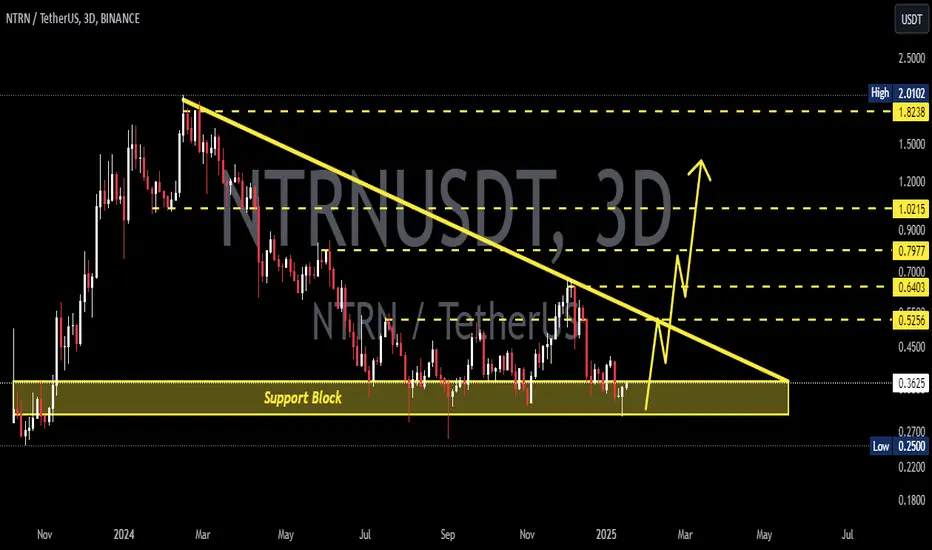
NTRNUSDT 3DNTRN ~ 3D
#NTRN Continue to maintain this support ,. If you still have Conviction on this coin,. Buy in stages from here, with a minimum target of 20%++
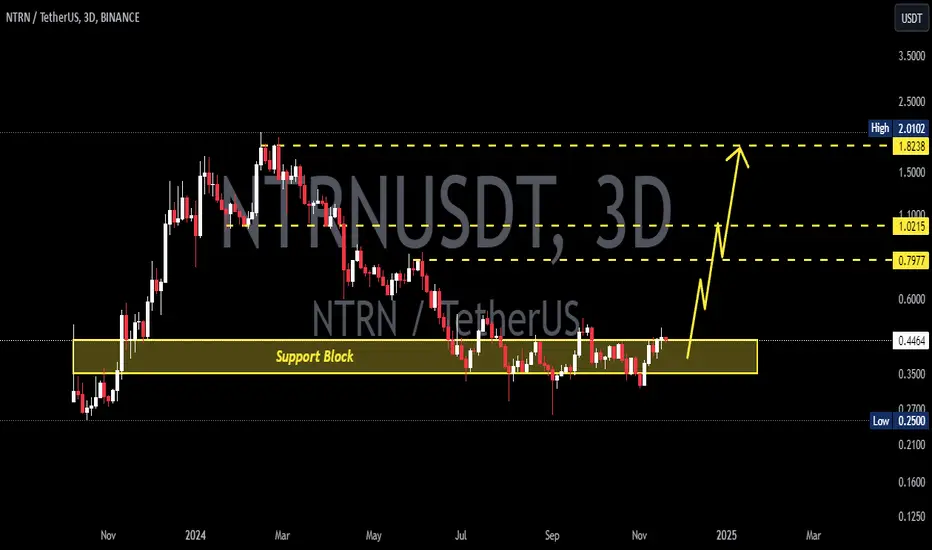
NTRNUSDT 3DNTRN ~ 3D
#NTRN Seller pressure is over. And now the price is moving sideways on this support block,. looks like an accumulation area. if you are interested in this coin,. Maybe this support block will be a very good buying place for now,. Minimum target 20%+
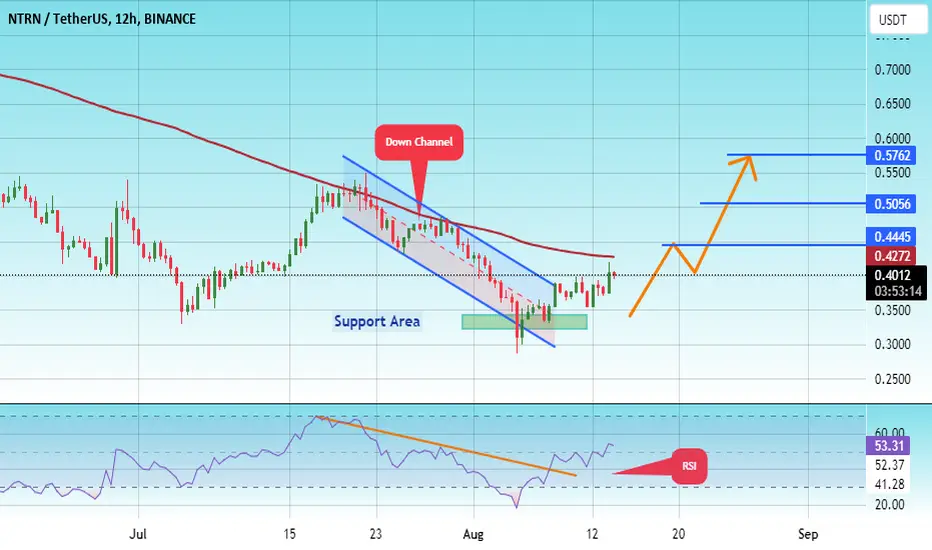
#NTRN/USDT#NTRN
The price is moving in a descending channel on the 12-hour frame and it was broken upwards
We have a bounce from a major support area in green at 0.3300
We have a downtrend RSI that was broken upwards which supports the upside
We have a trend to stabilize above the 100 moving average which supports the upside
Entry price 0.3570
First target 0.4445
Second target 0.5056
Third target 0.5762
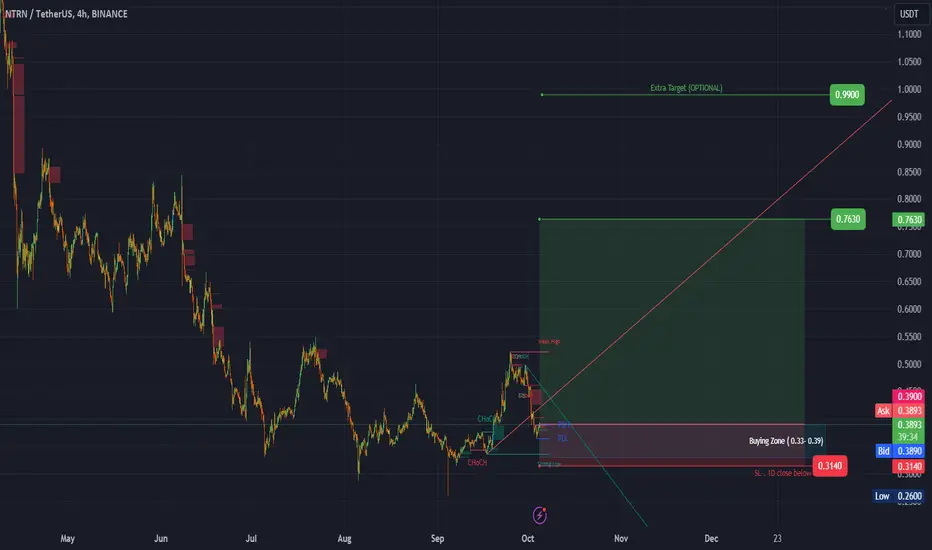
#NTRN (SPOT) entry range( 0.33- 0.39)T.(0.7630) SL(0.3140)BINANCE:NTRNUSDT
entry range( 0.33- 0.39)
Target (0.7630)
1 Extra Targets(optional) in chart, if you like to continue in the trade with making stoploss very high.
SL .1D close below (0.3140)
*** collect the coin slowly in the entry range ***
*** No FOMO - No Rush , it is a long journey ***
**** #Manta ,#OMNI, #DYM, #AI, #IO, #XAI , #ACE #NFP #RAD #WLD #ORDI #BLUR #SUI #Voxel #AEVO #VITE #APE #RDNT #FLUX #NMR #VANRY #TRB #HBAR #DGB #XEC #ERN #ALT #IO #ACA #HIVE #ASTR #ARDR #PIXEL #LTO #AERGO #SCRT #ATA #HOOK #FLOW #KSM #HFT #MINA #DATA #SC #JOE #RDNT #IQ #CFX #BICO #CTSI #KMD #FXS #DEGO #FORTH # AST #PORTAL #CYBER #CLV #RIF #ENJ #ZIL #APT #GALA #STEEM #ONE #LINK #NTRN ****
NTRNUSDTNTRN ~ 3D ✅
#NTRN Successfully broke through this descending pattern.
Bulls will push the price even higher as long as the price stays above this descending pattern.
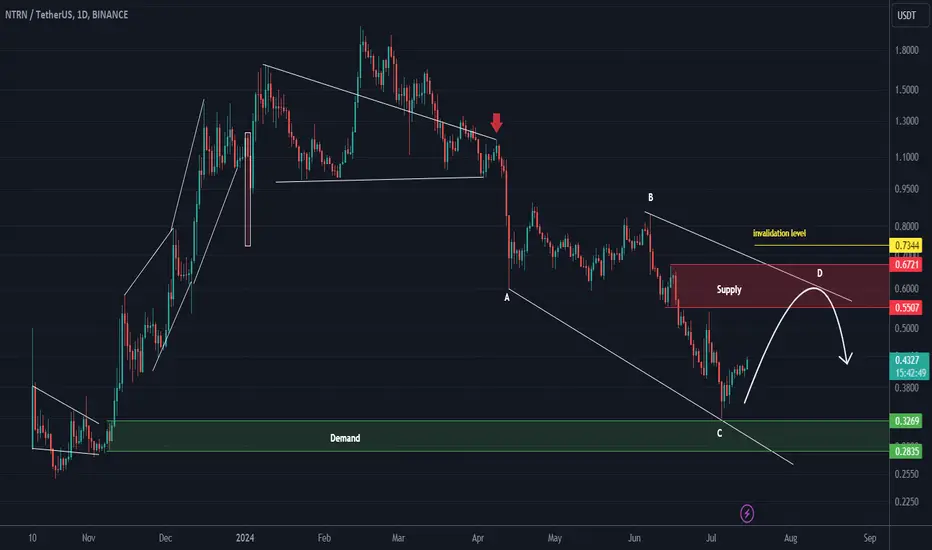
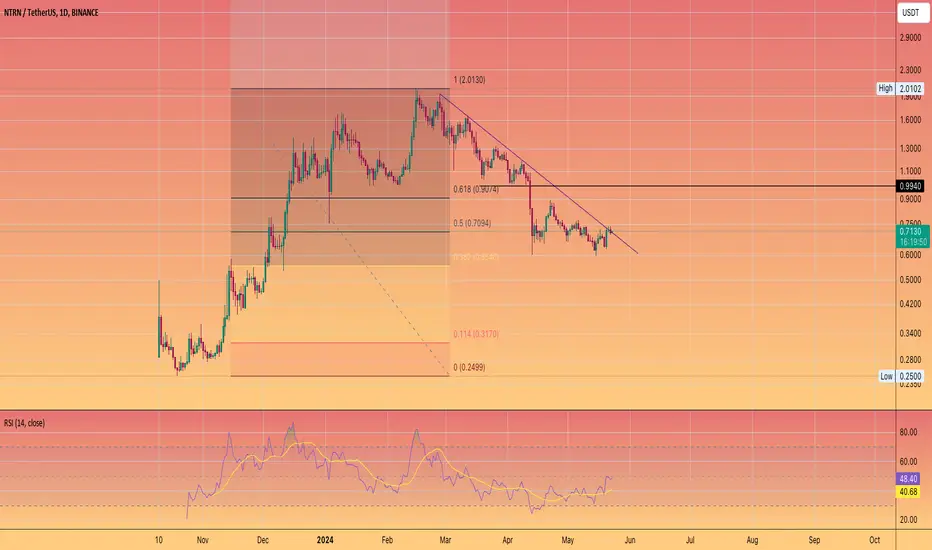
NTRN analysis (1D)From where we placed the red arrow on the chart, it seems that the correction of NTRN has started.
It appears to be in a triangular or diametric pattern.
The price can go up to the red range.
Price now appears to be completing wave D.
The red area is a supply, where you can look for sell/short scalp positions.
Closing a daily candle above the invalidation level will violate the analysis.
For risk management, please don't forget stop loss and capital management
Comment if you have any questions
Thank You
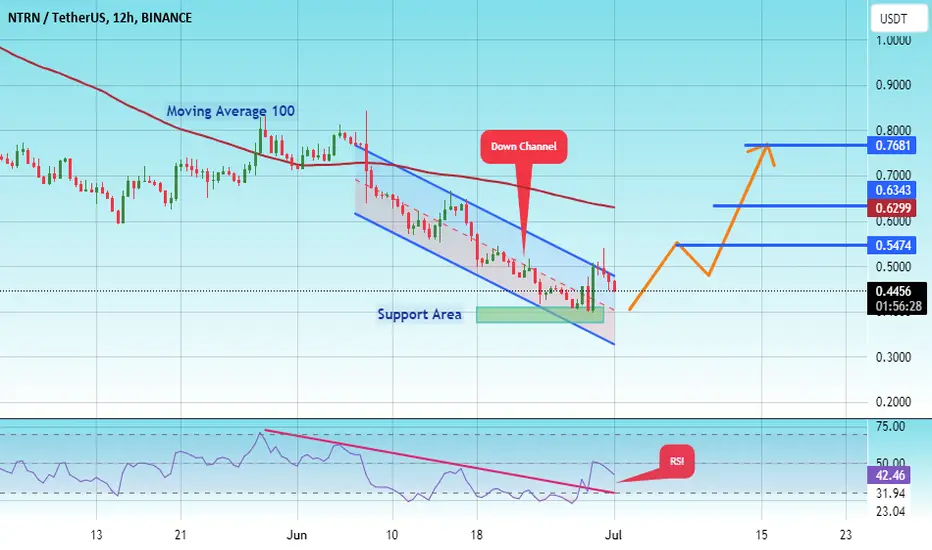
#NTRN/USDT#NTRN
The price is moving within a bearish channel pattern on the 12-hour frame, which is a strong retracement pattern
We have a bounce from a major support area in the color EUR at 0.3800
We have a tendency to stabilize above the Moving Average 100
We have a downtrend on the RSI indicator that supports the rise and gives greater momentum and the price is based on it
Entry price is 0.4475
The first target is 0.5474
The second target is 0.6230
The third goal is 0.7680
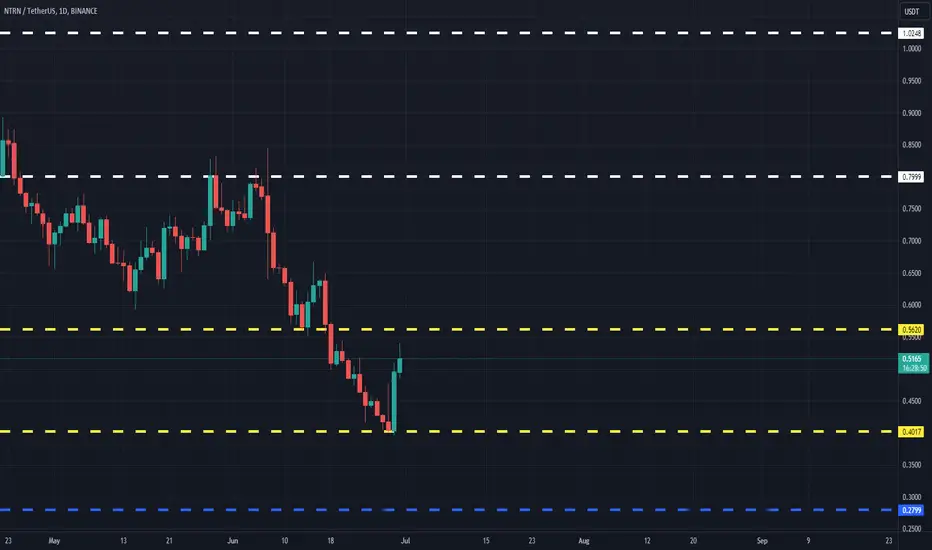
NTRNUSDT(Neutron) Daily tf Range Updated till 30-06-24NTRNUSDT(Neutron) Daily timeframe range. another PA is trying here,
it needs to stay above 0.4017 to be in safer side. close to local resistance at 0.5620. if it can clear it will open a more bigger area. for now all it needs volume.
NTRNUSD 12HNTRN ~ 12H
#NTRN Confluence Of Support.
Make purchases gradually. with a short term target of at least 15%+
NTRN looks bullishNTRN seems to be forming a bullish contraction triangle.
We seem to be in wave D now. Wave D of this triangle appears to be a diametric.
After the completion of wave D and wave E, we expect a pump towards the specified targets.
The targets are clear on the chart.
Closing a daily candle below the invalidation level will violate the analysis
For risk management, please don't forget stop loss and capital management
When we reach the first target, save some profit and then change the stop to entry
Comment if you have any questions
Thank You
NEUTRON $NTRN local Double bottomAfter a healthy correction of around -70%
(totally normal for a S coin)
we have technical basis for a recovery rally
A double bottom with bullish RSI divergence
A down trendline break
With a general altcoin rally I expect this to be trading back in the 1 dollar plus area soon enough.
ntrnIf it enters the green area, it should be checked to enter and continue the target up to the upper areas
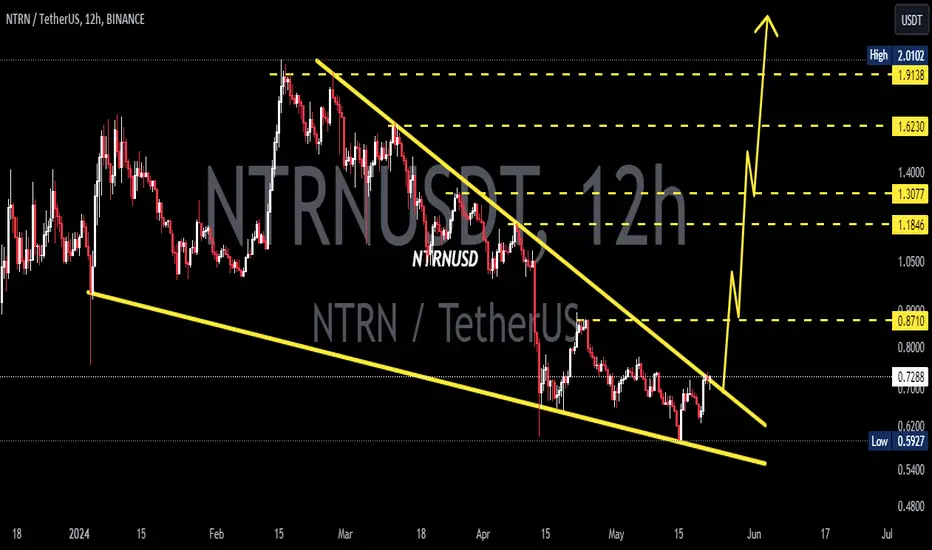
NTRN NEW LONG TREND PROCESSINGNTRN is looking interesting over the next time frames and may show increased volume. That's why we're keeping an eye on this coin.
$0.88 is a key confirmation zone. If the coin breaks this level, there's a high chance it could reach $1,28 - long term and hype times can make the coin target $2
Remember, there are no guarantees in the market. Always follow a consistent system based on your own strategies and analysis.
Good times, everyone.
This update is not trading or financial advice.
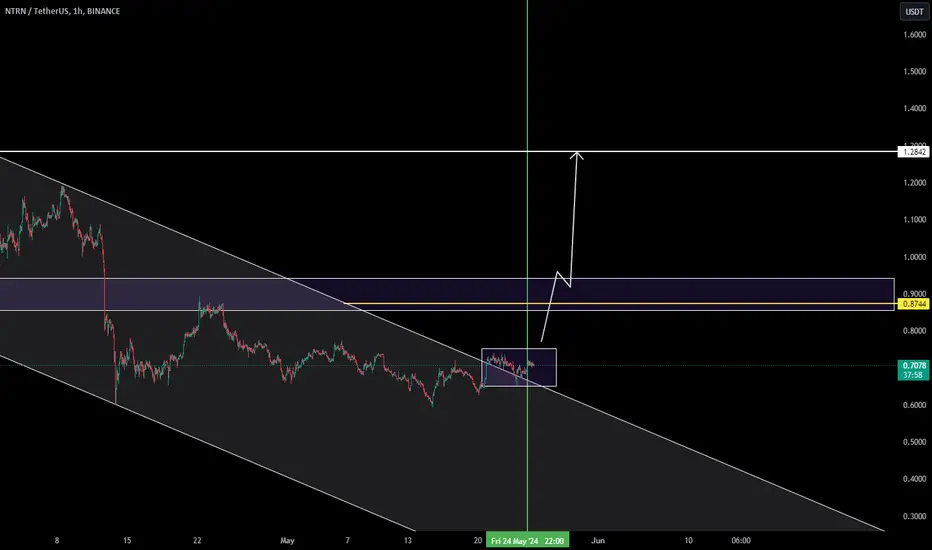
NTRN/USDT Gaining Momentum to Breakout of a Falling Wedge👀🚀💎Attention Paradisers! #NTRN is at a crucial point within a Falling Wedge, priming for a potential breakout. With the current market support at $0.593, there’s a vibrant chance it could power through this pattern due to the accumulated momentum.
💎If #Neutron cannot sustain this energy and slips beneath the $0.593 support, it might signal an extension of the bearish trend, propelling toward the next essential demand zone at $0.534. This particular level is known for its vigorous liquidity and has historically catalyzed significant bullish movements.
💎If SEED_DONKEYDAN_MARKET_CAP:NTRN tests this demand zone once more, it’s imperative that it secures a strong rebound to uphold support. However, failure to achieve this could intensify bearish pressures, worsen market sentiment, and potentially prompt further price declines.
💎Stay alert and adaptable, Paradisers. Your ParadiseTeam is diligently tracking and ready to guide you through the complex dynamics of the #NTRN market.
MyCryptoParadise
iFeel the success🌴

NTRNUSD 12HNTRN ~ 12H
#NTRN Make purchases gradually after successfully breaking through the resistance line of this pattern. with a minimum target of 15%+.
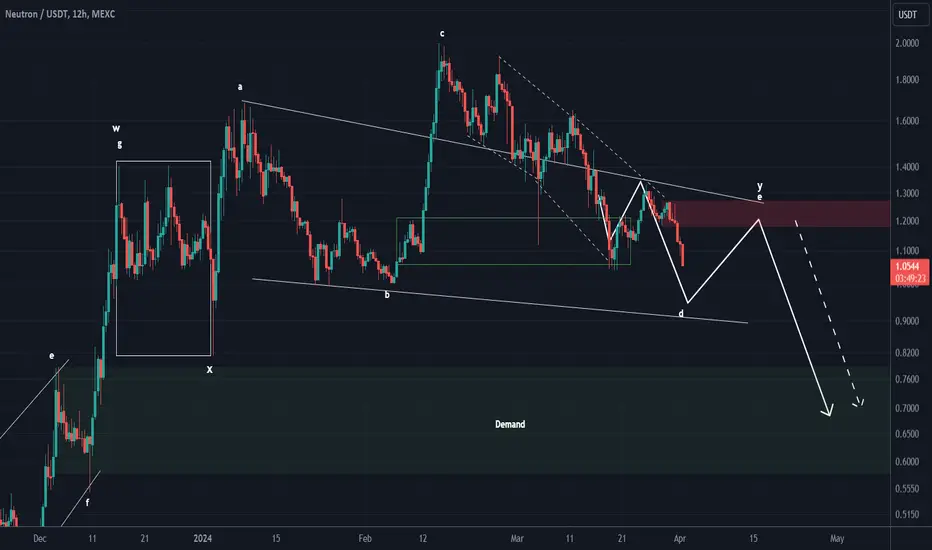
NTRN UPDATE (BEARISH)This is an update to the analysis you see in the "Related Ideas"
According to the previous analysis, the initial drop was done, but the path of NTRN is bearish
The NTRN chart gave us more data and the scenario is now better defined.
The upward movement seems to have been a double upswing. The first movement is diametric and the second movement is a big triangle, which we are now in wave D of this triangle.
We expect such a path for NTRN
For risk management, please don't forget stop loss and capital management
Comment if you have any questions
Thank You
Ntrn/Usdt Plan The NTRN/USDT pair appears to be gearing up for a breakout, with indications pointing towards a bullish move in the near future. In the event of a successful breakout, there is potential for a strong 50-100% bullish rally in the short term. It is important to note that this analysis is not financial advice, and it is recommended that you conduct your own research (DYOR) before making any investment decisions.
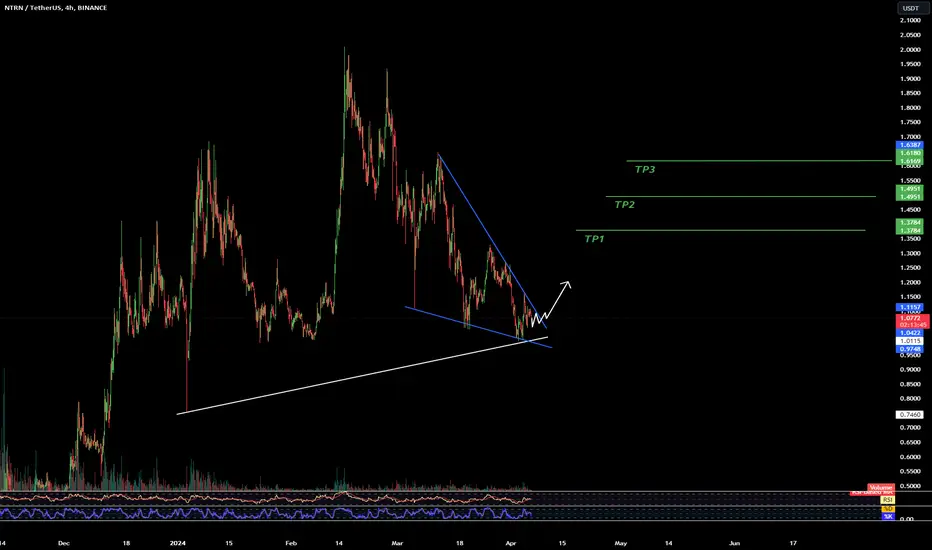
NTRNUSDT in anticipation SHOPPING on the spotCURRENT SITUATION: the increases are supported by the opinions of taxi drivers and divergences with a range of ~1.3784/1.4951/1.6169
EXPECTATIONS: I expect a C price above the indicated trend
ACTIONS: aggressive entry for now after H4 or "safer" entry when price C is above the trend; intermediate exits at levels: TP1~1.3784/TP2~1.4951/TP3~1.6169, SL from the last low with average range
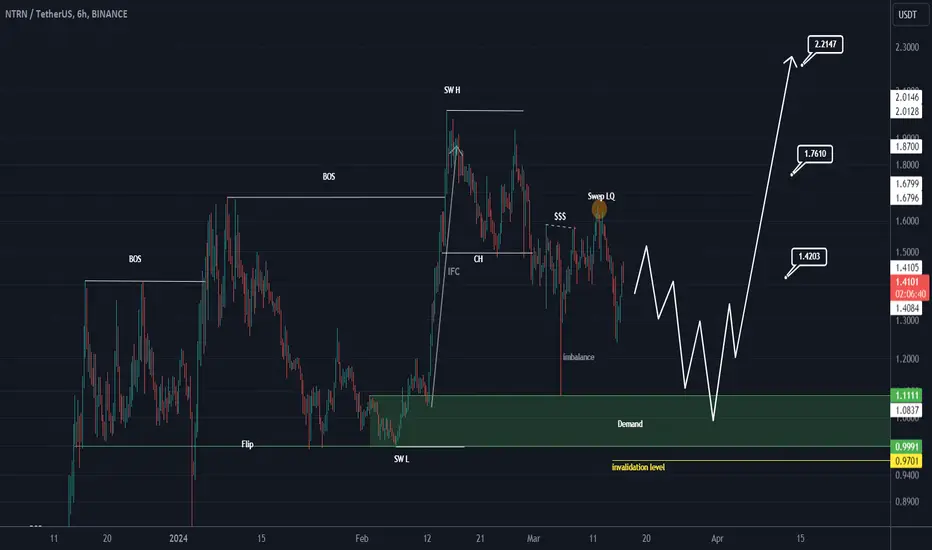
NTRN UPDATE (6H)NTRN after pump It has now entered a time-price correction phase.
According to the conditions we have on the chart, we have determined a low risk demand range for NTRN.
If it reaches the demand range, we will look for buy/long positions.
The targets are clear on the chart
Closing a daily candle below the invalidation level will violate the analysis
For risk management, please don't forget stop loss and capital management
When we reach the first target, save some profit and then change the stop to entry
Comment if you have any questions
Thank You