NVIDIA – From Thesis to Profits: How Fundamentals & Technicals 📚💡 NVIDIA – From Thesis to Profits: How Fundamentals & Technicals Aligned 🚀🧠
This isn’t just a trade —it’s a lesson in how conviction, timing, and structure come together when you truly understand what you're investing in.
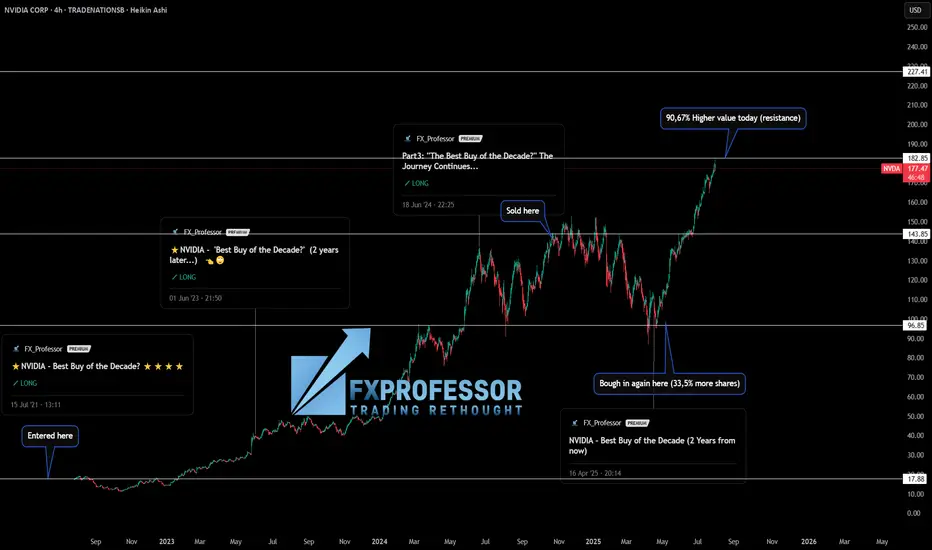
I’ve been publicly calling NASDAQ:NVDA the “Best Buy of the Decade” since July 2021 when the price was around $18. Why? Because I’m a gamer, I understand chips, and I knew exactly what NVIDIA was building long before AI became a buzzword. From graphics cards to data centers and AI compute, the fundamentals were solid.
But let me be clear: I’m not a holder forever. I use technical analysis to manage entries and exits. And that’s where the real edge comes in. 🎯
Here’s how the trade evolved:
✅ Initial entry: $17.88 (2021)
✅ First target hit: $143.85 → Took profits
✅ Re-entry: $96.85 → Got 33.5% more shares for the same money
✅ Today’s value (July 31st): Up +90.67% in just 100 days
📅 That’s from April 23rd to today.
(and it was ALL publicly posted here, for You!)
This is what happens when macro conviction meets micro execution.
🧠 The key takeaways:
Fundamentals gave me the why.
Technicals gave me the when.
And risk management gave me more shares for free.
That’s not luck —it’s structure, patience, and doing the work. If you’re just “HODLing” and hoping, consider learning how to work the chart instead of letting the chart work you.
Let me know in the comments—did you catch this move? Are you in, or waiting for the next entry?
One Love,
The FX PROFESSOR 💙
ps. in this case i did not sell many shares today i hedged with a short on SP500. Nvidia might correct a bit
Disclosure: I am happy to be part of the Trade Nation's Influencer program and receive a monthly fee for using their TradingView charts in my analysis. Awesome broker, where the trader really comes first! 🌟🤝📈
Nvda_analysis
Nvidia - This is clearly not the end!📐Nvidia ( NASDAQ:NVDA ) will confirm the breakout:
🔎Analysis summary:
Over the past couple of months, Nvidia managed to rally about +100%, reaching top 1 of total market cap. Most of the time such bullish momentum just continues and new all time highs will follow. But in order for that to happen, Nvidia has to confirm the all time high breakout now.
📝Levels to watch:
$150
🙏🏻#LONGTERMVISION
SwingTraderPhil

NVDA Bullish Weekly Trade Setup** – 2025-07-29
📈 **NVDA Bullish Weekly Trade Setup** – 2025-07-29
🚀 *"Momentum meets money flow!"*
### 🔍 Market Snapshot:
* 💥 **Call/Put Ratio**: 2.47 → Bullish sentiment confirmed
* 🧠 **RSI**: Rising on Daily & Weekly → Momentum building
* 🔕 **Low VIX**: Favors call strategies (cheap premiums)
* ⚠️ **Caution**: Light volume = soft institutional backing
---
### 🔧 Recommended Options Trade:
**🟢 NVDA \$182.50 CALL (Exp: Aug 1)**
💰 *Entry*: \~\$0.53 (Mid)
📈 *Profit Target*: \$0.69 – \$1.06
🛑 *Stop Loss*: \$0.32
📆 *DTE*: 3 days
🔄 *Entry Timing*: Market Open
✅ *Confidence*: 75%
🔥 *Theta & Gamma Risk*: Elevated — manage position size!
---
### 💡 Why This Trade?
✅ RSI Strength across timeframes
✅ Flow favors upside
✅ Cheap premium in a low-volatility regime
🟡 Just watch that volume…
---
📊 **TRADE SNAPSHOT (JSON):**
```json
{
"instrument": "NVDA",
"direction": "call",
"strike": 182.50,
"expiry": "2025-08-01",
"confidence": 0.75,
"profit_target": 1.06,
"stop_loss": 0.32,
"size": 10,
"entry_price": 0.53,
"entry_timing": "open",
"signal_publish_time": "2025-07-29 11:59:10 UTC-04:00"
}
```
---
📣 **Taglines for Sharing:**
* "NVDA setup is 🔥—momentum + flow = GO!"
* "Gamma risk is real—but so is this profit window 💸"
* "Short-term sprint or fade? This call has range."

NVDA 0DTE TRADE SIGNAL – JULY 25, 2025
⚡ NVDA 0DTE TRADE SIGNAL – JULY 25, 2025 ⚡
🚀 Strong Bullish Momentum – But Friday Expiration = Gamma Trap?
⸻
📊 Market Stats:
• 💰 Call Volume: Strong
• 🔻 Weak Volume Overall
• ⚖️ Call/Put Ratio: Bullish
• 📈 RSI: Overbought but still pushing
• ⏳ Time Decay: Accelerating
• ☠️ Gamma Risk: 🔥 MAX today (0DTE)
⸻
🧠 Model Summary:
• Grok/xAI: 🔒 NO TRADE today – wait for Monday
• Claude: 🛑 Caution – avoid entries today
• DeepSeek: ⏸️ 4/5 Bullish, wait for cleaner setup
• Gemini: 💡 Suggests $180C next week
• Llama: ✅ Bullish bias, but gamma risk = no go for Friday
⸻
📌 TRADE IDEA: Wait for Monday
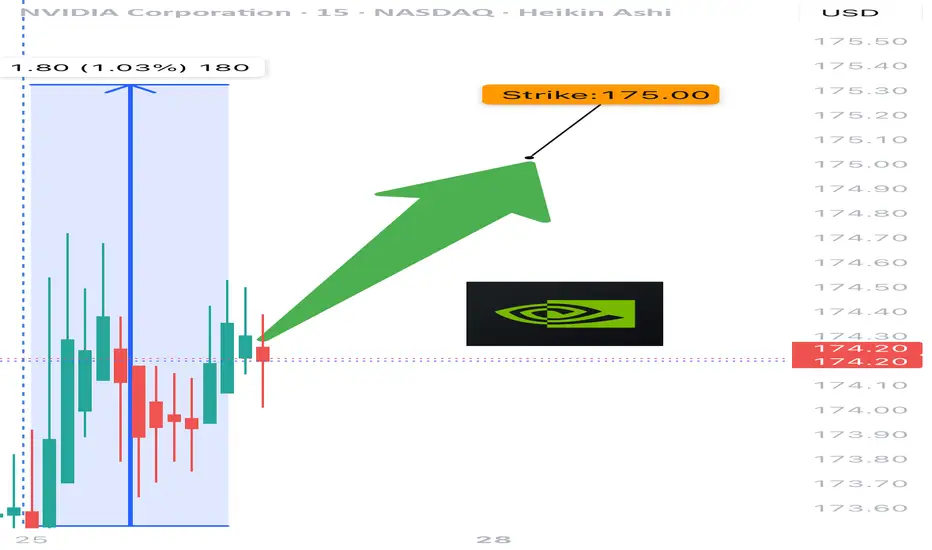
📍 Strike: $175 Call
📆 Expiry: Today (0DTE)
💵 Entry Price: $0.56
🎯 Target: $0.95
🛑 Stop: $0.30
📈 Confidence: 65%
🕒 Entry Timing: Monday open IF support holds
⸻
⚠️ Key Warning:
Don’t get trapped by 0DTE gamma swings. Momentum says yes, time decay says no…
✅ Best move? Watch NVDA closely, then strike on Monday if volume confirms.
⸻
👍 Like & save if you’re tracking NVDA.
🔁 Repost if you’re waiting for the perfect Monday setup!
#NVDA #OptionsTrading #0DTE #GammaRisk #BullishSetup #TradingView #TechStocks #WeeklyOptions
$NVDA WEEKLY TRADE IDEA – JULY 21, 2025
💥 NASDAQ:NVDA WEEKLY TRADE IDEA – JULY 21, 2025 💥
🔥 Bullish Options Flow + Weekly RSI Strength = Controlled Momentum Play
⸻
📊 Trade Details
🔹 Type: Long Call
🎯 Strike: $180.00
📆 Expiry: July 25, 2025 (4DTE)
💰 Entry: $0.51
🎯 Target: $1.02 (💯% Gain)
🛑 Stop: $0.20 (~40% Risk)
📈 Confidence: 65%
🕰️ Timing: Monday Open
📦 Size: 1 Contract (Adjust based on risk tolerance)
⸻
📈 Why This Trade?
✅ Call/Put Ratio = 1.48 → Bullish bias confirmed
📈 Weekly RSI = 77.0 → Strong momentum
🔻 Daily RSI = 80.8 (falling) → Short-term pullback risk
📉 Volume = flat (1.0x) → Weak confirmation = tighter risk mgmt
🧠 Strike Clustering: $177.50 & $180 = strong OI zones
🌬️ VIX = 16.7 → Favorable for long premium plays
⸻
⚠️ Risks & Strategy Notes
❗ Daily RSI = caution: short-term exhaustion possible
📉 Weak volume = lack of institutional chase
⏳ Exit before Friday – avoid IV crush and gamma slam
🔐 Set alerts at $178.75 and $179.80 – pre-breakout signals
⸻
🎯 Plan:
• Enter Monday open
• Scale partials if price hits +30–50%
• Full exit by Thursday unless price is breaking through $180 early with strong volume
⸻
🏁 Quick Verdict:
This is a momentum continuation setup, not a fresh breakout.
Play the trend, respect RSI signals, and cut fast if flow dries up.
NASDAQ:NVDA 180C — Risk $0.20 to Target $1.02
Let the call ride… just don’t overstay.
⸻
#NVDA #OptionsTrading #CallOption #WeeklyPlay #MomentumTrade #FlowBasedSetup #TradingViewIdeas #GammaPlay #BullishBias #NVIDIA

NVIDIA Robbery Plan: Bullish Swing Trade to Millions!🔥 NVIDIA (NVDA) Stock Heist Blueprint: Unlock Bullish Profits with Thief Trading Style! 🚀💰
🌟 Greetings, Wealth Warriors! 🌟
Hello, Ciao, Salaam, Bonjour, Hola, and Hallo to all you savvy traders and market masterminds! 🤑💸 Get ready to execute a high-octane trading plan with our Thief Trading Style—a bold fusion of technical precision and fundamental insights designed to crack the NVIDIA (NVDA) stock market vault! 💥📈
📝 The NVIDIA Heist Plan: Swing & Day Trading Mastery 🏆
Based on our proprietary Thief Trading Style, this plan targets NVIDIA (NVDA), currently riding a bullish wave fueled by strong fundamentals and technical setups. Follow the strategy outlined below to navigate the high-risk Red Zone—where overbought conditions, consolidation, and potential trend reversals create opportunities for sharp traders. 💪 Stay alert, as bearish players may set traps at key levels! 🕵️♂️
Entry Strategy: Crack the 🙂Vault! 🏦
Go long with confidence! The market is primed for a bullish breakout. Enter at current prices or set buy limit orders near recent swing lows/highs on the 15-minute or 30-minute timeframe. 📅
Pro Tip: Set price alerts on your chart to catch the optimal entry. Timing is everything in this heist! ⏰
Swing Traders: Look for pullbacks to key support levels for safer entries.
Scalpers: Focus on quick long-side trades with tight stops to maximize gains. 💨
Stop Loss: Protect Your Loot! 🔒
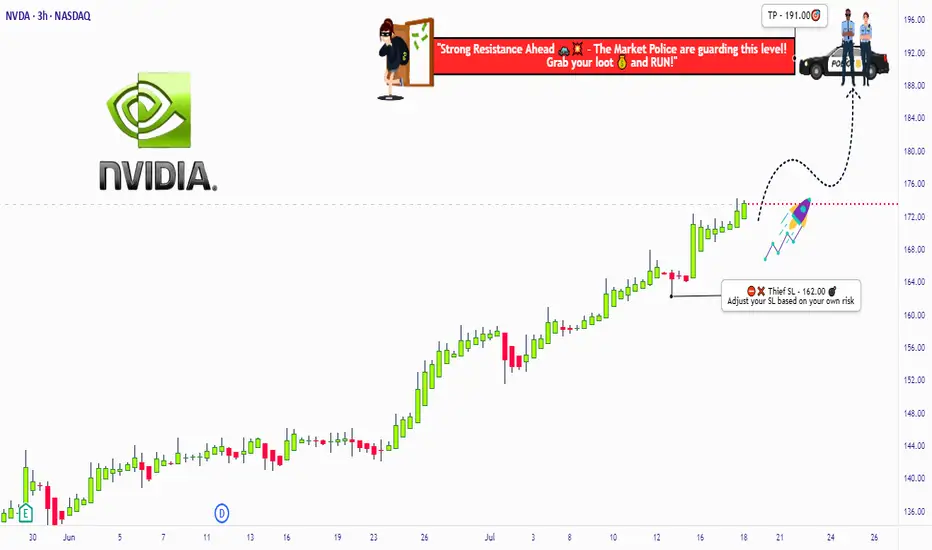
Place your stop loss (SL) below the recent swing low on the 30-minute timeframe (e.g., $162.00 for swing trades).
Adjust your SL based on your risk tolerance, position size, and number of orders. For larger accounts, consider tighter stops to lock in gains early. 🛡️
Scalpers: Use a trailing stop to secure profits while riding short-term momentum.
Take Profit Target: Cash Out Big! 💰
Aim for $191.00 as the primary target, or exit early if momentum slows.
Swing Traders: Hold for the full target if the trend remains strong.
Scalpers: Grab quick profits on smaller price spikes and re-enter on dips.
Pro Move: Use a trailing stop to let profits run while safeguarding gains. 🚀
📌Key Levels & Risk Management
Entry Zone: Market price or swing low – ideal for long positions. 📈
Stop Loss: $162.00 – based on 30m timeframe swing low. 🛑
Take Profit Target: $191.00 – primary target for swing/day trades. 🎯
Risky Red Zone: Overbought levels – watch for consolidation or reversal traps. ⚠️
💡 Why NVIDIA? The Bullish Case 📡
NVIDIA (NVDA) is powering through a bullish phase, driven by:
Fundamentals: Strong demand for AI, gaming, and data center chips. 📊
Macro Factors: Positive market sentiment and tech sector momentum. 🌍
COT Data (Latest Friday Update, UTC+1): Large speculators are increasing bullish positions, signaling confidence in NVDA’s upside (data sourced from reliable platforms). 📅
Geopolitical & News: Monitor upcoming earnings and industry developments for catalysts. 📰
Intermarket Analysis: Tech-heavy indices like the NASDAQ are trending higher, supporting NVDA’s rally. 📈
For a deeper dive, check fundamental reports, COT data, and sentiment analysis to align your trades with the bigger picture. 🔍
⚠️ Trading Alert: Navigate News & Volatility 🗞️
News releases can spark sharp price swings. To protect your capital:
Avoid new trades during major news events (e.g., earnings or Fed announcements). 🚫
Use trailing stops to lock in profits and limit downside risk. 🔐
Stay updated with real-time market developments to adjust your strategy dynamically. 📡
🚀 Boost the Heist! Support the Thief Trading Community 🤝
Love this plan? Hit the Boost Button to amplify our Thief Trading Style and empower our community to conquer the markets! 💥 Every like and share fuels our mission to make money with precision and style. 💪 Join us daily to unlock more high-profit heist plans! 🏴☠️
📌 Important Disclaimer
This analysis is for educational purposes only and not personalized investment advice. Always conduct your own research, assess your risk tolerance, and verify market conditions before trading. Markets move fast—stay sharp and adapt! ⚡
🌟 Stay tuned for the next heist plan, traders! Let’s keep stealing profits together! 🤑🐱👤🎉
Nvidia (NVDA) Share Price Surges Above $170Nvidia (NVDA) Share Price Surges Above $170
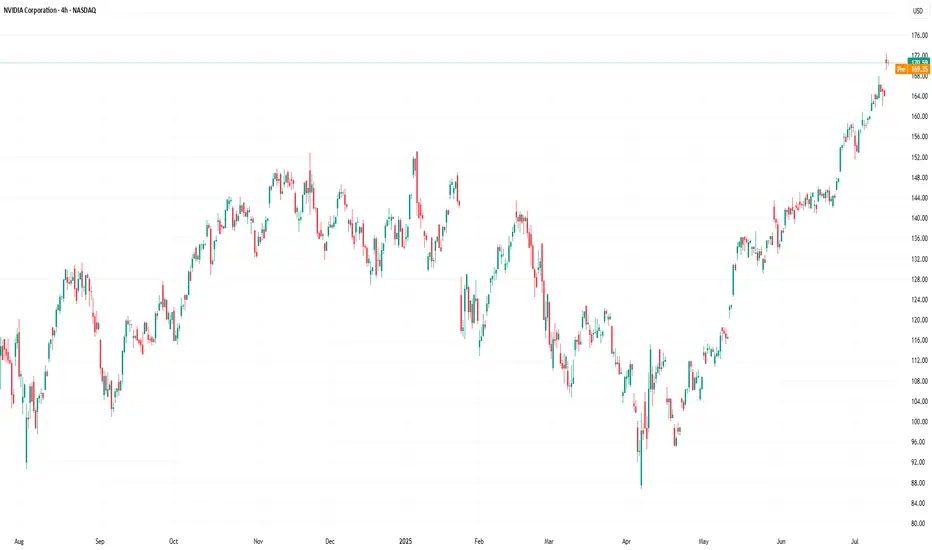
Yesterday, Nvidia’s (NVDA) share price rose by more than 4%, with the following developments:
→ It surpassed the psychological level of $170 per share;
→ Reached another all-time high;
→ Gained more than 9% since the beginning of the month.
The bullish sentiment is driven by Nvidia CEO Jensen Huang’s visit to China shortly after meeting with US President Trump. At the same time:
→ US Secretary of Commerce Howard Lutnick stated that the planned resumption of sales of Nvidia H20 AI chips in China is part of the US negotiations on rare earth metals.
→ The head of Nvidia stated that he was assured licences would be granted very quickly, and that a large number of orders for H20 chip deliveries had already been received from Chinese companies.
Market participants are viewing the situation with strong optimism, and analysts are raising their valuations for NVDA shares:
→ Morningstar analysts raised their fair value estimate for Nvidia shares from $140 to $170.
→ Oppenheimer analysts increased their target price from $170 to $200.
Technical Analysis of the NVDA Chart
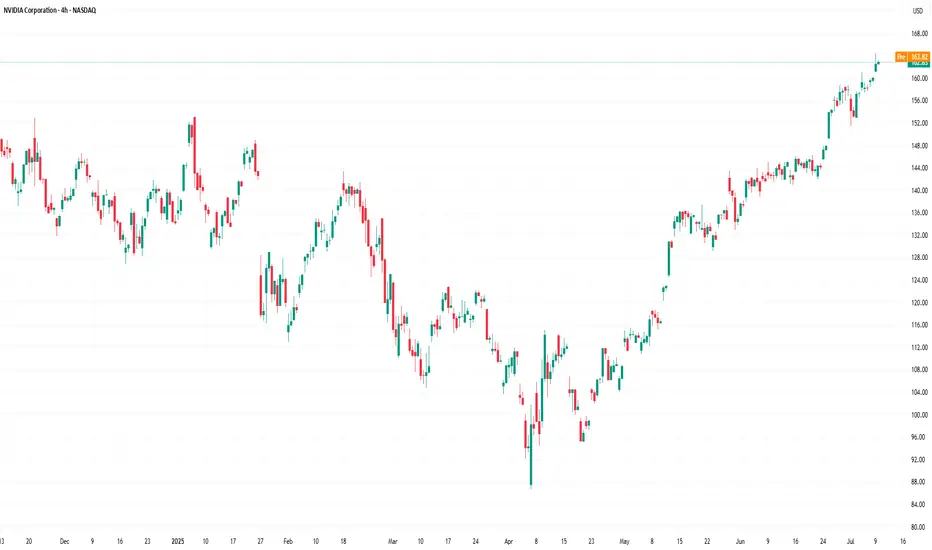
The price trajectory of NVDA shares fully reflects the exceptionally strong demand:
→ The price is moving within an ascending channel with a steep growth angle;
→ Since early May, the RSI indicator on the 4-hour chart has not fallen below the 50 level;
→ Yesterday’s trading session opened with a large bullish gap.
The chart also shows the formation of a stable bullish market structure (shown with a purple broken line), expressed through a sequence of higher highs and higher lows.
Given the above, it is difficult to imagine what might cause a sharp shift from positive to negative sentiment. If a correction begins (for example, with a test of the $160 level), traders should watch for signs of its completion — this could present an opportunity to join the emerging rally.
This article represents the opinion of the Companies operating under the FXOpen brand only. It is not to be construed as an offer, solicitation, or recommendation with respect to products and services provided by the Companies operating under the FXOpen brand, nor is it to be considered financial advice.
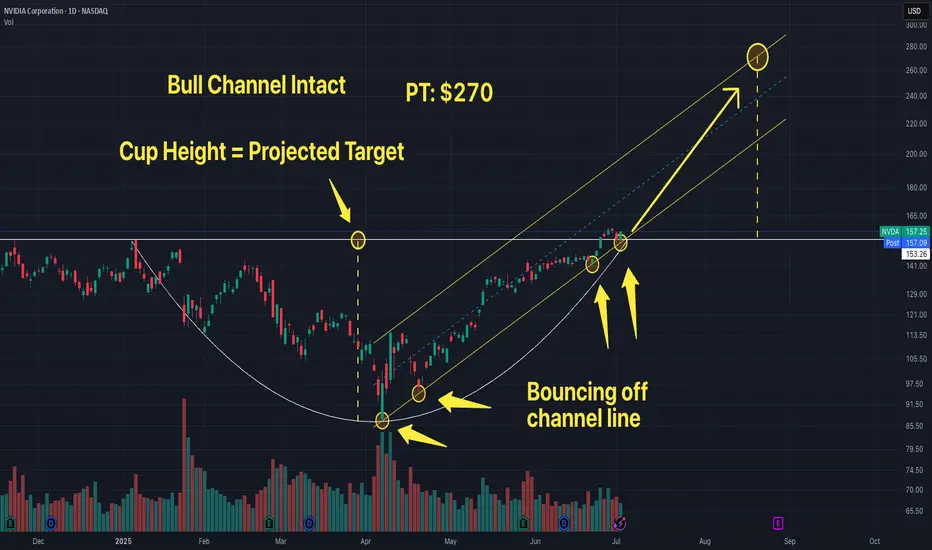
$NVDA - $270 PT in BULL ChannelThe stock is currently bouncing off of the lower channel line of the rising Bull Channel. Price action has created a Cup and Handle. The projected Price Objective sits at around $270. Remember, the height of the cup is the project target which from current stock price extends to around $270.
Nvidia Market Capitalisation Reaches $4 TrillionNvidia Market Capitalisation Reaches $4 Trillion
Yesterday, Nvidia’s (NVDA) share price surpassed $162 for the first time in history. As a result, the company’s market capitalisation briefly exceeded $4 trillion during intraday trading (according to CNBC), making Nvidia the first publicly listed company to reach this milestone.
The rise in NVDA’s share price is being driven by both bullish sentiment across the broader equity market—which appears optimistic ahead of the upcoming Q2 earnings season—and evidence of sustained demand for Nvidia’s products, as artificial intelligence technologies continue to gain widespread adoption.
Noteworthy developments include:
→ Nvidia may begin producing a specialised AI chip for the Chinese market this autumn, potentially circumventing current export restrictions;
→ Perplexity, a company backed by Nvidia, is launching an AI-powered browser aimed at competing with Google Chrome.
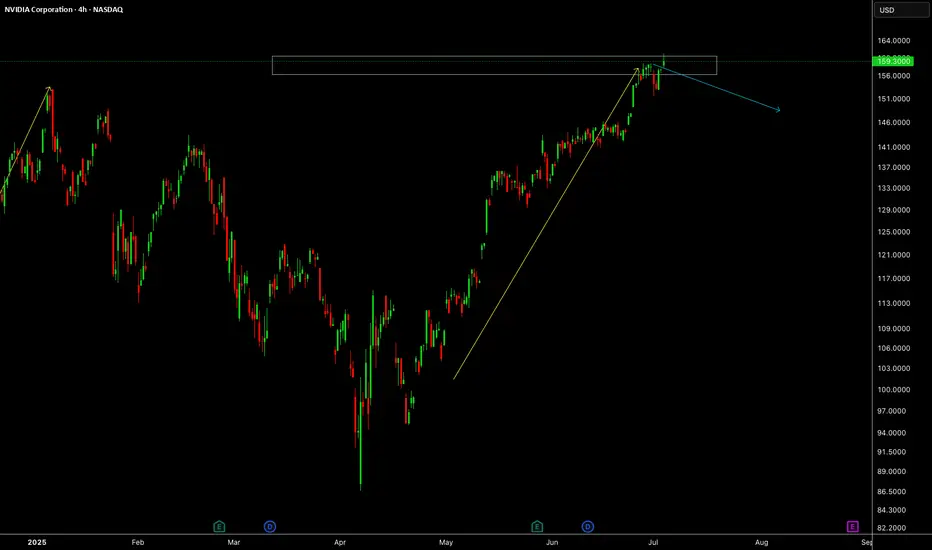
Technical Analysis of NVDA Chart
In our previous analysis of NVDA’s price action, we:
→ Drew an ascending channel;
→ Highlighted bullish conviction in overcoming the $145–150 resistance zone.
The channel remains valid, with the current price trading near its upper boundary. However, the RSI indicator is showing signs of bearish divergence, suggesting that the stock may be vulnerable to a near-term correction—potentially towards the median line of the existing upward channel.
At the same time, a major shift in the prevailing bullish trend appears unlikely. The $145–150 range may serve as a key support zone for NVDA in the foreseeable future.
This article represents the opinion of the Companies operating under the FXOpen brand only. It is not to be construed as an offer, solicitation, or recommendation with respect to products and services provided by the Companies operating under the FXOpen brand, nor is it to be considered financial advice.
Nvidia - New all time highs!Nvidia - NASDAQ:NVDA - breaks out now:
(click chart above to see the in depth analysis👆🏻)
Within two and a half months, Nvidia rallied more than +70%. Following this recent bullish strength, a retest of the previous highs was totally expected. But this does not seem to be the end at all. There is a much higher chance that we will see new all time highs soon.
Levels to watch: $150
Keep your long term vision🙏🙏
Philip (BasicTrading)

NVDA Analysis To 164?Quick breakdown of NVDA
Appears we hit our corrected level, we could go deeper possibly or hold at this level and drive up to 164
This is looking like a nice little setup long indeed
Trade Smarter Live Better
Kris/Mindbloome Exchange
NVIDIANVIDIA is due for correction, anytime it can start. This week probably would be a good week to start the correction.
Disclosure: We are part of Trade Nation's Influencer program and receive a monthly fee for using their TradingView charts in our analysis.
My buy view for NVDAMy buy view for NVDA.
Nvidia has made a significant push up after the meltdown following the new US tariff news.
The push-up is likely cooling off for this baby.
If the current consolidation continues to be sustained by the support zone (TL) in this zone, we are likely to see NVDA rally to $149 and $152 as TP1 and TP2, respectively.
My SL will be around $128.9 zone for both.
RR of 1:4 and 1:4.8
Trade with care
Nvidia (NVDA) Share Price Soars to Record HighNvidia (NVDA) Share Price Soars to Record High
Yesterday, Nvidia’s (NVDA) share price surged by over 4%, with the following key developments:
→ It broke through the psychological $150 per share level;
→ It reached a new all-time high;
→ It also contributed to the Nasdaq 100 index hitting a record peak, as we reported earlier this morning.
As a result, Nvidia has reclaimed its status as the world’s most valuable company. Demand for its shares is being fuelled by the CEO’s optimism.
“We have many growth opportunities across our company, with AI and robotics the two largest, representing a multitrillion-dollar growth opportunity,” said Jensen Huang at Nvidia’s annual investor conference.
Technical Analysis of the NVDA Chart
The last three candlesticks reflect strong demand, as:
→ There are bullish gaps between the candles;
→ Lower wicks are either absent or minimal;
→ Candles are closing near their highs with progressively widening spreads.
This suggests strong momentum as the price confidently breaks through the key $150 resistance level. It is reasonable to assume that the current imbalance in favour of buyers around the $146–150 area (highlighted in purple) may form a support zone in the event of a pullback — for instance, within the existing upward channel (shown in blue).
This article represents the opinion of the Companies operating under the FXOpen brand only. It is not to be construed as an offer, solicitation, or recommendation with respect to products and services provided by the Companies operating under the FXOpen brand, nor is it to be considered financial advice.
NVDA Swing Trade – Overbought Reversal Setup (June 12, 2025)📉 NVDA Swing Trade – Overbought Reversal Setup (June 12, 2025)
Ticker: NASDAQ:NVDA | Bias: 🔻 Moderately Bearish
Strategy: Short-Term Swing | Timeframe: ~2 weeks
Confidence: 75% | Entry Timing: Market Open
Expiry: June 27, 2025
🔍 Market & Technical Snapshot
• Price: ~$144.67
• Trend: Weekly and M15 uptrend still intact
• RSI (Daily): ~70.63 → Overbought
• MACD: Bearish crossover on Daily
• Options Data:
– Heavy put OI at $140 (14,803 contracts)
– Max pain at $135 → potential pull lower
– High call OI at $145–$150 caps upside
🧠 AI Model Breakdown
🔼 Grok/xAI (Bullish Swing):
• Calls out strong technicals, 5-min momentum
• Suggests $155C for upside play
🔽 DeepSeek (Bearish Swing – Preferred):
• Overbought daily RSI + bearish MACD
• Strong put volume + options market pressure
• Targets pullback to $138–$140 → PUT @ $140
✅ Recommended Trade Setup
🎯 Direction: PUT
📍 Strike: $140
📅 Expiry: 2025-06-27
💵 Entry Price: $2.09
🎯 Profit Target: $3.10 (+48%)
🛑 Stop Loss: $1.25 (–40%)
📈 Confidence: 75%
📏 Size: 1 contract
⏰ Entry Timing: Market Open
⚠️ Risk Considerations
• Weekly chart still bullish → risk of trend continuation
• Low VIX (17.26) = slower option premium movement
• Positive news surprise could cause upside gap
• Use tight risk controls and monitor intraday structure
💭 NASDAQ:NVDA : Extended or just gearing up for another breakout?
📉 Drop your play below — Put buyers vs. breakout chasers 👇
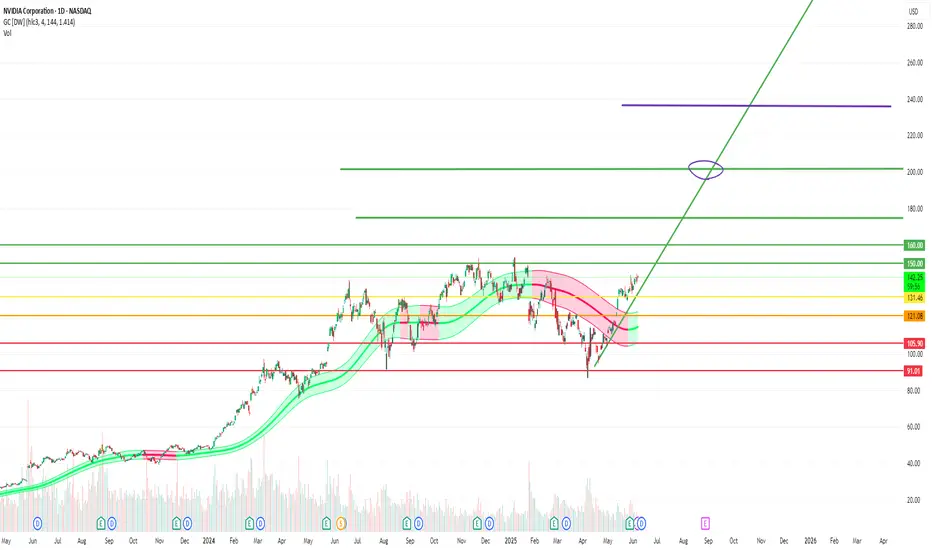
Fundamental and technical analysis on NVDA (Chicken Nugget) soonFundamental Analysis
NVIDIA Corporation (NVDA) remains a key player in the tech sector, benefiting from the rise of artificial intelligence, data centers, and gaming. With sustained growth, constant innovation, and strong demand for its graphics chips, the company continues to deliver solid financial results.
Recent reports indicate revenue growth and expansion in key markets. Product diversification, particularly in supercomputers and embedded systems, strengthens NVDA’s position against competitors. Investor interest in the semiconductor industry helps maintain the stock’s positive momentum.
Technical Analysis
The chart analysis highlights key technical levels for investors:
- Key Resistance: $150 USD – This level must be broken to confirm a strong bullish trend. A breakout with volume could signal a gradual rise toward higher targets.
- Support Level: $131.50 USD – Strong demand and low supply are identified at this level, making it an excellent entry point for investors looking for buying opportunities before a potential rebound.
Targets & Strategy
- Short-term target (late June/early July): The target range of $170-$175 USD is possible if the bullish trend is confirmed. This level aligns with technical extensions and favorable market dynamics.
- July buyback (-5% to -10%): A moderate correction could occur, offering another buying opportunity before an upward recovery.
- Selling target (September to November): The next selling target is between $200-$240 USD, depending on market developments and investor sentiment.
Conclusion
NVDA stock presents interesting prospects, with well-defined technical levels and a strong fundamental outlook. Investors should monitor these thresholds to adjust their strategy based on market fluctuations.
If you want to refine this analysis or explore other scenarios, I'm here to dive deeper into key points! 🚀 Subscribe! TSXGanG
I hold a CCVM and MNC (Certificate of Competence to become a securities broker anywhere in Canada) and have been working as a trader for five years.
It’s a pleasure for me to help people optimize their trading strategies and make informed financial market decisions.
NVDA 4-hr Outlook1. Swept Weekly High with draw back into 4-hr gap up.
2. If price breaks below here, my target becomes the re-test of the 4-hr break due to the impulse move through that high.
a. WARNING: Need to watch for support on Weekly FVG and CE of 4-hr wick and support off .382 fib.
b. If target breaks below, then I would like long puts or sell calls into re-test of break as it shows rejection on the .25 fib line.
3. As we re-test this area I would like to see full support into the .50 fib/FVG.
a. Why? Confluence with FVG and Fib
b. Want to see a hammer style candle indicating support

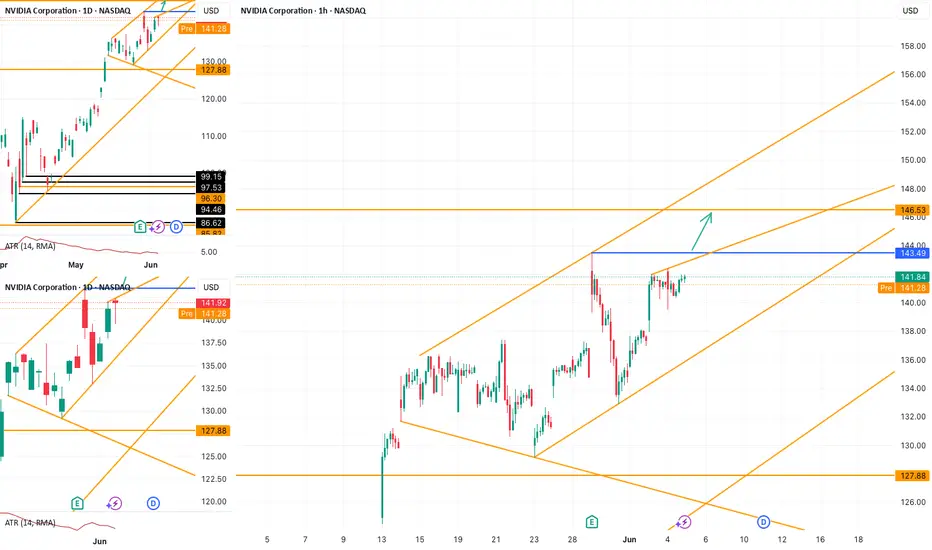
NVDA Setup: Clean Path to 146.53 If 143.49 Gives WayNASDAQ:NVDA continues to move within a rising channel. On the 1H chart, no major trendline currently limits further upside. If price breaks above the key swing high at 143.49 , the next potential target lies around 146.53 .
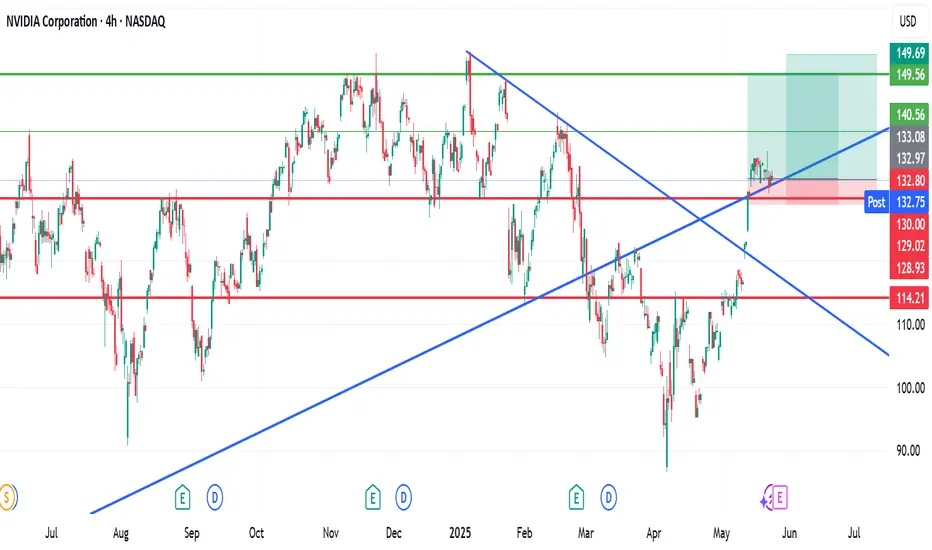
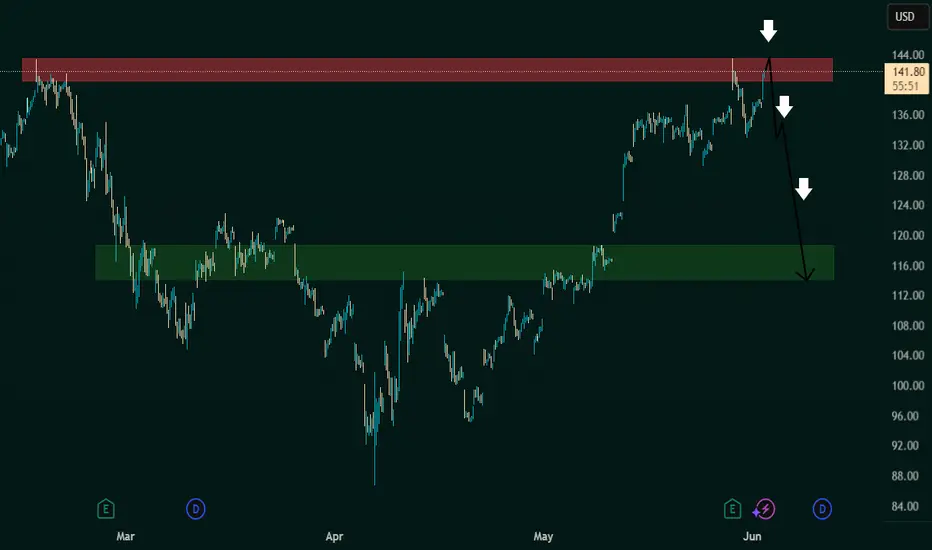
Potential Reversal Zone for NVDAThis chart of NVIDIA Corporation (NVDA) as of June 3, 2025, shows a technical analysis scenario forecasting a possible bearish reversal. The price action, zones, and arrows suggest a setup based on supply and demand zones.
Key Elements in the Chart:
🔴 Supply Zone (Resistance Area)
Location: Around $141.73 to ~$144
Observation: The price recently entered this red-shaded area, indicating strong historical resistance.
Implication: The area is expected to act as a ceiling, where sellers may overwhelm buyers, causing a reversal.
⚫ Price Reaction:
The chart shows price approaching and briefly piercing the supply zone, followed by a bearish candle or rejection (as indicated by the top arrow).
Arrows project a downward movement, suggesting bearish sentiment.
🟢 Demand Zone (Support Area)
Location: Approximately $114–$121
Observation: This green-shaded area acted as a base for a previous upward move.
Implication: It is likely to act as a strong support if the price drops significantly.
Projected Price Path:
Short-term reversal from the resistance zone (~$144).
Initial drop to mid $130s (likely a lower high or minor support).
Continuation to demand zone around $116, completing the projected bearish move.
Technical Interpretation:
This setup is a classic supply and demand reversal strategy.
Confirmation of the short setup may require:
A clear rejection candle at resistance.
Break of minor support levels on the way down.
Risk for bulls is high near resistance; short sellers may find opportunities targeting the demand zone.
NVDA Weekly Options Outlook — June 1, 2025📉 NVDA Weekly Options Outlook — June 1, 2025
🚨 AI Model Consensus: Lean Bearish Into 6/6 Expiry
🧠 Model Breakdown
🔹 Grok (xAI)
Bias: Short-term bullish (above 10/50 EMA on M5), but below 200 EMA.
Indicators: RSI ~63, MACD weakening on daily.
Sentiment: Falling VIX + AI buzz, but $133 max pain caps upside.
Trade: Buy $141C @ ~$0.94 → Target +50%, SL 50%
Confidence: 70%
🔹 Claude (Anthropic)
Bias: Slightly bullish.
Indicators: Price above 10EMA, below 200EMA; MACD weak, RSI neutral.
Sentiment: Call/put OI split, max pain $133.
Trade: Buy $140C @ $0.96 → Target +55–75%, SL $0.50
Confidence: 72%
🔹 Gemini (Google)
Bias: Bearish.
Indicators: Bearish MACD crossover; upper Bollinger rejection.
Sentiment: Positive news priced in.
Trade: Buy $128P @ $0.73 → Target +75–100%, SL 50%
Confidence: 65%
🔹 Llama (Meta)
Bias: Moderately bearish.
Indicators: MACD fading; under EMAs on M5.
Trade: Buy $133P → Target +50%, SL above $136.35
Confidence: 70%
🔹 DeepSeek
Bias: Bearish.
Indicators: MACD bearish crossover; momentum fading.
Trade: Buy $132P @ $1.65 → Target +100%, SL 50%
Confidence: 65%
✅ Consensus Takeaways
🎯 Max Pain: $133 is the focal level across all models.
🟢 VIX down; sentiment positive, but momentum fading.
📉 Daily MACD across models turning bearish.
⚠️ Bullish calls (Grok/Claude) vs. bearish puts (Gemini/Llama/DeepSeek).
🔍 Recommended Trade This Week
💡 Bearish Play: NVDA Weekly Put (Exp: 2025-06-06)
💵 Entry: $1.66
🎯 Target: $2.49 (+50%)
🛑 Stop: $0.83 (−50%)
🔢 Size: 1 contract
⏰ Entry Timing: Market open (Monday)
📈 Confidence: 65%
⚠️ Risks to Watch
🚀 AI catalyst could reverse thesis and rally price fast
⏳ Time decay will eat premium—move needed early
🕳️ Opening gaps could get filled fast—use limit orders
🔄 Max pain ≠ magnetic level—watch price action around $133 closely
📊 TRADE DETAILS (JSON)
json
Copy
Edit
{
"instrument": "NVDA",
"direction": "put",
"strike": 132.0,
"expiry": "2025-06-06",
"confidence": 0.65,
"profit_target": 2.49,
"stop_loss": 0.83,
"size": 1,
"entry_price": 1.66,
"entry_timing": "open",
"signal_publish_time": "2025-06-02 09:30:00 UTC-04:00"
}

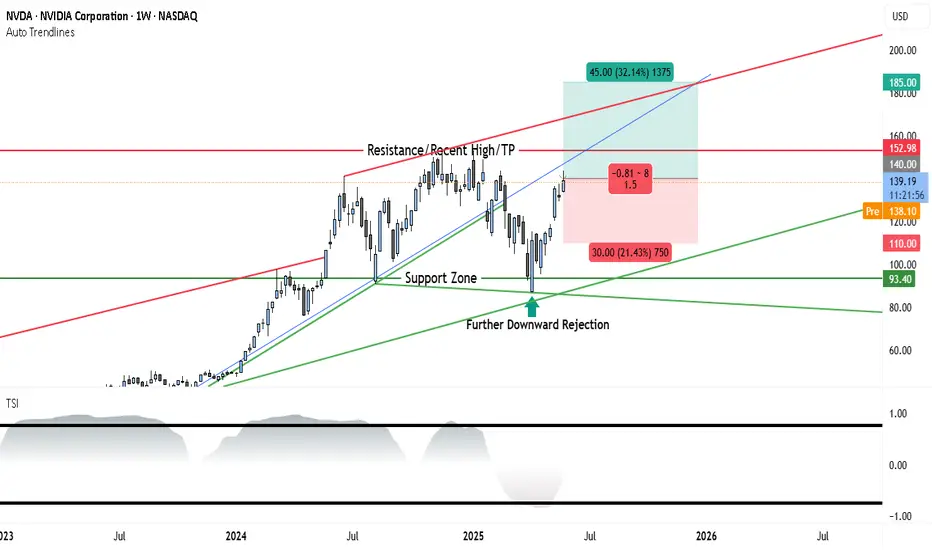
NVIDIA Stock Weekly Outlook: Support Holds Strong as $185 TargetThe weekly chart of NVDA shows a strong continuation pattern forming after a period of consolidation and a healthy pullback. The recent price action confirms a bullish stance, with a fresh bounce off support and momentum gradually shifting in favor of the bulls.
________________________________________
Long-Term Uptrend Confirmed
The blue ascending trendline drawn from early 2023 remains intact, showing that the overall trend is still bullish. NVDA has respected this trendline multiple times, with each touch followed by a renewed upward move. This week, the price rebounded once again near this trendline, confirming its role as dynamic support and signaling renewed buying interest.
________________________________________
Resistance and Breakout Potential
The key resistance level is marked at $152.98, which represents the recent weekly high and a psychological barrier. This level has acted as a ceiling in past attempts, but the current structure and momentum suggest a potential breakout if volume confirms. Above this level, there's clear air up to $185, where the next major resistance sits, and which also acts as the projected target in this trade setup.
________________________________________
Support Holding Strong
A strong support zone around $93.40 is clearly defined and has already triggered multiple rejections. NVDA recently saw a sharp bounce from this zone after a downward rejection, signaling that institutional buyers may be active here. This area is the foundation of the current bullish case.
________________________________________
Momentum Turning Favorably
The True Strength Index (TSI), shown at the bottom of the chart, is emerging from a low region. While not yet fully bullish, the indicator is starting to turn upward, suggesting early signs of momentum building. If TSI crosses above the midline in coming weeks, it could confirm the start of a sustained upward move.
________________________________________
Trade Setup
• Entry Zone: $138 to $140 (current price range)
• Stop-Loss: $110 (beneath the last significant swing low)
• Target: $185 (aligns with the next major resistance and top of risk-reward box)
• Risk-Reward Ratio: Approximately 1.5:1
• Setup Bias: Swing to mid-term bullish continuation
________________________________________
Conclusion
NVIDIA’s weekly chart is aligning in favor of the bulls after a healthy consolidation and support retest. The price remains within a strong uptrend channel, and momentum is gradually improving. A breakout above $152.98 would likely attract more volume and set the stage for a rally toward $185. The risk-reward setup is favorable, making this a strong candidate for bullish swing positioning heading into Q3 2025.
Nvidia Stock Price Rises Over 4% Following Earnings ReportNvidia (NVDA) Stock Price Rises Over 4% Following Earnings Report
Yesterday, after the main trading session, Nvidia released its quarterly earnings report, which exceeded analysts' expectations:
→ Earnings per share: actual = $0.81, forecast = $0.73
→ Revenue: actual = $44 billion, forecast = $43.3 billion
Additionally, according to media reports, Nvidia issued a strong forecast for the next period, although CEO Jensen Huang noted difficulties in accessing the Chinese market, which he estimates to be worth $50 billion.
Nevertheless, market participants reacted positively. According to Google, in after-hours trading the NVDA stock price rose by more than 4%, surpassing the $140 level.
It is reasonable to assume that this initial positive reaction could continue during today’s main trading session.
Technical Analysis of NVDA Chart
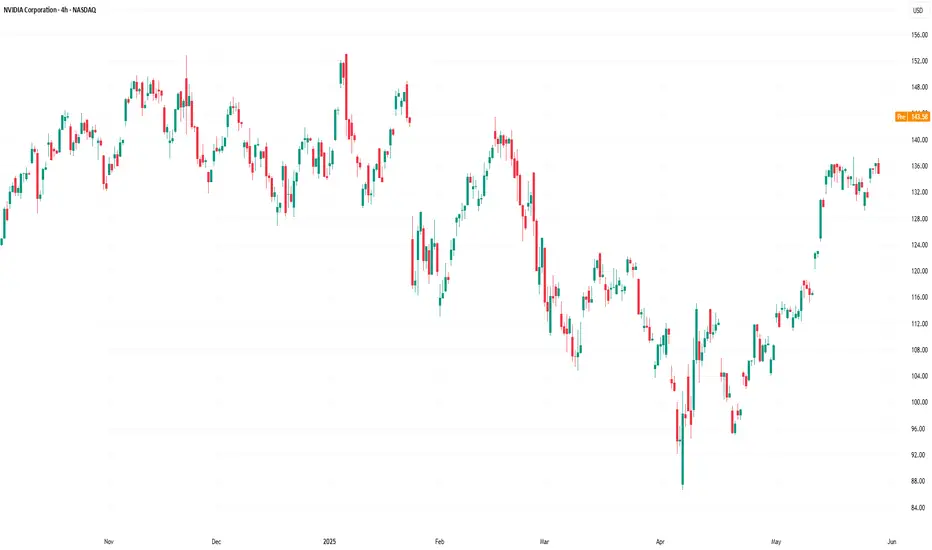
As we mentioned earlier this week, NVDA stock in 2025 has formed a broad descending channel (shown in red), and just before the earnings release, the price was consolidating near the upper boundary of this channel.
We also suggested a scenario in which the bulls might attempt to break through the upper boundary of the channel. Given the positive earnings report and the stock market rally following the Federal Court’s decision declaring Trump tariffs invalid, the likelihood of this scenario increases.
This, in turn, means that:
→ the upper boundary of the channel, once broken, may act as support;
→ we may once again see the key psychological resistance level of $150 come into play — a level we have highlighted multiple times before.
This article represents the opinion of the Companies operating under the FXOpen brand only. It is not to be construed as an offer, solicitation, or recommendation with respect to products and services provided by the Companies operating under the FXOpen brand, nor is it to be considered financial advice.
What’s Happening with Nvidia (NVDA) Ahead of Earnings?What’s Happening with Nvidia (NVDA) Ahead of Earnings?
After an extended weekend due to Veterans Day in the US (observed on Monday), financial markets are returning to active trading. The highlight of the week will be Nvidia’s (NVDA) earnings report, scheduled for Wednesday after the close of the main trading session.
What You Need to Know Ahead of Nvidia’s Earnings
According to media reports, market participants are concerned about:
→ escalating trade tensions between the US and China;
→ increasing competition;
→ Nvidia’s premium pricing at a time when the GPU market is shifting towards more affordable alternatives;
→ downward revisions to earnings per share, which some interpret as a sign that Nvidia’s report may fall short of expectations.
On the other hand, Reuters reports that Nvidia is set to unveil a new processor that:
→ is designed specifically for AI applications;
→ is based on the Blackwell architecture;
→ will not be subject to US export restrictions on chips sent to China;
→ is expected to be cost-effective.
Technical Analysis of Nvidia (NVDA) Stock
Today’s NVDA price chart suggests that the descending channel (marked in red) may be forming a large bullish flag — a continuation pattern that typically indicates a potential resumption of the uptrend after a corrective phase.
Price action in Nvidia stock has slowed near the upper boundary of the channel — a sign of temporary equilibrium between supply and demand (this could also be interpreted as traders adopting a wait-and-see stance ahead of the earnings release).
Given that the earnings report is a potentially strong price catalyst, a breakout from the bullish flag cannot be ruled out. Such a move could signal the start of a new phase in NVDA’s long-term upward trend (as indicated by the arrow on the chart).
This article represents the opinion of the Companies operating under the FXOpen brand only. It is not to be construed as an offer, solicitation, or recommendation with respect to products and services provided by the Companies operating under the FXOpen brand, nor is it to be considered financial advice.
