NVDA Weekly Trade Setup (2025-08-02)
### 🟢 NVDA Weekly Trade Setup (2025-08-02)
🚀 **BULLISH CONSENSUS** across 5 top-tier models
📉 Daily RSI: Weak — but weekly trend is STRONG
💼 Institutional Volume: Confirmed accumulation
📊 Options Flow: Call/Put leaning bullish
---
### 🎯 TRADE SETUP
**💥 Direction:** CALL (LONG)
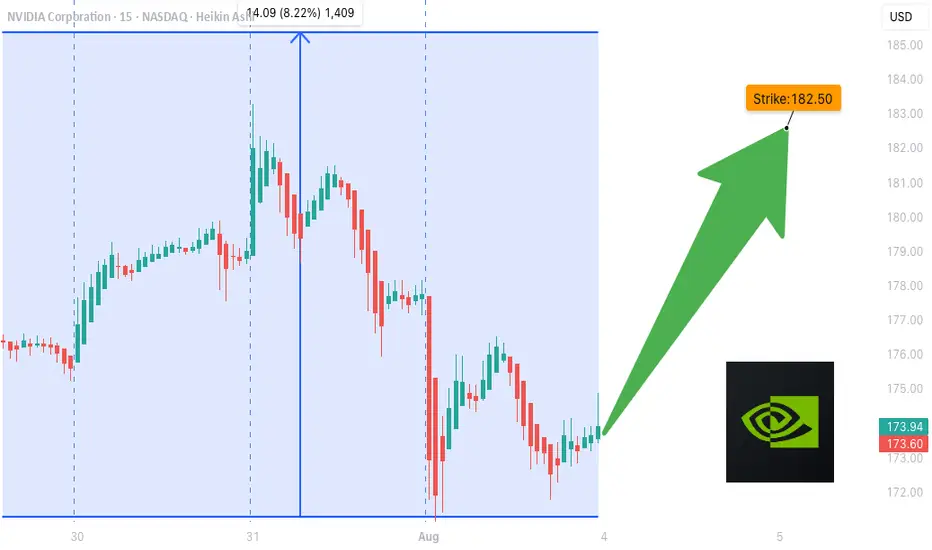
**📍 Strike:** \$182.50
**📅 Expiry:** 2025-08-08
**💵 Entry:** \$0.73
**🎯 Target:** \$1.46 (100% gain)
**🛑 Stop:** \$0.36 (50% risk cap)
**✅ Confidence:** 75%
**🕒 Entry Timing:** At market open
---
### 🧠 Model Breakdown:
✅ **Grok/xAI:** Weekly bullish, 4/5 signals green
✅ **DeepSeek:** Volume confirms; cautious on daily RSI
✅ **Google/Gemini:** Bullish weekly > bearish daily
✅ **Claude:** Weekly momentum + rising options flow
✅ **Meta/Llama:** All signals aligned for \$182.50 call
---
### ⚠️ Risk Watch:
* Falling Daily RSI = short-term drag risk
* Key Support: Watch for \$178 breakdown
* Earnings/events could spike volatility
---
### 📦 TRADE JSON (for tracking):
```json
{
"instrument": "NVDA",
"direction": "call",
"strike": 182.50,
"expiry": "2025-08-08",
"confidence": 0.75,
"profit_target": 1.46,
"stop_loss": 0.36,
"size": 1,
"entry_price": 0.73,
"entry_timing": "open",
"signal_publish_time": "2025-08-03 00:54:05 UTC-04:00"
}
```
---
🔥 *“Smart money is circling. Ride the wave, not the noise.”*
💬 Drop your thoughts below. Will NVDA break \$185 next week?
Nvda_long
NVDA Bullish Weekly Trade Setup** – 2025-07-29
📈 **NVDA Bullish Weekly Trade Setup** – 2025-07-29
🚀 *"Momentum meets money flow!"*
### 🔍 Market Snapshot:
* 💥 **Call/Put Ratio**: 2.47 → Bullish sentiment confirmed
* 🧠 **RSI**: Rising on Daily & Weekly → Momentum building
* 🔕 **Low VIX**: Favors call strategies (cheap premiums)
* ⚠️ **Caution**: Light volume = soft institutional backing
---
### 🔧 Recommended Options Trade:
**🟢 NVDA \$182.50 CALL (Exp: Aug 1)**
💰 *Entry*: \~\$0.53 (Mid)
📈 *Profit Target*: \$0.69 – \$1.06
🛑 *Stop Loss*: \$0.32
📆 *DTE*: 3 days
🔄 *Entry Timing*: Market Open
✅ *Confidence*: 75%
🔥 *Theta & Gamma Risk*: Elevated — manage position size!
---
### 💡 Why This Trade?
✅ RSI Strength across timeframes
✅ Flow favors upside
✅ Cheap premium in a low-volatility regime
🟡 Just watch that volume…
---
📊 **TRADE SNAPSHOT (JSON):**
```json
{
"instrument": "NVDA",
"direction": "call",
"strike": 182.50,
"expiry": "2025-08-01",
"confidence": 0.75,
"profit_target": 1.06,
"stop_loss": 0.32,
"size": 10,
"entry_price": 0.53,
"entry_timing": "open",
"signal_publish_time": "2025-07-29 11:59:10 UTC-04:00"
}
```
---
📣 **Taglines for Sharing:**
* "NVDA setup is 🔥—momentum + flow = GO!"
* "Gamma risk is real—but so is this profit window 💸"
* "Short-term sprint or fade? This call has range."

$NVDA - Resilience in ActionNASDAQ:NVDA
In my previous post (linked above) I noted the amount of macro upwards pressure NASDAQ:NVDA
Even with the market becoming leary of (or noticing other A.I. developer options), NASDAQ:NVDA still just makes the HARDWARE that these A.I. models are able to use and abuse in order to perform better. NASDAQ:NVDA will continue to create great hardware, and continually iterate on the items that will continue to make A.I. great.
My recommendation? Continue to hold, and buy at these lower levels. NASDAQ:NVDA will continue to rise.
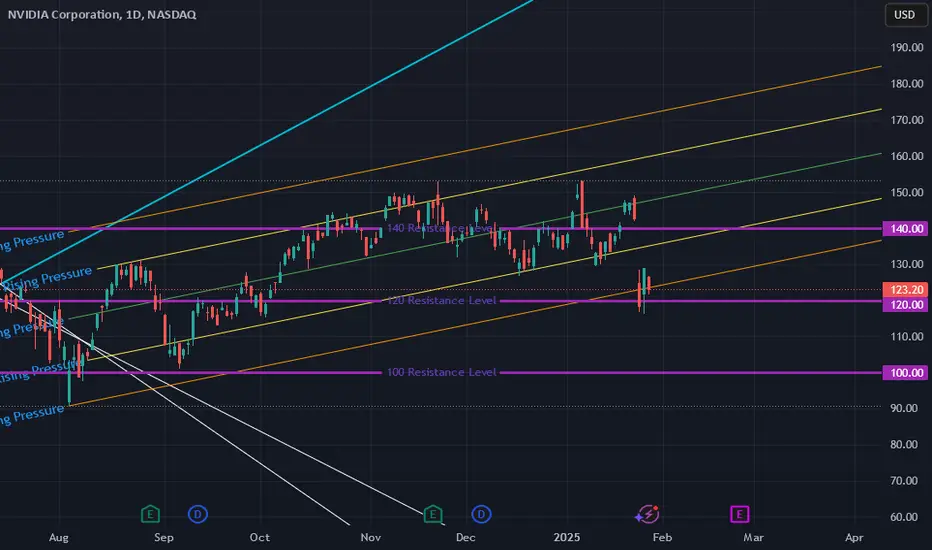
NVDA's Next Big Moves: Targeting 190, 175, 170! NVDA's on a wild ride, and here's where we might be heading. We're eying some exciting highs with targets at 190, 175, and 170 if we can break through 147. But, keep your seatbelts on because if the market doesn't hold up, we could be looking at a drop all the way down to 110, or even 98. Let's keep our fingers crossed for the highs but prepare for any dips.
Trade Smarter/ Live Better
Kris/ Mindbloome Exchange

NVDA Great ROI Trade To 150 Good morning Trading Family
The market corrected a bit deeper than expected however we got a correction lol
We have a great bullish opportunity from the 139.80 level to enter in so we go to the levels of 150 possibly beyond
I give you my reasoning on what I see and why
Mindbloome Trading
Trade What You See

NVDA HOURLY BULL FLAG Notice the momentum shifting to the upside with 4h Highs to takeout. 1h showing strength flagging post market, may be a good breath before price exhales at open tomorrow.

NVDA nice neckline support retest before upward movementSo the retest of the support at neckline was the ideal entry point. I think now its the way up from here. It should not retest that neckline again, else this idea will be invalidated.

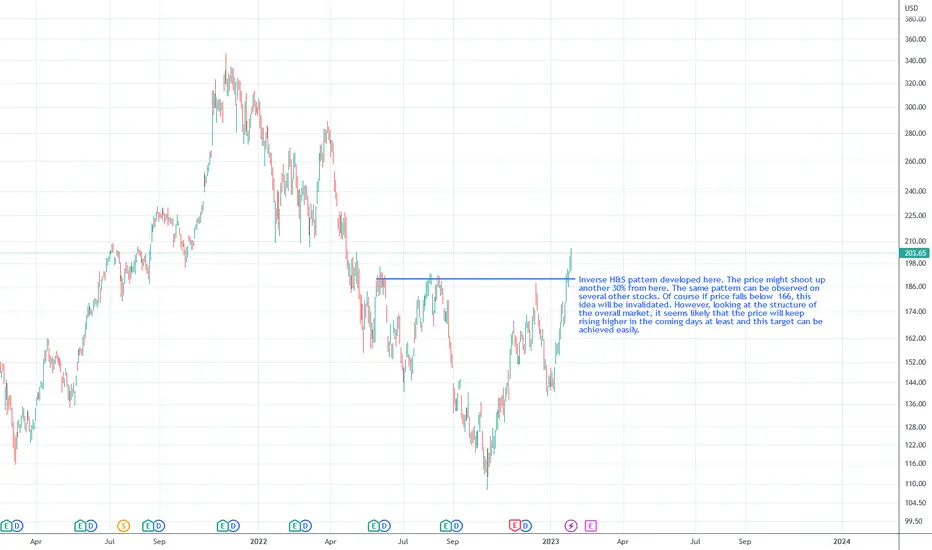
NVDA Iverse H&S Pattern and Market StructureInverse H&S pattern developed here. The price might shoot up another 30% from here. The same pattern can be observed on several other stocks.
Of course if price falls below 166, this idea will be invalidated. However, looking at the structure of the overall market, it seems likely that the price will keep rising higher in the coming days at least and this target can be achieved easily.