NVDA Bullish Weekly Trade Setup** – 2025-07-29
📈 **NVDA Bullish Weekly Trade Setup** – 2025-07-29
🚀 *"Momentum meets money flow!"*
### 🔍 Market Snapshot:
* 💥 **Call/Put Ratio**: 2.47 → Bullish sentiment confirmed
* 🧠 **RSI**: Rising on Daily & Weekly → Momentum building
* 🔕 **Low VIX**: Favors call strategies (cheap premiums)
* ⚠️ **Caution**: Light volume = soft institutional backing
---
### 🔧 Recommended Options Trade:
**🟢 NVDA \$182.50 CALL (Exp: Aug 1)**
💰 *Entry*: \~\$0.53 (Mid)
📈 *Profit Target*: \$0.69 – \$1.06
🛑 *Stop Loss*: \$0.32
📆 *DTE*: 3 days
🔄 *Entry Timing*: Market Open
✅ *Confidence*: 75%
🔥 *Theta & Gamma Risk*: Elevated — manage position size!
---
### 💡 Why This Trade?
✅ RSI Strength across timeframes
✅ Flow favors upside
✅ Cheap premium in a low-volatility regime
🟡 Just watch that volume…
---
📊 **TRADE SNAPSHOT (JSON):**
```json
{
"instrument": "NVDA",
"direction": "call",
"strike": 182.50,
"expiry": "2025-08-01",
"confidence": 0.75,
"profit_target": 1.06,
"stop_loss": 0.32,
"size": 10,
"entry_price": 0.53,
"entry_timing": "open",
"signal_publish_time": "2025-07-29 11:59:10 UTC-04:00"
}
```
---
📣 **Taglines for Sharing:**
* "NVDA setup is 🔥—momentum + flow = GO!"
* "Gamma risk is real—but so is this profit window 💸"
* "Short-term sprint or fade? This call has range."
Nvdaanalysis

NVDA 0DTE TRADE SIGNAL – JULY 25, 2025
⚡ NVDA 0DTE TRADE SIGNAL – JULY 25, 2025 ⚡
🚀 Strong Bullish Momentum – But Friday Expiration = Gamma Trap?
⸻
📊 Market Stats:
• 💰 Call Volume: Strong
• 🔻 Weak Volume Overall
• ⚖️ Call/Put Ratio: Bullish
• 📈 RSI: Overbought but still pushing
• ⏳ Time Decay: Accelerating
• ☠️ Gamma Risk: 🔥 MAX today (0DTE)
⸻
🧠 Model Summary:
• Grok/xAI: 🔒 NO TRADE today – wait for Monday
• Claude: 🛑 Caution – avoid entries today
• DeepSeek: ⏸️ 4/5 Bullish, wait for cleaner setup
• Gemini: 💡 Suggests $180C next week
• Llama: ✅ Bullish bias, but gamma risk = no go for Friday
⸻
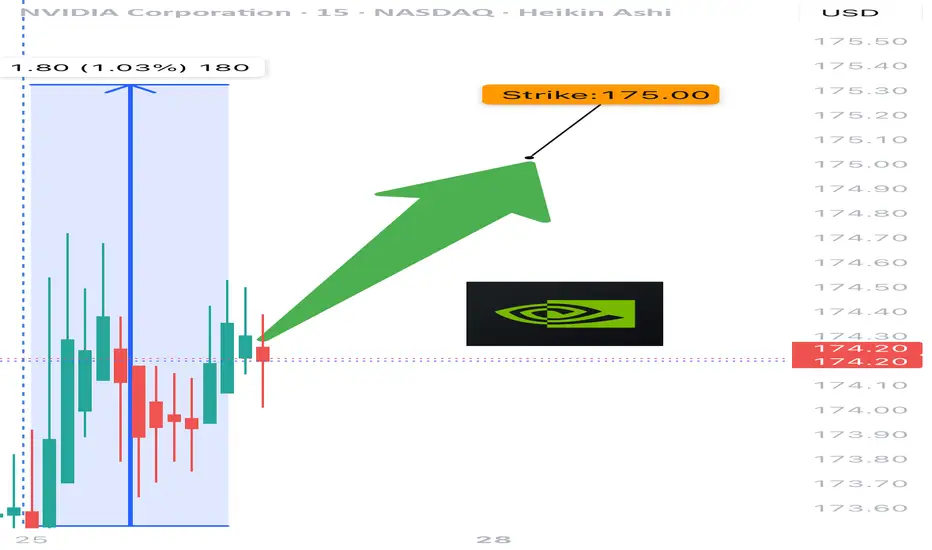
📌 TRADE IDEA: Wait for Monday
📍 Strike: $175 Call
📆 Expiry: Today (0DTE)
💵 Entry Price: $0.56
🎯 Target: $0.95
🛑 Stop: $0.30
📈 Confidence: 65%
🕒 Entry Timing: Monday open IF support holds
⸻
⚠️ Key Warning:
Don’t get trapped by 0DTE gamma swings. Momentum says yes, time decay says no…
✅ Best move? Watch NVDA closely, then strike on Monday if volume confirms.
⸻
👍 Like & save if you’re tracking NVDA.
🔁 Repost if you’re waiting for the perfect Monday setup!
#NVDA #OptionsTrading #0DTE #GammaRisk #BullishSetup #TradingView #TechStocks #WeeklyOptions
Fundamental and technical analysis on NVDA (Chicken Nugget) soonFundamental Analysis
NVIDIA Corporation (NVDA) remains a key player in the tech sector, benefiting from the rise of artificial intelligence, data centers, and gaming. With sustained growth, constant innovation, and strong demand for its graphics chips, the company continues to deliver solid financial results.
Recent reports indicate revenue growth and expansion in key markets. Product diversification, particularly in supercomputers and embedded systems, strengthens NVDA’s position against competitors. Investor interest in the semiconductor industry helps maintain the stock’s positive momentum.
Technical Analysis
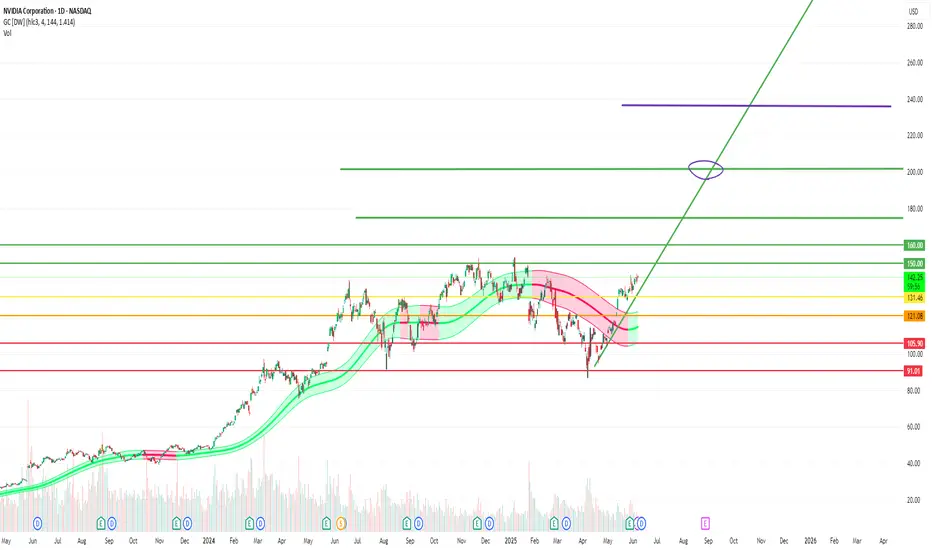
The chart analysis highlights key technical levels for investors:
- Key Resistance: $150 USD – This level must be broken to confirm a strong bullish trend. A breakout with volume could signal a gradual rise toward higher targets.
- Support Level: $131.50 USD – Strong demand and low supply are identified at this level, making it an excellent entry point for investors looking for buying opportunities before a potential rebound.
Targets & Strategy
- Short-term target (late June/early July): The target range of $170-$175 USD is possible if the bullish trend is confirmed. This level aligns with technical extensions and favorable market dynamics.
- July buyback (-5% to -10%): A moderate correction could occur, offering another buying opportunity before an upward recovery.
- Selling target (September to November): The next selling target is between $200-$240 USD, depending on market developments and investor sentiment.
Conclusion
NVDA stock presents interesting prospects, with well-defined technical levels and a strong fundamental outlook. Investors should monitor these thresholds to adjust their strategy based on market fluctuations.
If you want to refine this analysis or explore other scenarios, I'm here to dive deeper into key points! 🚀 Subscribe! TSXGanG
I hold a CCVM and MNC (Certificate of Competence to become a securities broker anywhere in Canada) and have been working as a trader for five years.
It’s a pleasure for me to help people optimize their trading strategies and make informed financial market decisions.
NVIDIA & xAI’s Grok 3: A Game-Changer or Overhyped AI Play?NVIDIA’s stock ( NASDAQ:NVDA ) has been on an unstoppable rally, driven by the AI boom. Now, with Elon Musk’s xAI set to launch Grok 3 —trained on an impressive 100,000 NVIDIA H100 GPUs —the market is buzzing with speculation. Could this be the catalyst that propels NVDA to the next level, or are we approaching an AI-driven valuation bubble?
Key Developments :
Massive GPU Demand : xAI’s Grok 3 will utilize a staggering 100,000 H100 GPUs, reinforcing NVIDIA’s dominance in AI hardware and boosting its market position.
Supercomputer Expansion : Musk’s team is building one of the most powerful AI training clusters in Memphis, Tennessee. This development could significantly increase NVIDIA’s long-term revenue streams, given its key role in powering these systems.
Release Date : Grok 3 is set to launch today, February 17, 2025(4 AM GMT) , with a live demonstration, which may influence sentiment around AI-related stocks, especially NVIDIA.
Market Sentiment & Risks : While these developments seem bullish for NVIDIA, some analysts, including hedge funds like Elliott Investment Management, have raised concerns over the potential for overvaluation as the AI euphoria spreads.
Conclusion: Grok 3’s launch will be a pivotal moment, with NVIDIA at the heart of the AI revolution. Whether this sparks a fresh rally or raises concerns about an AI bubble remains to be seen.
------------------------------------------------------------------------------
Now, let's use Technical Analysis to analyze NVIDIA stock(NVDA) .
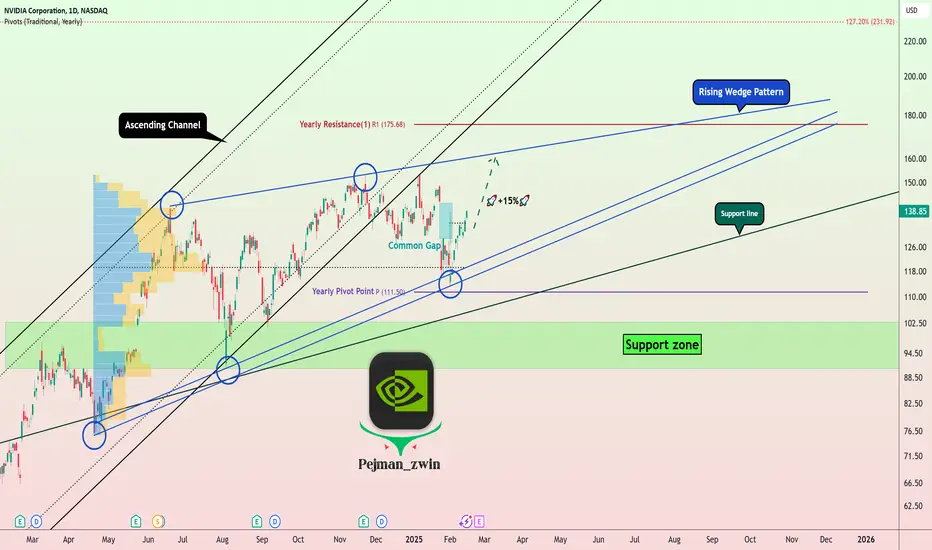
In terms of technical analysis, the loss of an Ascending Channel is not good news for any asset and is a sign of weakness in the upward trend . This has happened to the NVIDIA stock(NVDA) .
From the point of view of Classical Technical Analysis , it seems that NVIDIA stock is completing the Rising Wedge Pattern .
Educational tip : The Rising Wedge Pattern is a bearish reversal or continuation pattern characterized by converging upward-sloping trendlines. It signals weakening bullish momentum, often leading to a breakdown below support. A confirmed breakout to the downside indicates a potential price decline.
I expect the launch of Grok 3 Artificial Intelligence(AI) can increase at least +10%+15% of NVIDIA stock(NVDA) . If the upper line of the Rising Wedge Pattern breaks , we can expect a further increase [ the next target can be Yearly Resistance(1=$175.68)(in case of breaking) ].
What’s your take? Drop your thoughts about NVIDIA in the comments! 👇
Be sure to follow the updated ideas.
NVIDIA Analyze (NVDAUSD), Daily time frame.
Do not forget to put Stop loss for your positions (For every position you want to open).
Please follow your strategy; this is just my idea, and I will gladly see your ideas in this post.
Please do not forget the ✅' like '✅ button 🙏😊 & Share it with your friends; thanks, and Trade safe.
NVDA making its way to retest a previous CHOCHHi Traders!
I'm waiting patiently on NVDA. It broke through a 4HR Bullish OB, and now It's making its way down to retest that breaker OB area. However, If it keeps breaking down past 136.00, then the 4HR CHOCH would become invalid. I have 2 alerts set- 1 at 140.50, and 136.50. These are potential areas where there could be a reversal. Price likes to test previous CHOCH patterns, so watching closely for the best possible entry if the chart presents itself that way.
If the reversal happens and continues to move up, I'm looking for price to break 150 since tapping that area a few times already. Lets see what we can get🤞
*DISCLAIMER: I am not a financial advisor. The ideas and trades I take on my page are for educational and entertainment purposes only. I'm just showing you guys how I trade. Remember, trading of any kind involves risk. Your investments are solely your responsibility and not mine.*

$NVDA NVIDIA AFTER CES: REALITY KICKS IN AFTER ATH | JAN08'25NASDAQ:NVDA NVIDIA AFTER CES: REALITY KICKS IN AFTER ATH | JAN08'25
NASDAQ:NVDA BUY/LONG ZONE (GREEN): $140.00 - $153.00
NASDAQ:NVDA DO NOT TRADE/DNT ZONE (WHITE): $136.00 - $140.00
NASDAQ:NVDA SELL/SHORT ZONE (RED): $127.00 - $136.00
NASDAQ:NVDA Trends:
NASDAQ:NVDA Weekly Trend: Bullish
NASDAQ:NVDA Daily Trend: Bullish
NASDAQ:NVDA 4H Trend: Bearish
NASDAQ:NVDA 1H Trend: Bearish
At CES 2025, NASDAQ:NVDA unveiled a series of groundbreaking announcements, including the RTX 50 series GPUs and the Cosmos AI platform, aimed at robotics and autonomous vehicles. This led to an immediate surge in NASDAQ:NVDA 's stock price, hitting new all-time highs and reaching the top of my previous bullish zone. However, the excitement didn't last, with the stock experiencing a significant pullback shortly after.
I will link below my previous NASDAQ:NVDA analyses, along with my NASDAQ:SMCI analysis and NASDAQ:AMD analysis!
This is what I would personally look at before entering trades, everything is subject to change on a daily basis and as I analyze different timeframes and ideas.
ENTERTAINMENT PURPOSES ONLY, NOT FINANCIAL ADVICE!
trendanalysis, trendtrading, priceaction, priceactiontrading, technicalindicators, supportandresistance, rangebreakout, rangebreakdown, rangetrading, chartpatterntrading, chartpatterns, spy, sp500, s&p, fed, federalreserve, fedrate, fedratecut, interestrate, jeromepowell, fedchair, 50bps, volatile, volatility, nvidia, nvidiapricetarget, nvdatrend, nvidiatrend, nvdasetup, nvidialongs, nvidiashorts, chipmakers, smci, amd, supermicro, advancedmicro, chipmakertrends, newchipmakers, trilliondollarchipmakers, nvidiaproducts, nvidiachips, nvdachips, nvdatrend, nvdaprice, nvidiaprice, nvidiaanalysis, nvidiasetups, nvdaideas, ces, cesevent, cesnvda, cesnvidia, ces2025, cesamd, cessmci, cesrtx50, rtx50, gpus, cosmosai, newai, aitrends, newaiindustries, nvdaproducts, nvdartx, jensenhuang, nvdaceo, nvdajensenhuang, nvdaoptions, amdsmcinvda,
