NVDA Bullish Weekly Trade Setup** – 2025-07-29
📈 **NVDA Bullish Weekly Trade Setup** – 2025-07-29
🚀 *"Momentum meets money flow!"*
### 🔍 Market Snapshot:
* 💥 **Call/Put Ratio**: 2.47 → Bullish sentiment confirmed
* 🧠 **RSI**: Rising on Daily & Weekly → Momentum building
* 🔕 **Low VIX**: Favors call strategies (cheap premiums)
* ⚠️ **Caution**: Light volume = soft institutional backing
---
### 🔧 Recommended Options Trade:
**🟢 NVDA \$182.50 CALL (Exp: Aug 1)**
💰 *Entry*: \~\$0.53 (Mid)
📈 *Profit Target*: \$0.69 – \$1.06
🛑 *Stop Loss*: \$0.32
📆 *DTE*: 3 days
🔄 *Entry Timing*: Market Open
✅ *Confidence*: 75%
🔥 *Theta & Gamma Risk*: Elevated — manage position size!
---
### 💡 Why This Trade?
✅ RSI Strength across timeframes
✅ Flow favors upside
✅ Cheap premium in a low-volatility regime
🟡 Just watch that volume…
---
📊 **TRADE SNAPSHOT (JSON):**
```json
{
"instrument": "NVDA",
"direction": "call",
"strike": 182.50,
"expiry": "2025-08-01",
"confidence": 0.75,
"profit_target": 1.06,
"stop_loss": 0.32,
"size": 10,
"entry_price": 0.53,
"entry_timing": "open",
"signal_publish_time": "2025-07-29 11:59:10 UTC-04:00"
}
```
---
📣 **Taglines for Sharing:**
* "NVDA setup is 🔥—momentum + flow = GO!"
* "Gamma risk is real—but so is this profit window 💸"
* "Short-term sprint or fade? This call has range."
Nvdabuy

NVDA 0DTE TRADE SIGNAL – JULY 25, 2025
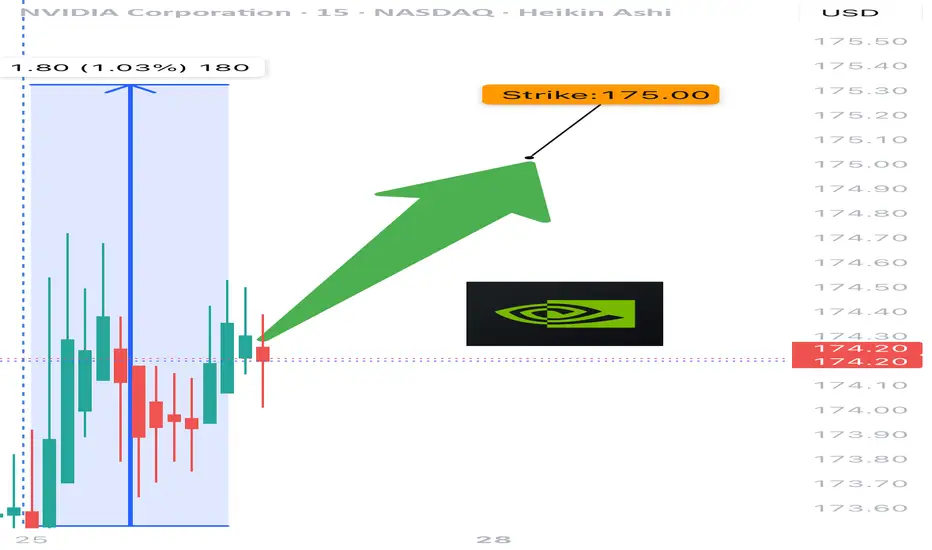
⚡ NVDA 0DTE TRADE SIGNAL – JULY 25, 2025 ⚡
🚀 Strong Bullish Momentum – But Friday Expiration = Gamma Trap?
⸻
📊 Market Stats:
• 💰 Call Volume: Strong
• 🔻 Weak Volume Overall
• ⚖️ Call/Put Ratio: Bullish
• 📈 RSI: Overbought but still pushing
• ⏳ Time Decay: Accelerating
• ☠️ Gamma Risk: 🔥 MAX today (0DTE)
⸻
🧠 Model Summary:
• Grok/xAI: 🔒 NO TRADE today – wait for Monday
• Claude: 🛑 Caution – avoid entries today
• DeepSeek: ⏸️ 4/5 Bullish, wait for cleaner setup
• Gemini: 💡 Suggests $180C next week
• Llama: ✅ Bullish bias, but gamma risk = no go for Friday
⸻
📌 TRADE IDEA: Wait for Monday
📍 Strike: $175 Call
📆 Expiry: Today (0DTE)
💵 Entry Price: $0.56
🎯 Target: $0.95
🛑 Stop: $0.30
📈 Confidence: 65%
🕒 Entry Timing: Monday open IF support holds
⸻
⚠️ Key Warning:
Don’t get trapped by 0DTE gamma swings. Momentum says yes, time decay says no…
✅ Best move? Watch NVDA closely, then strike on Monday if volume confirms.
⸻
👍 Like & save if you’re tracking NVDA.
🔁 Repost if you’re waiting for the perfect Monday setup!
#NVDA #OptionsTrading #0DTE #GammaRisk #BullishSetup #TradingView #TechStocks #WeeklyOptions
$NVDA WEEKLY TRADE IDEA – JULY 21, 2025
💥 NASDAQ:NVDA WEEKLY TRADE IDEA – JULY 21, 2025 💥
🔥 Bullish Options Flow + Weekly RSI Strength = Controlled Momentum Play
⸻
📊 Trade Details
🔹 Type: Long Call
🎯 Strike: $180.00
📆 Expiry: July 25, 2025 (4DTE)
💰 Entry: $0.51
🎯 Target: $1.02 (💯% Gain)
🛑 Stop: $0.20 (~40% Risk)
📈 Confidence: 65%
🕰️ Timing: Monday Open
📦 Size: 1 Contract (Adjust based on risk tolerance)
⸻
📈 Why This Trade?
✅ Call/Put Ratio = 1.48 → Bullish bias confirmed
📈 Weekly RSI = 77.0 → Strong momentum
🔻 Daily RSI = 80.8 (falling) → Short-term pullback risk
📉 Volume = flat (1.0x) → Weak confirmation = tighter risk mgmt
🧠 Strike Clustering: $177.50 & $180 = strong OI zones
🌬️ VIX = 16.7 → Favorable for long premium plays
⸻
⚠️ Risks & Strategy Notes
❗ Daily RSI = caution: short-term exhaustion possible
📉 Weak volume = lack of institutional chase
⏳ Exit before Friday – avoid IV crush and gamma slam
🔐 Set alerts at $178.75 and $179.80 – pre-breakout signals
⸻
🎯 Plan:
• Enter Monday open
• Scale partials if price hits +30–50%
• Full exit by Thursday unless price is breaking through $180 early with strong volume
⸻
🏁 Quick Verdict:
This is a momentum continuation setup, not a fresh breakout.
Play the trend, respect RSI signals, and cut fast if flow dries up.
NASDAQ:NVDA 180C — Risk $0.20 to Target $1.02
Let the call ride… just don’t overstay.
⸻
#NVDA #OptionsTrading #CallOption #WeeklyPlay #MomentumTrade #FlowBasedSetup #TradingViewIdeas #GammaPlay #BullishBias #NVIDIA

Fundamental and technical analysis on NVDA (Chicken Nugget) soonFundamental Analysis
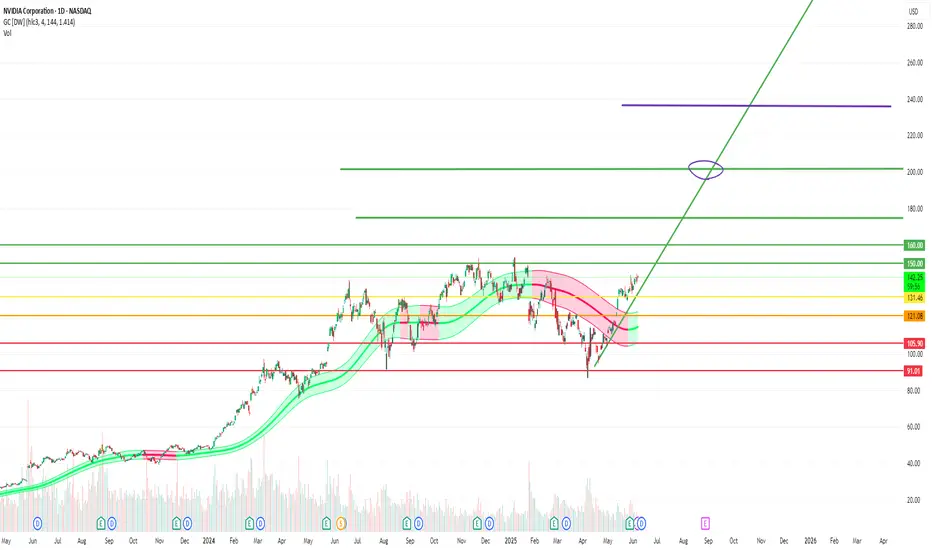
NVIDIA Corporation (NVDA) remains a key player in the tech sector, benefiting from the rise of artificial intelligence, data centers, and gaming. With sustained growth, constant innovation, and strong demand for its graphics chips, the company continues to deliver solid financial results.
Recent reports indicate revenue growth and expansion in key markets. Product diversification, particularly in supercomputers and embedded systems, strengthens NVDA’s position against competitors. Investor interest in the semiconductor industry helps maintain the stock’s positive momentum.
Technical Analysis
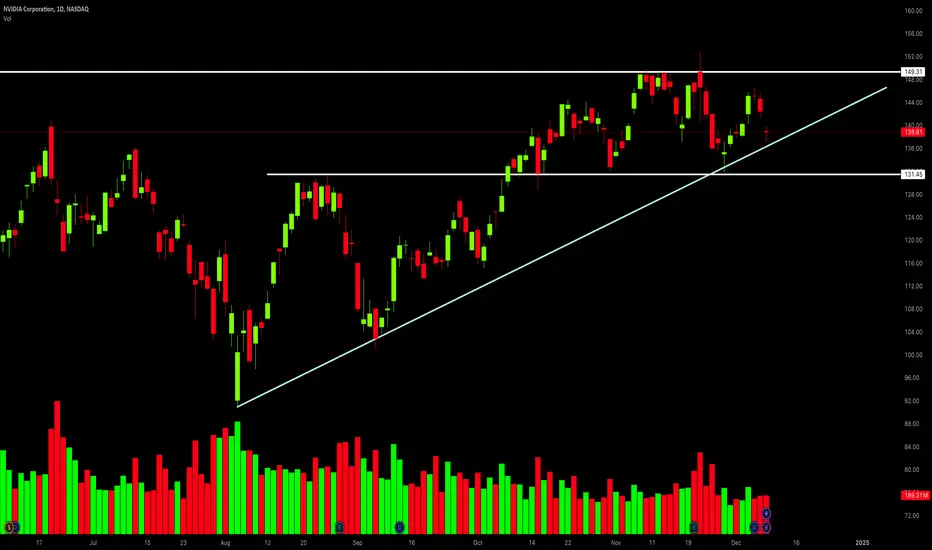
The chart analysis highlights key technical levels for investors:
- Key Resistance: $150 USD – This level must be broken to confirm a strong bullish trend. A breakout with volume could signal a gradual rise toward higher targets.
- Support Level: $131.50 USD – Strong demand and low supply are identified at this level, making it an excellent entry point for investors looking for buying opportunities before a potential rebound.
Targets & Strategy
- Short-term target (late June/early July): The target range of $170-$175 USD is possible if the bullish trend is confirmed. This level aligns with technical extensions and favorable market dynamics.
- July buyback (-5% to -10%): A moderate correction could occur, offering another buying opportunity before an upward recovery.
- Selling target (September to November): The next selling target is between $200-$240 USD, depending on market developments and investor sentiment.
Conclusion
NVDA stock presents interesting prospects, with well-defined technical levels and a strong fundamental outlook. Investors should monitor these thresholds to adjust their strategy based on market fluctuations.
If you want to refine this analysis or explore other scenarios, I'm here to dive deeper into key points! 🚀 Subscribe! TSXGanG
I hold a CCVM and MNC (Certificate of Competence to become a securities broker anywhere in Canada) and have been working as a trader for five years.
It’s a pleasure for me to help people optimize their trading strategies and make informed financial market decisions.
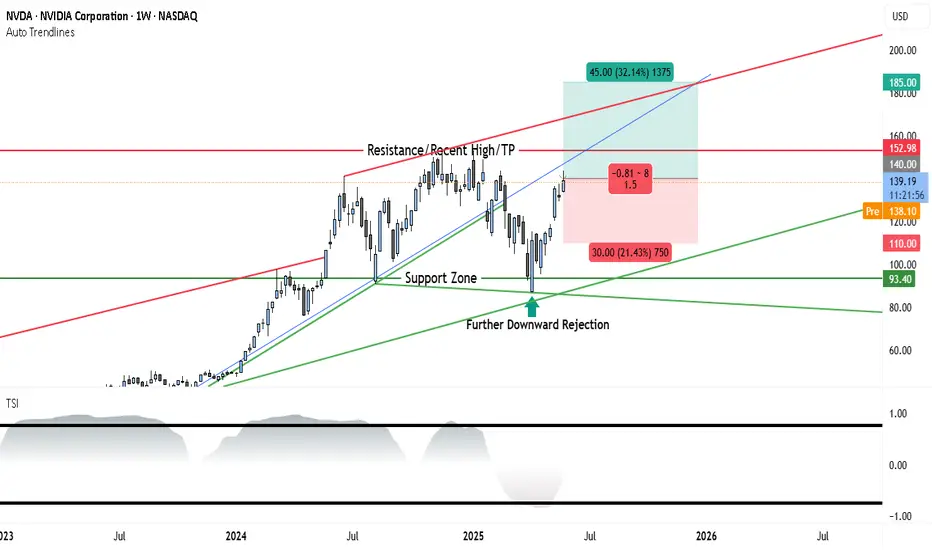
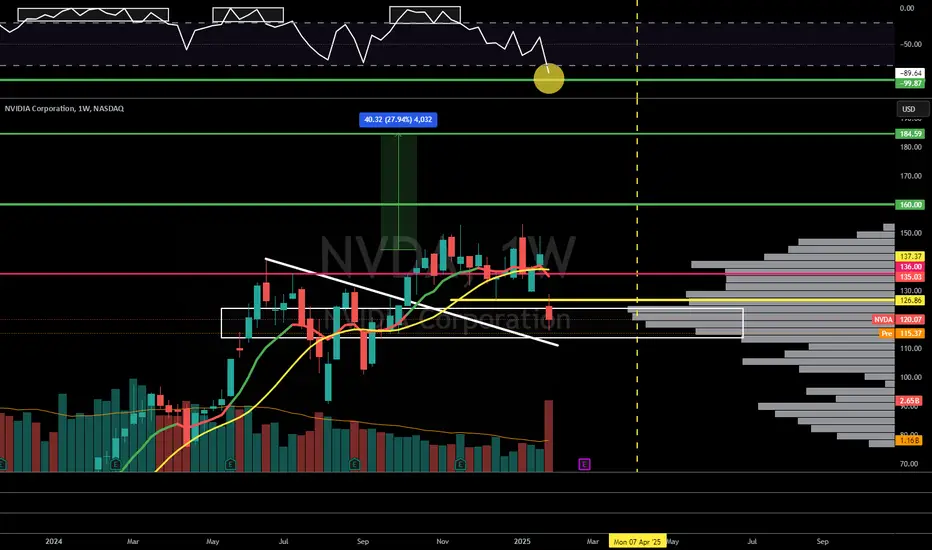
NVIDIA Stock Weekly Outlook: Support Holds Strong as $185 TargetThe weekly chart of NVDA shows a strong continuation pattern forming after a period of consolidation and a healthy pullback. The recent price action confirms a bullish stance, with a fresh bounce off support and momentum gradually shifting in favor of the bulls.
________________________________________
Long-Term Uptrend Confirmed
The blue ascending trendline drawn from early 2023 remains intact, showing that the overall trend is still bullish. NVDA has respected this trendline multiple times, with each touch followed by a renewed upward move. This week, the price rebounded once again near this trendline, confirming its role as dynamic support and signaling renewed buying interest.
________________________________________
Resistance and Breakout Potential
The key resistance level is marked at $152.98, which represents the recent weekly high and a psychological barrier. This level has acted as a ceiling in past attempts, but the current structure and momentum suggest a potential breakout if volume confirms. Above this level, there's clear air up to $185, where the next major resistance sits, and which also acts as the projected target in this trade setup.
________________________________________
Support Holding Strong
A strong support zone around $93.40 is clearly defined and has already triggered multiple rejections. NVDA recently saw a sharp bounce from this zone after a downward rejection, signaling that institutional buyers may be active here. This area is the foundation of the current bullish case.
________________________________________
Momentum Turning Favorably
The True Strength Index (TSI), shown at the bottom of the chart, is emerging from a low region. While not yet fully bullish, the indicator is starting to turn upward, suggesting early signs of momentum building. If TSI crosses above the midline in coming weeks, it could confirm the start of a sustained upward move.
________________________________________
Trade Setup
• Entry Zone: $138 to $140 (current price range)
• Stop-Loss: $110 (beneath the last significant swing low)
• Target: $185 (aligns with the next major resistance and top of risk-reward box)
• Risk-Reward Ratio: Approximately 1.5:1
• Setup Bias: Swing to mid-term bullish continuation
________________________________________
Conclusion
NVIDIA’s weekly chart is aligning in favor of the bulls after a healthy consolidation and support retest. The price remains within a strong uptrend channel, and momentum is gradually improving. A breakout above $152.98 would likely attract more volume and set the stage for a rally toward $185. The risk-reward setup is favorable, making this a strong candidate for bullish swing positioning heading into Q3 2025.
$NVDA: Full on Bull mode. 170 $ before end of Summer Happy Monday. A new week, new trade for you guys. How does the largest AI stock looks like today with US-China Tariff pause for 90 days behave? Today the stock NASDAQ:NVDA broke the 1.0 Upward sloping Fib retracement channel with which we have been working for months now. The stock opened @ 122 % which is the 1.0 Fib retracement level. If we extend the channel and extrapolate then we see the next levels and the resistance levels.
In our Fib Chart here the next level is 1.6 Level which is @ 137 $. In my opinion with RSI at 50 and NASDAQ:NVDA having some high level of short interest. 1.12 % of the float is short which is high going back to 2021 bear market. So, this helps have violent short covering rally in the short term. Bullish before we turn bearish. RSI may top out at 85 in this bull rally phase. This cycle bull r un can take it to 170$ before end of Summer 2025.
Verdict : NASDAQ:NVDA next levels : 135 $ ; cycle top @ 170 $.
NVDA TO $176 BY JUNE THEN $1000 END OF YEARNVDA to $176 by June Then $1000 End of Year: A Bold Thesis
Key Points
It seems likely that NVDA could reach $176 by June 2025, supported by strong AI market trends and upcoming earnings, but reaching $1000 by year-end is highly speculative and controversial.
Research suggests Elliott Wave analysis shows a potential bullish trend, but specific price targets like $1000 lack broad analyst support.
The evidence leans toward significant growth potential due to NVDA's leadership in AI and new product launches, yet such aggressive targets involve high uncertainty.
Current Price and Market Context
As of April 9, 2025, NVDA's closing price on April 8 was $96.30, with pre-market trading at $98.22. This reflects recent volatility, with a 52-week range from $75.61 to $153.13. The stock's performance is tied to its dominance in AI and GPU markets, which are experiencing robust growth.
Analysis for $176 by June
Reaching $176 by June 2025, an 83% increase from $96.30, is ambitious but plausible. Upcoming earnings on May 28, 2025, estimate an EPS of $0.93 and revenue of $43.34 billion, with potential beats driving price surges. Elliott Wave analysis suggests NVDA may be completing a corrective phase, with a falling wedge pattern indicating a possible upward breakout, supporting short-term targets around $176.
Analysis for $1000 by Year-End
The prediction of $1000 by December 2025, a 940% increase, is highly speculative. While some analyses, like a Forbes article, suggest NVDA could see a tenfold rise by 2026 due to the Blackwell architecture, most analyst targets range from $170 to $235. This target lacks broad support and involves significant market and fundamental risks.
Unexpected Detail: Stock Split Impact
An unexpected factor is NVDA's 10-for-1 stock split in June 2024, adjusting prices from over $1,000 to current levels, making historical comparisons complex. This split aligns the $1000 target with post-split valuations, but achieving it requires unprecedented growth.
Survey Note: Detailed Analysis of NVDA's Potential Price Surge to $176 by June and $1000 by Year-End
Introduction
NVIDIA Corporation (NVDA), a leader in graphics processing units (GPUs) and artificial intelligence (AI), is currently trading at approximately $96.30 as of April 9, 2025, based on the closing price from April 8, with pre-market activity showing a slight uptick to $98.22. This analysis explores the feasibility of NVDA reaching $176 by June 2025 and an ambitious $1000 by the end of the year, leveraging Elliott Wave theory and other validated analytical methods. Given the stock's recent performance and market context, we examine technical patterns, fundamental catalysts, and long-term growth potential.
Current Market Position and Historical Context
NVDA's stock has shown volatility, with a 52-week range from $75.61 to $153.13, and a year-to-date change of -11.36% over the past week and -12.23% over the past month, per recent data. The all-time high was $153.13 on January 6, 2025, indicating significant upside potential from current levels. The market capitalization stands at $2.35 trillion, with a beta of 2.40, reflecting high volatility. Key financial metrics include an EBITDA of $83.32 billion and an EBITDA margin of 63.85%, underscoring strong profitability.
A critical context is the 10-for-1 stock split in June 2024, which adjusted share prices from over $1,000 to current levels, making historical comparisons complex. This split, detailed in a CNBC article (Nvidia announces 10-for-1 stock split), was aimed at making ownership more accessible, aligning with the user's post-split price targets of $176 and $1000.
Metric Value
Closing Price (Apr 8) $96.30 USD
Pre-Market Price (Apr 9) $98.22 USD
52-Week Range $75.61 - $153.13 USD
Market Cap $2.35T USD
Beta (1Y) 2.40
Earnings Next Report May 28, 2025, EPS Estimate $0.93, Revenue Estimate $43.34B USD
Last Quarter EPS $0.89 (estimated $0.85, +4.96% surprise)
Dividend Yield (TTM) 0.04%
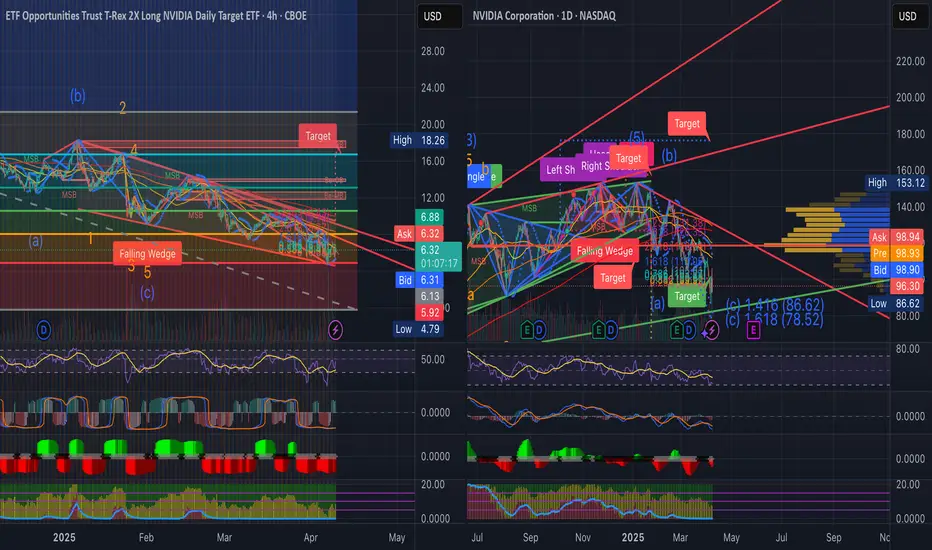
Elliott Wave Analysis: Technical Insights
Elliott Wave theory, a method identifying market psychology through wave patterns, suggests NVDA may be in a corrective phase, potentially completing wave (4) of a larger five-wave structure. Recent analyses, such as those on TradingView (NVIDIA Stock Chart), indicate a falling wedge or ending diagonal formation, often signaling a reversal and start of an upward trend. This could support a move to $176 by June, as wave (5) projections often extend to 1.618 times wave (1), potentially aligning with such targets.
Specific Elliott Wave analyses, like those from ElliottWave-Forecast (Elliott Wave Expects New All Time High), suggest NVDA has completed corrections and is resuming higher, with wave counts indicating impulsive rallies. However, these analyses lack explicit price targets reaching $1000, focusing more on trend continuations.
Short-Term Target: $176 by June 2025
Reaching $176 by June 2025, an 83% increase from $96.30, is ambitious but supported by several factors. The earnings report on May 28, 2025, is a critical catalyst, with estimates for EPS at $0.93 and revenue at $43.34 billion. Given NVDA's history of beating estimates, as seen in the last quarter with EPS of $0.89 against an estimate of $0.85, a strong report could drive significant price appreciation.
Technical indicators, such as a breakout from the falling wedge, align with this target. Analyst price targets, ranging from $125 to $220 with an average of $177.19 per Zacks (NVIDIA Price Target), also support the possibility, with some forecasts reaching $235.92 (NVDA Forecast). However, achieving this in two months requires sustained bullish momentum and favorable market conditions.
Long-Term Target: $1000 by Year-End 2025
The prediction of $1000 by December 2025, a 940% increase from current levels, is highly speculative. Most analyst forecasts, such as those from MarketBeat (NVIDIA Stock Forecast) and TipRanks (Nvidia Stock Forecast), range from $170 to $235, far below $1000. However, a Forbes article from May 25, 2024 (Nvidia Stock Tops $1,000), suggests NVDA could see a tenfold rise by 2026 due to the Blackwell architecture, potentially supporting a $1000 target by late 2025 if growth accelerates.
Blackwell, a new GPU architecture, is expected to enhance NVDA's AI and data center offerings, potentially driving revenue growth. CoinCodex forecasts a high of $260.32 by December 2025 (NVIDIA Stock Forecast), still below $1000, indicating the target is outlier and involves significant risk. Market volatility, competition, and macroeconomic factors, such as tariff impacts noted in CNN reports (NVDA Stock Quote), add uncertainty.
Fundamental Catalysts and Risks
NVDA's fundamentals are strong, with consistent revenue growth and high EBITDA margins. The company's expansion into AI, autonomous systems, and supercomputers, as noted in LiteFinance (Nvidia Stock Price Prediction), supports long-term growth. However, short-term corrections due to overvaluation or market sentiment, especially around tariff concerns, pose risks.
X posts, such as one from @1000xStocks (X post), highlight NVDA's EPS growth reflecting AI monetization, suggesting bullish sentiment, but lack specific $1000 targets. Another from @ravisRealm (X post) notes adding positions at lower prices, indicating confidence but not supporting the $1000 target.
Conclusion
While reaching $176 by June 2025 is plausible with strong earnings and technical breakouts, the $1000 target by year-end is highly speculative, lacking broad analyst support and requiring unprecedented growth. Investors should monitor earnings reports, product launches like Blackwell, and market trends, while employing risk management strategies given the high uncertainty.
Nvidia (NVDA) Bullish Opportunity – GTC 2025 & AI GrowthCurrent Price: $121.67
✅ TP1: $130 – (short-term resistance, +7%)
✅ TP2: $145 – (medium-term breakout target, +19%)
✅ TP3: $175 – (analyst target, +43%)
🔥 Why Bullish?
1️⃣ GTC 2025 Conference (March 17-21)
CEO Jensen Huang’s Keynote (March 18) is expected to unveil:
Blackwell Ultra (B300 series): Next-gen AI GPU with 288GB memory.
Rubin GPU Preview: NVIDIA’s roadmap beyond 2026.
Quantum Day (March 20): NVIDIA’s first quantum event, showcasing its role in quantum simulation despite earlier skepticism—potentially broadening its tech leadership.
Market Sentiment: High anticipation for AI & chip updates, with some seeing 30%-50% upside if AI demand is reaffirmed (e.g., new contracts, backlog growth).
2️⃣ Analyst Ratings & Price Targets
Strong Buy Consensus from analysts.
Average 12-Month Price Target: $174.79 → +43.59% upside.
Price Target Range: $120 (low) to $220 (high).
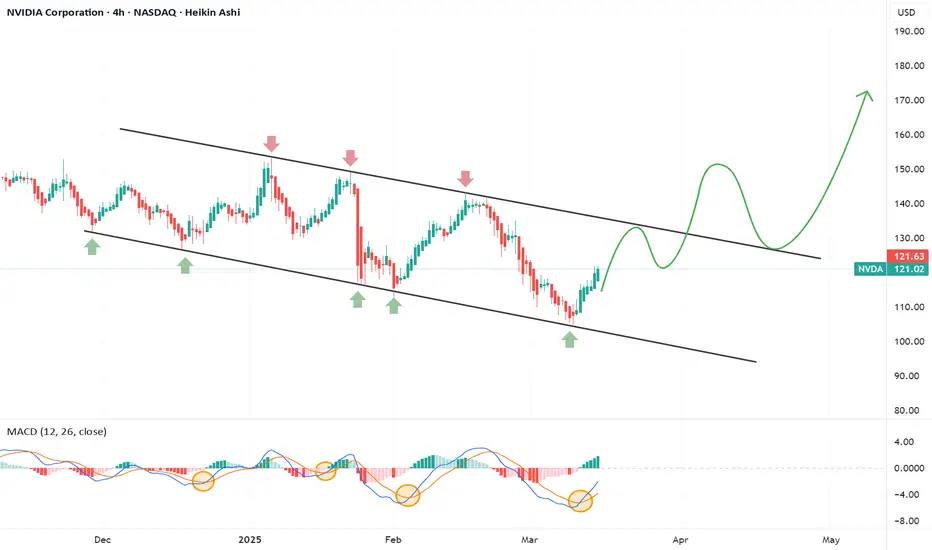
3️⃣ Technical Setup – Breakout Potential
Falling Channel Formation – Price is bouncing from strong support (~$115).
MACD Bullish Crossover – Momentum is shifting in favor of buyers.
Breakout Level: Above $130 would trigger stronger upside.
Nvidia’s Sharp Decline: Market Turbulence or Buy Opportunity?Nvidia ( NASDAQ:NVDA ) shares took a steep dive on Monday, falling nearly 9% after former President Donald Trump confirmed that tariffs on imports from Canada and Mexico will take effect on Tuesday. This sharp drop contributed to broader market weakness, with the Dow tumbling 800 points (-1.8%) and the Nasdaq Composite sliding over 3%.
Despite Nvidia’s recent earnings beat, its stock has fallen over 13% since last Wednesday, erasing its $3 trillion market cap and bringing its valuation down to $2.79 trillion. However, Tuesday’s trading session saw a notable rebound, with NASDAQ:NVDA gaining 3% as buying pressure returned. Given the technical setup and macroeconomic factors at play, is Nvidia poised for a comeback?
Tariff Fears and Supply Chain Scrutiny
Nvidia’s revenue surged 78% year-over-year to $39.33 billion in its latest earnings report, surpassing analysts’ expectations. However, investor sentiment remains cautious due to the uncertainty surrounding new trade tariffs.
Trump’s 25% tariff on imports from Mexico and Canada could impact Nvidia’s supply chain. While most of Nvidia’s chips are manufactured in Taiwan, other high-end components and full computing systems are assembled in Mexico and the U.S., making them subject to the new duties.
Technical Analysis
Despite Monday’s sharp sell-off, Tuesday’s market session saw a 4% bounce, signaling potential recovery. Key technical indicators suggest a possible shift in momentum. Nvidia’s relative strength index (RSI) has dipped close to oversold territory, suggesting the stock may be due for a reversal. NASDAQ:NVDA is trading at levels last seen in September, a historically strong support area that could trigger buying interest.
With traders digesting tariff implications and market conditions stabilizing, Nvidia could see a short-term bounce if momentum continues.

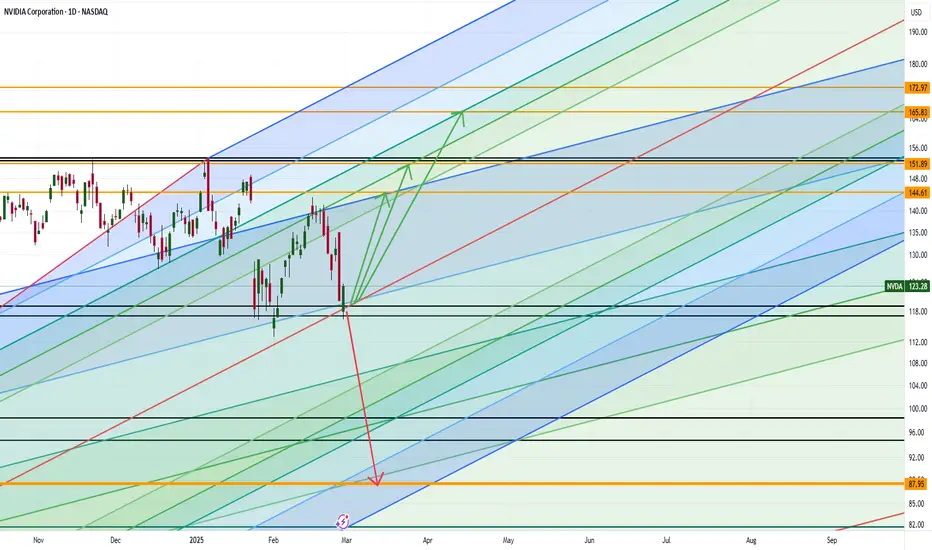
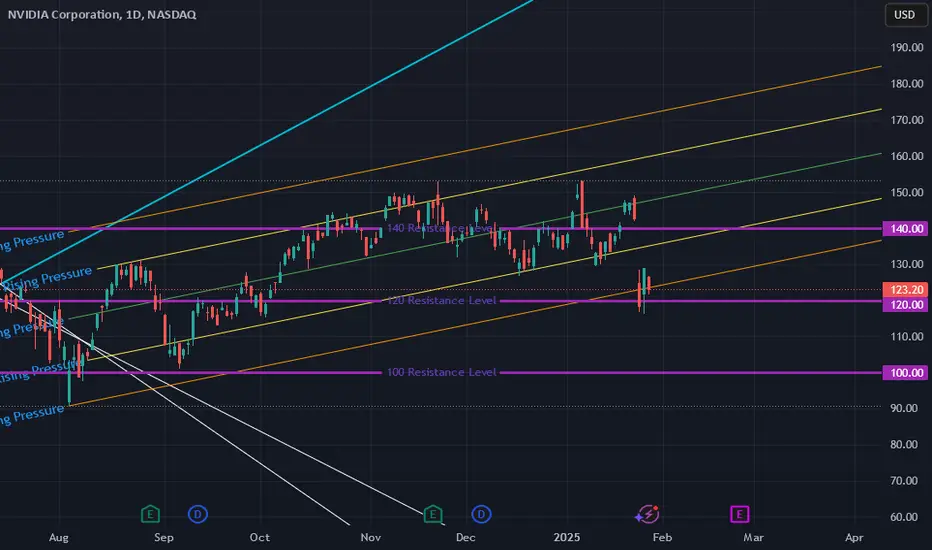
NVDA to 151? Morning Trading Fam
Currently this is what I am seeing with NVDA, looks like we have decent support around 118 if that level holds I can see us driving up to 144 then 151 from here. However if we break through the 118 support: we could possibly see a massive breakdown down to 87-88 dollar range.
Kris/ Mindbloome Exchange
Trade Smarter Live Better
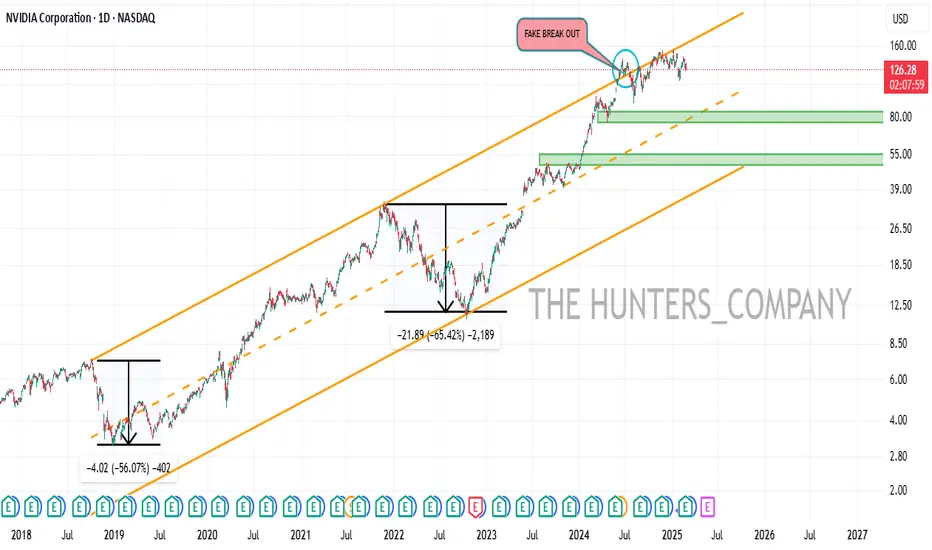
NVDA : Good shopping pointshello friends
We have analyzed these stocks for you in a very simple way. In the long term...
We have identified good shopping points where you can shop.
Note that the price is at the ceiling of the channel and it is not logical to buy at the ceiling of the channel, so either we buy in case of correction or if the channel is broken and its failure is valid, we can buy.
*Trade safely with us*
Nvidia = 4T Market CapNASDAQ:NVDA : Largest Market Cap in the World?!
4 Trillion Market Cap Inbound 🎯
Ever since Nvidia flipped to green on the H5 indicator we have come back to retest it 5 times. In which we bounced and then rallied hard!
Support created and NASDAQ:NVDA is breaking out!
Not financial advice

NVDA: Looks like bottom to me!NASDAQ:NVDA : Looks like bottom to me!
- Volume shelf
- 50D MA
- S/R Zone
- Almost at Green support beam on Wr%
- Above bull flag breakout retest
$135▶️$160 inbound 🎯
Not financial advice
$NVDA - Resilience in ActionNASDAQ:NVDA
In my previous post (linked above) I noted the amount of macro upwards pressure NASDAQ:NVDA
Even with the market becoming leary of (or noticing other A.I. developer options), NASDAQ:NVDA still just makes the HARDWARE that these A.I. models are able to use and abuse in order to perform better. NASDAQ:NVDA will continue to create great hardware, and continually iterate on the items that will continue to make A.I. great.
My recommendation? Continue to hold, and buy at these lower levels. NASDAQ:NVDA will continue to rise.
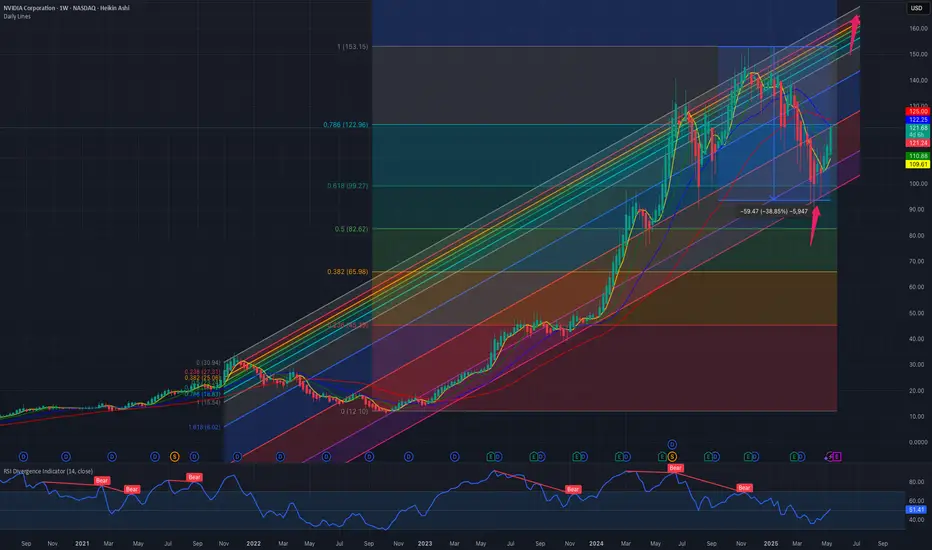
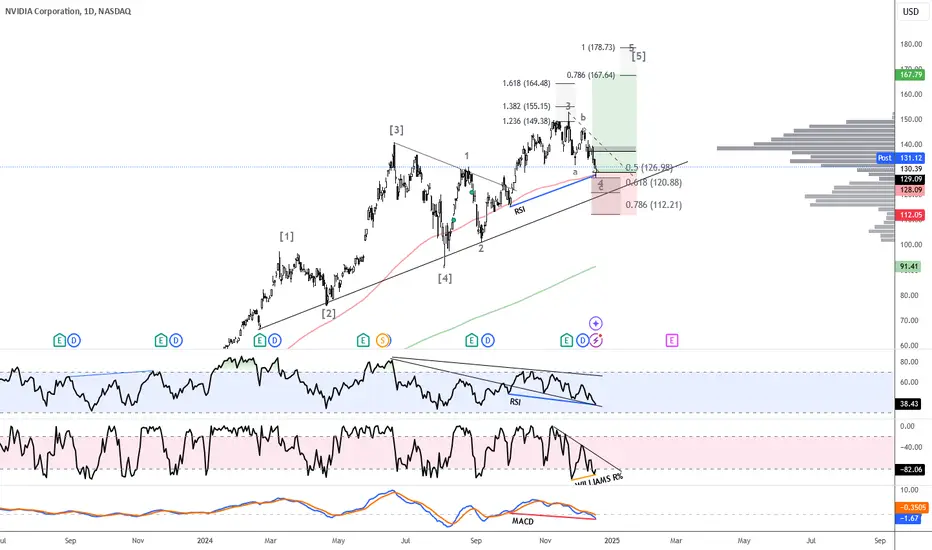
$NVDA LongNVIDIA Corporation (NVDA) shows signs of a potential rebound based on Elliott Wave Theory and key technical indicators. The chart suggests that NVDA has likely completed a corrective Wave 4 and could be entering Wave 5, signaling a continuation of its primary bullish trend. Divergences in the Relative Strength Index (RSI), MACD, and Williams %R indicate that the recent pullback may be temporary.
The RSI shows a bullish divergence, with higher lows on the indicator while the price made lower lows, a common precursor to upward momentum. The MACD has turned upward, with a bullish crossover suggesting increasing buying interest. The Williams %R, which measures overbought and oversold conditions, also shows a divergence, indicating the stock may have been oversold and could be ready to reverse.
NVIDIA’s strong fundamentals, driven by increasing demand for AI infrastructure and GPUs, support this technical setup. Compared to gold and U.S. Treasury bonds, which have stabilized with minimal growth potential, NVIDIA offers significant upside as the chart signals a potential reversal and renewed bullish momentum.
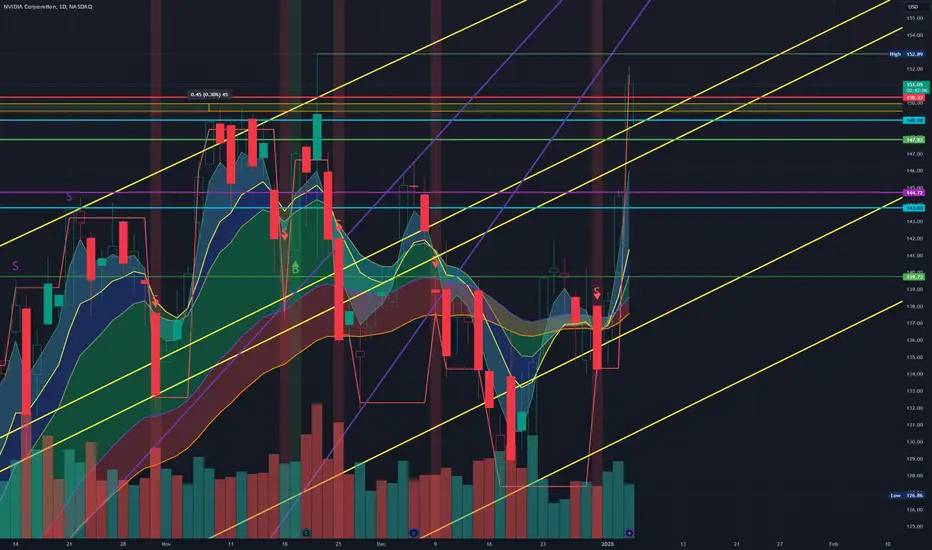
Daily Halftime Report: NVDA Continuation Buy-InDaily Halftime Update: NVDA gapped up on this morning's session to retest it's ATHs at $152.89 which was tested back in Nov 21, 2024. Looking for a entry between $149.5-$149.95 (Target: $149.73) and a close above $148.98 for confirmation of Continuation to retest those ATHs in the weeks to come. Looking for a $160 Price Target on the Long Trade here.
Don't Miss the Second Wave of AI Opportunities!Are you still regretting missing out on NVIDIA's 10x growth? This time, you may not need to worry. The second wave of AI is forming, and this time, the opportunities are not limited to hardware, but are fully penetrating enterprise-level applications. For investors, this is an unparalleled new window of opportunity.
A Look into the Future: The Development Patterns of AI
Reviewing history, from the power revolution a century ago to the internet revolution in the 1990s, we see similar development patterns. Each revolutionary technology wave will go through three key stages. Let's take the internet revolution as an example:
Infrastructure Construction Stage
In the late 1980s and early 1990s, the internet was just emerging, and its applications were still very limited. The companies that benefited most were those in the foundation layer, such as Cisco and Intel.
The first stage of AI development was similar, with chip giants like NVIDIA driving the construction of AI infrastructure.
2. B2B Application Rise Stage
In the mid-1990s, the internet gradually entered the enterprise-level application field, with CRM and supply chain management software emerging, improving corporate production efficiency.
AI is currently entering this stage, with companies optimizing operational processes using AI technology to achieve cost reduction and efficiency improvement.
3. C2C Consumer-Level Application Popularization Stage
In the late 1990s, various C2C killer applications began to emerge, such as Amazon, PayPal, and Yahoo!, which became familiar companies.
Now that the first wave has stabilized, the question is: when will the second wave arrive in B2B applications?
Many ordinary people have a feeling that AI applications are limited to chatbots like ChatGPT, and that true killer applications have not yet arrived or will take a long time to develop.
As a result, some people believe that AI investment is still too early, and that what's being blown up now is just a bubble.
Indeed, we can see that C2C applications are still in development and will take a long time to mature. However, in B2B applications, AI has already been widely deployed and has shown significant effects in certain specific fields. It's just that ordinary people haven't yet felt it.
As investors, we must be more sensitive than ordinary people because corporate changes will be critical to the second wave of AI.
The Second Wave of AI: The Golden Era of Enterprise-Level Applications
The following graph is a summary of the top-ranked industries in which AI-driven companies are most likely to benefit.
As for software companies like ETFIGV, we can see from their financial reports that AI is driving significant improvements in corporate operating efficiency.
The following graphs show the gross margin and EBITDA margin of three typical software companies: Shopify, Salesforce, and ServiceNow.
Explaination:
Gross margin reflects the main product profit of software companies, while EBITDA margin reflects the company's operating profit after deducting depreciation and interest.
In other words, it represents a company's ability to generate profits from limited resources.
We can see that these three companies have seen significant improvements in their EBITDA margins over the past two quarters while maintaining stable gross margins.
Data does not lie; this may indicate that AI is already seeing effects in enterprise-level applications.
• Shopify: By optimizing internal processes using AI, it maintained stable gross margins while improving EBITDA margins and directly driving stock price growth by 30% after reporting earnings.
• Salesforce: It launched its "INS Instant" AI tool to automate 370,000 tasks, saving 50,000 hours of labor time and significantly improving employee efficiency.
• ServiceNow: Its AI accelerated data extraction speed by 53%, work flow efficiency by 27 times, and RPO growth by 26%, providing more powerful workflow optimization services for enterprises.
These data clearly show that AI is not just a buzzword but brings actual efficiency and profitability improvements to enterprises.
Snowflake: A Breakthrough in Enterprise Data Analysis
Snowflake's case is more representative. This data analysis platform focuses on providing intelligent operational support to enterprises using AI technology.
This quarter's RPO increased from $52 billion to $57 billion, reflecting enterprise trust in its AI capabilities. CEO's "All-in-AI" strategy not only drives data mining efficiency but also drove its stock price up by 30% after reporting earnings.
Insurance Industry Digital Transformation: AIFU and BGM's Strategic Cooperation
The insurance industry is an important target area for AI transformation due to its information-intensive nature. It is at the forefront of digital transformation, especially with AI technology driving it forward.
AIFU's smart future has already achieved insurance industry transformation through its core product "Duxiao" platform.
"Duxiao" is an AI-driven insurance platform developed jointly by AIFU and Baidu. By combining big data and AI technology, it can provide personalized insurance solutions for customers.
The platform analyzes customer health insurance needs, education planning, and wealth management needs in depth and generates highly customized insurance configuration plans. This has significantly improved agent productivity and accuracy while reducing operating costs.
As of December 2023, AIFU's revenue reached $31.98 billion, with a year-on-year growth rate of 14.98%. Net profit was $2.89 billion with a year-on-year growth rate of 237.25%.
AIFU's PE ratio (TTM) is only 3.5 times. In comparison to industry giants such as Prudential (PUK) and AXA (AXAHY), which have PE ratios above 12 times or even higher than AIFU.
AIFU's strategic acquisition of two subsidiaries by BGM on Friday includes core technology assets such as "Duxiao" platform. BGM is a global pharmaceutical and chemical company that has actively promoted its AI strategy in recent years.
By integrating AI with data analysis, BGM is reshaping its business model towards a more intelligent future.
How to Seize Opportunities in the Second Wave of AI?
What kind of companies will ultimately succeed? I can share with you my thoughts on what kind of companies need to possess these characteristics:
Strong Competitive Moat: Companies that can continuously strengthen their competitive barriers through AI.
Data Monopoly Advantage: Companies that build models using high-quality private data rather than public data.
Flexible Business Model: SaaS platforms with pay-as-you-go pricing models have more scalability and profitability potential.
Strong Execution Ability: Agile and decisive management teams that can quickly deploy technology.
Conclusion:
The future belongs to those who dare to layout!
How Will Nvidia's Stellar Quarter Impact the Future of Tech InveNvidia Corporation (NASDAQ: NVDA) experienced a rollercoaster ride as investors grappled with its impressive third-quarter earnings report. While the chip giant delivered a strong performance, the market's reaction was somewhat muted, highlighting the high expectations placed on the company.
A Quarter of Record-Breaking Growth
The surge in revenue was primarily driven by the robust demand for Nvidia's high-performance GPUs, which are essential for powering artificial intelligence (AI) and machine learning applications. The company's data center segment, in particular, saw exponential growth, fueled by the increasing adoption of AI in various industries.
A Cautious Market Response
Despite the impressive results, Nvidia's stock price fluctuated throughout the day. While the initial market reaction was positive, with shares rising in pre-market trading, the momentum soon faded. Some analysts attributed this to the high expectations set by Nvidia's consistent outperformance in recent quarters.
Another factor that may have influenced the market's reaction was Nvidia's outlook for the fourth quarter. While the company provided a revenue forecast that exceeded analyst expectations, some investors may have been hoping for even more aggressive guidance.
Long-Term Growth Prospects Remain Strong
Despite the short-term volatility, Nvidia's long-term growth prospects remain robust. The company's dominance in the AI and machine learning market, coupled with its strong financial position, positions it well to capitalize on the ongoing technological revolution.
As AI advances and becomes more pervasive, the demand for high-performance computing solutions is expected to soar. With their superior performance and energy efficiency, Nvidia's GPUs are ideally suited to meet this growing demand.
Key Takeaways from Nvidia's Earnings Report
• Record Revenue: Nvidia's third-quarter revenue of $35.08 billion surpassed expectations and marked a significant year-over-year increase.
• Strong Data Center Performance: The data center segment was a major growth driver, fueled by the increasing adoption of AI and machine learning.
• Cautious Market Reaction: Despite the strong results, the market's reaction was muted, reflecting high investor expectations.
• Long-Term Growth Potential: Nvidia's strong market position and focus on innovation position it well for future growth.
As Nvidia continues to push the boundaries of technology, its stock price will likely remain volatile. However, the company's strong fundamentals and promising growth prospects make it an attractive investment opportunity for long-term investors.

NVDA (NVDL) BIG MOVE BREWING, BUY THE DIP! 100%+ MOVE INBOUNDNASDAQ:NVDA NASDAQ:NVDL
BIG MOVE BREWING, BUY THE DIP! 100%+ MOVE INBOUND
In this video, we discuss the following:
1.) My #HIGHFIVESETUP trading strategy which incorporates charting patterns, volume profiles, MACD, RSI, and TREND.
Notable recent winners with my strategies include NASDAQ:TSLA NASDAQ:SOFI NASDAQ:MBLY NASDAQ:AMZN NYSE:HIMS
2.) Go in-depth on how to tell when an investment or trade will go against you and what you should be looking for. We go over my favorite indicator for this, which is the Williams R%.
We primarily discuss the 2X levered ETF NASDAQ:NVDL which has the same setup as it's parent NASDAQ:NVDA . So feel free to use this setup for either one depending on your risk tolerance.
Thanks for all the support! Over 500 TV followers in such a short period of time, you all are amazing!
LIKE l FOLLOW l SHARE for more great content and analysis!
NFA

NVDA Great ROI Trade To 150 Good morning Trading Family
The market corrected a bit deeper than expected however we got a correction lol
We have a great bullish opportunity from the 139.80 level to enter in so we go to the levels of 150 possibly beyond
I give you my reasoning on what I see and why
Mindbloome Trading
Trade What You See

NVDA Great ROI Trade Bullish to 145+ Hi Trading Family
Here is an update for you: a potential finish of our correction down from the analysis we currently did today. Massive ROI and break up potential, if your looking for a great trade with low risk ie put your stop below the low and let it run to 145 this could be the trade your after
Hope this helps
Mindbloome Trader
Nvidia's Stellar Surge: A Reflection of AI's AscendanceNvidia's meteoric rise in recent months is a testament to the burgeoning artificial intelligence (AI) revolution. As tech giants race to integrate AI into their products and services, the demand for Nvidia's high-performance computing chips has skyrocketed. The company's stock has surged by an impressive 25% in the past month alone, and it's on the brink of breaking its all-time high.
Nvidia's dominance in the AI hardware market can be attributed to its cutting-edge graphics processing units (GPUs), which are ideally suited for the complex computations involved in AI tasks. These chips have proven to be indispensable for training and deploying large-scale AI models, such as those used in natural language processing, computer vision, and generative AI.
As tech earnings season approaches, investors are closely watching Nvidia's performance. The company's financial results will provide valuable insights into the strength of demand for its products and the overall health of the AI market. Analysts are anticipating a strong earnings report, fueled by continued growth in data center sales and increasing adoption of Nvidia's AI solutions.
One of the primary drivers of Nvidia's success has been the accelerated development of AI technologies by leading tech companies. Meta, Alphabet, Microsoft, Oracle, and OpenAI, among others, have been investing heavily in AI research and development. These companies are racing to introduce new AI-powered products and services, such as chatbots, virtual assistants, and generative AI tools. To support these initiatives, they require powerful hardware infrastructure, including Nvidia's GPUs.
The growing demand for AI chips has created a significant opportunity for Nvidia. The company has been expanding its manufacturing capacity and investing in research and development to maintain its technological edge. Additionally, Nvidia has been exploring new markets, such as autonomous vehicles and healthcare, where AI is expected to play a crucial role.
While Nvidia's future prospects appear promising, it's essential to acknowledge the potential risks and challenges that could impact the company's growth. These include intense competition from other chip manufacturers, fluctuations in the global semiconductor market, and the possibility of regulatory hurdles related to AI development.
Despite these risks, Nvidia's strong market position and the increasing importance of AI suggest that the company is well-positioned to capitalize on the ongoing technological revolution. As AI continues to transform industries and society as a whole, Nvidia's high-performance computing chips are likely to remain a critical component of the AI ecosystem.

30 Min- 5 Min NVDA We are Going Up But to Where ???? Good morning Traders
Everyone has a coffee in hand lets get into it
So in the video I break down a bit more wave counting, a few projections on where we are going up and where we might encounter some resistance plus our thesis is still in check on hitting 128-129 zone like we discussed before.
Enjoy
MB trader
