SEPT 6TH I posted a top qug 17 to sept 6 th CARES FUNDS END As we are fast approaching the time spirals as well as Trendlines in time
NYA

WAVE 5 JUST STARTING BLOW OFF MIN 17648 NYAThe wave structure is getting very clear now look for 17648 as the next target DO NOT SHORT ANTHING IN THE INDEXES MID SEPT TOP

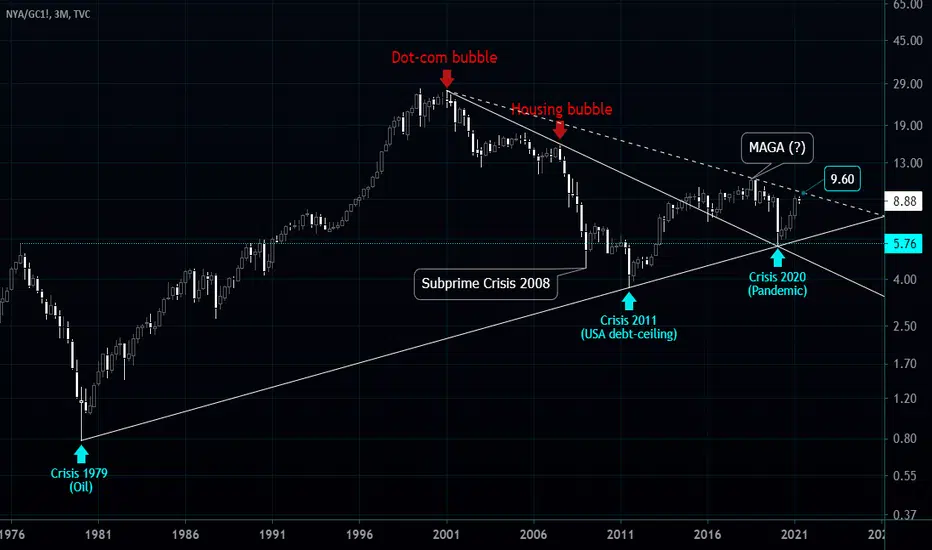
USA/GOLD: the truth about $SPX-Why is the SPX a lie?
For starters it weights the 500 most desirable companies and, to continue, its unit of reference is the dollar... an "unbacked" currency (as crypto fanatics say with some reason... people so blinded by their infatuation that from a half-truth they are capable of elaborating truths of a ton or even more).
-Ok, and what do you want to invent, wifi rebel?
There is no need to invent anything, luckily: besides the marketer SPX there is also the NYA that considers more than 2000 NYSE companies... and I believe NYA more than SPX, to make a long story short. And the dollar, although it is backed by much more than ink and paper (because behind this bill is the most powerful economy on the planet and not Argentina or Venezuela), anyway it has a lot of lies and the CPI (US Consumer Price Index) proves it every day.
-And what about that?
And with that it seems clear to me that we should not pay so much attention to the SPX or the dollar... especially having the NYA and gold to get a historical ratio that reflects the ups and downs in the romance between Mr. Gold and Mr. Stock Market (let's be inclusive).
-And why don't you put CPI into this ratio?
Well, I don't think it's necessary inasmuch as both constituents are equally affected by the depreciation of the greenish paper... so the ratio itself gives us ecumenical information on the binomial. Amen.
**********************************************************************************************************
Well, let's get more serious:
What we get concretely from looking at this ratio is HOW MANY GOLDEN CONTRACTS THE NYA CAN PAY OUT OVER TIME.
It's that simple and that far-reaching... because if we're going to bother with "FIAT money blablabla", well then let's measure the US market in GOLD and stop whining pseudo-arguments. Does it make sense or not? I say yes...
Now let's break it down:
1) the trend line below is impressive: it has three millimeter contact points... so precise that, somehow, they are backing up all the chatter I wrote above: the truth of the USA MKT is in GOLD and not USD;
2) seen this way bubbles and crises don't match sooooo much with the orthodox look in USD;
3) the "real SPX" is still bullish in very long term ... but since 2000 and the .com explosion it is still in bearish mode ... Yes: 20 years losing against gold, it's that simple ....
4) however we also see a very clear triangle figure... that was overcome to pull back to a millimeter throwback against that important TL... and now what we have is a very interesting resistance at 9.60 (NYA is paying 8.76 gold contracts and if it reaches to pay more than 9.60, "it blows up" a timberman would say).
***********************************************************************************************************
Conclusion:
I actually think all these arguments make sense, rationally speaking, and what I see here is very reassuring to me about "the current bubble" that has been talked about for a long time. Why? Because that bubble is measured in the "lie" of the dollar... so it is worth as much as a lie (i.e. nothing), and on the other hand in gold we have a symmetrical triangle of upward continuation that is about to be executed... with targets so astronomical that not even the most smokeseller "twistar" would dare to handle it.
Think about it...
NYA - SHORT - Will the pattern replay?NYSE - BEARISH
-Very similar historically bearish patterns presenting themselves in this chart. Weak price action and rounding tops currently present on top of multiple rejections to move higher. These patterns looks very similar to past bearish moves, the question is, will it replay? Looking at 150p drop if it plays out.

[NYA] Is No One Tracking This or What?... Double Top Crescendo!I just discovered this.
Seems quite meaningful.
Failed H&S breakout?
Enjoy! B)

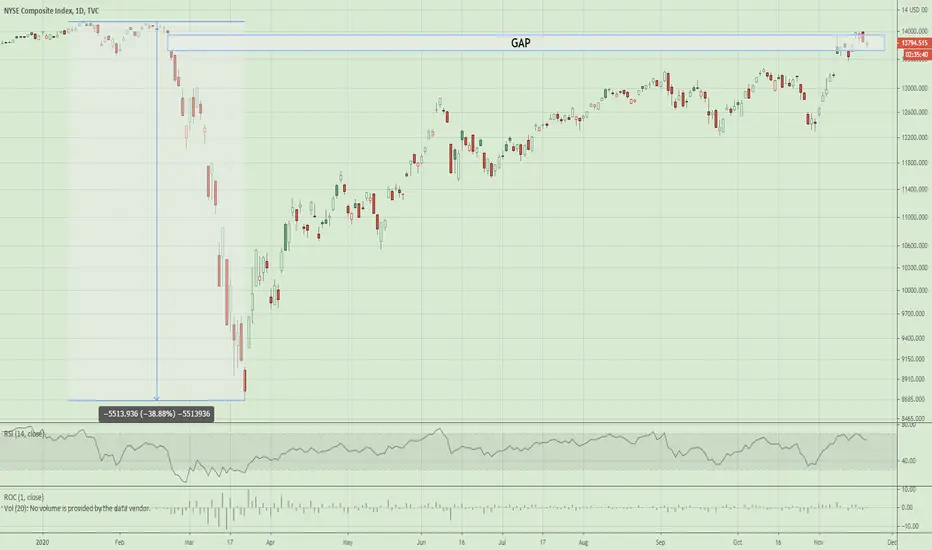
NYSE Composite fills its gap!The NYSE Composite, with over 2,000 components, has filled its gap from 2/24/2020. Now what happens? Well given the avg. returns in Presidential years, I would guess that the markets stay relatively flat until the end of 2020.
American Stock Market Return by Asset Class for Q4American Stock Market Return by Asset Class for Q4
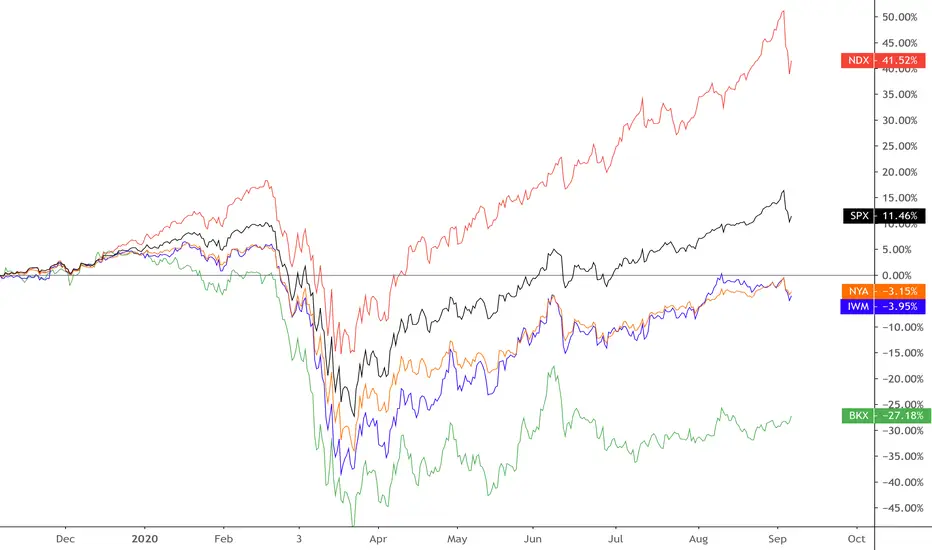
American Asset Class Laggers by Industry/Sector for Aug. 2020A comparison of the SPX , NDX, NYA , BKX , & IWM indexes for August wk2 2020.
17:29:46 (UTC)
Sat Aug 8, 2020

UPD: Kissing broken post 2009 & 2016 lows TL from belowGap and falling MA20 area too $DJI, $SPY, $NDX

NYSE COMPOSITE INDEX (NYA) WeeklyDates in the future with the greatest probability for a price high or price low

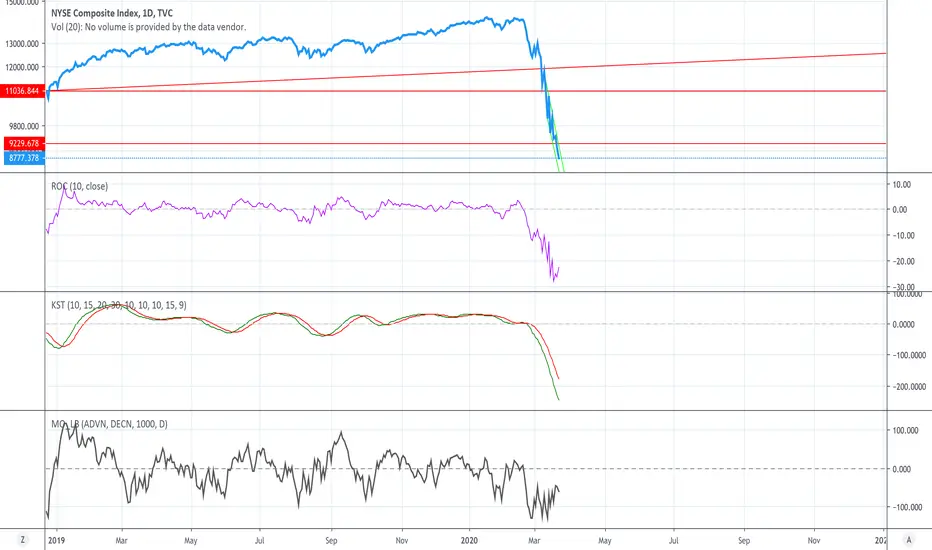
NYA Buy SignalTiming the bottom is almost impossible. Instead, look for buy signals. When the ROC indicator goes from mega oversold (-20) to mega overbought (+20), along with the KST either showing a positive divergence or weekly MA crossover and a McClellan Oscillator (measure of market breadth) mega oversold (-70) to mega overbought (70) is the signal I would look up for!
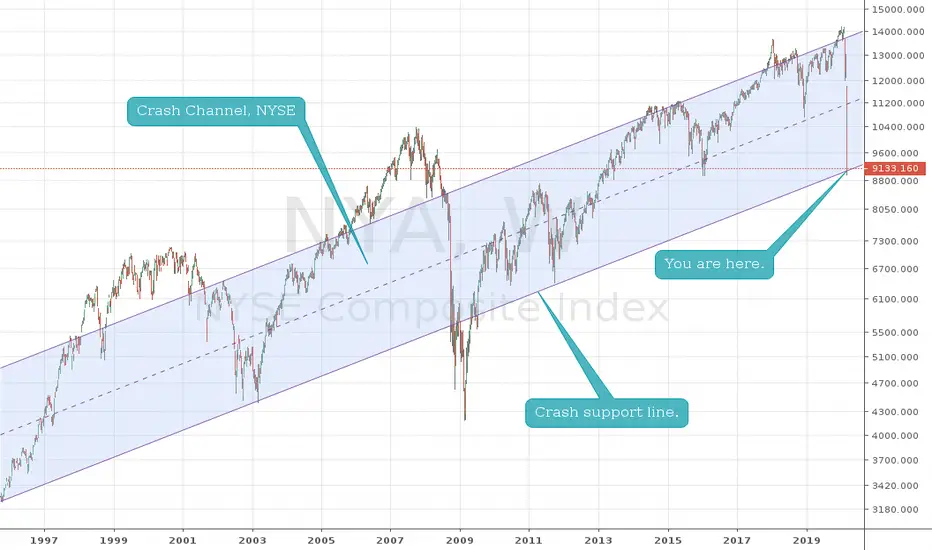
CRASH CHANNEL, NYSEBroader NYSE index since 2001 has developed a channel, excepting 2008, where the market during crashes has held.
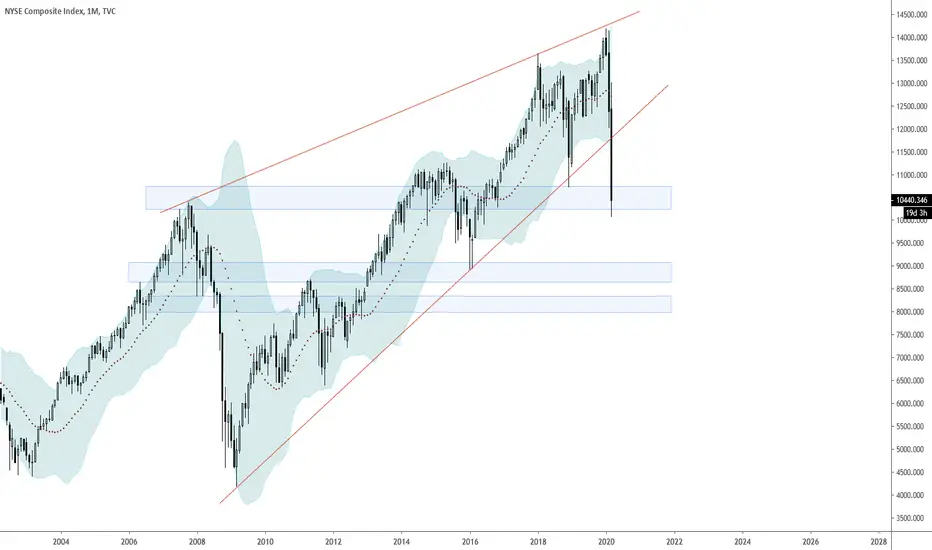
NYSE Scenarios Week of 3/23 (3 of 3)Chart 3 is suggesting next support rail is 8% lower. This extends from 1984.
Notice also that every major bottom showed a series of bullish divergent lows. We only have our first here, so a long way to go towards a bottom.
This leads me to believe:
1. We are not at the bottom
2. Monday's gap open will lead the way to next target. Gap down look for retest of breakdown and fade. Gap up, look for fade then test resistance higher.
3. You should be prepared for a 28% move lower.

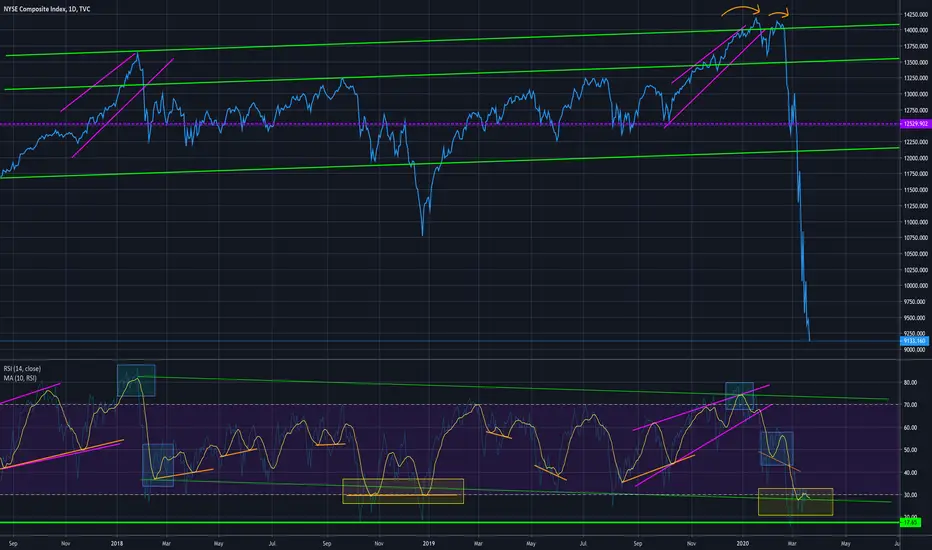
NYSE Scenarios Week of 3/23 (2 of 3)Chart 2 shows that we *could* be bottoming here using the 10sma on the daily RSI, but it's not a very strong signal, and it's below support.
NYSE Scenarios Week of 3/23 (1 of 3)Quick studies on the $NYSE don't look good.
As chart 1 suggests, we're holding support at 2016 levels, and could backtest the breakdown, which would result in an upwards move of 28%.
Could also gap below Mon open. 2011 levels are next. 28% lower


UPD: NYSE Entering 2016 breakout arrea for 2nd time after 2019increase in A/D ratio will confirm bottoming process $SPY, $DJIA, $NDX

Mar 2 Session Profile | /ES S&P 500 E-Mini FuturesDescription:
Things I'm thinking about this morning.
Points of Interest:
Untested POCs, October low, 200 moving average, 50% and 61.8% retracements, gap at the beginning of the sell-off, Monday $VIX pop to $40+.
Technical:
Untested POCs (see related ideas) beneath February high were erased in a swift correction. In my opinion, the virus-related news is the match that lit the fire (i.e., this was coming). I'm expecting some sort of bounce and retest of the lows.
Additionally, half of the S&P 500 stocks are in bear market territory right now (www.reuters.com).
Index Analysis:
$RUT: TVC:RUT
$NDX: TVC:NDX
$DJI: TVC:DJI
$NYA: TVC:NYA
Fundamental:
Fed split on whether to cut or maintain rates; spending sees loss in momentum, but consumer fundamentals in a good place; goods trade deficit contracted; manufacturing business outlook recently rose to it's highest levels, but virus and future trade issues may complicate things; housing market hot as home building permits rise to highest levels; debt levels declining; world supply chains at risk due to this virus thing; global yields have generated massive inflows in passive indices that are heavily weighted towards a few stocks.
In The News:
"Federal Reserve Chair Jerome Powell on Friday said the central bank will “act as appropriate” to support the economy in the face of risks posed by the coronavirus epidemic, though he said the economy remains in good shape overall" (www.reuters.com).
Fed funds futures "pricing in more than an 80% chance of a new 1% to 1.25% Fed target range for short-term borrowing costs by March 18, when the Fed next meets, down from the current 1.5% to 1.75% range. Pricing also shows traders expect rates to drop to the 0.5% to 0.75% range by July" (www.reuters.com)
“Consumers shielded the economy from global headwinds for most of 2019 but they won’t prove immune to the coronavirus outbreak,” said Lydia Boussour, a senior U.S. economist at Oxford Economics in New York. “Persistently low inflation bolsters the case for a Fed rate cut as soon as March given the sharp tightening in financial conditions" (www.reuters.com)
"Still, consumer fundamentals remain healthy. Personal income jumped 0.6% in January, the most since February 2019, after gaining 0.1% in December" (www.reuters.com)
" he shrinking goods trade deficit could somewhat limit the downside to GDP growth. A third report on Friday, the Commerce Department said the goods trade deficit contracted 4.6% to $65.5 billion in January. Goods imports tumbled 2.2% last month and exports dropped 1.0%" (www.reuters.com)
"While the coronavirus is disrupting supply chains for manufacturing, some sections of the industry do not appear to be experiencing significant distress. The Chicago Purchasing Management Index rose 6.1 points in February to a reading of 49.0, the highest level since August 2019, a fourth report showed. The joint MNI Indicators and ISM-Chicago survey suggested a marginal impact on businesses in Chicago area from both the coronavirus and last month’s signing of a “Phase 1” trade deal between the United States and China" (www.reuters.com)
Information I'm Carrying Forward:
Historically, "Epidemics normally have a severe but relatively short-lived impact on economic activity, with the impact on manufacturing and consumption measured in weeks or at worst a few months." (www.reuters.com)
"Despite historically low interest rates, U.S. companies are being unusually frugal, holding back on issuing new debt and pumping up their balance sheets with cash. Why it matters: Historically, when interest rates are low and the economy is strong, companies have levered up to increase capital expenditures and buy assets in order to expand. The opposite is happening now." (www.axios.com)
"So add low interest rates to suppressed inflation (temporarily) coupled with slowing worldwide growth, and we get a powerful upward force for stock prices. Our upside target for the S&P 500 Index is now 3600 or higher." (www.cumber.com)
"A survey of small- and medium-sized Chinese companies conducted this month showed that a third of respondents only had enough cash to cover fixed expenses for a month, with another third running out within two months. While China’s government has cut interest rates, ordered banks to boost lending and loosened criteria for companies to restart operations, many of the nation’s private businesses say they’ve been unable to access the funding they need to meet upcoming deadlines for debt and salary payments. Without more financial support or a sudden rebound in China’s economy, some may have to shut for good." (www.bloomberg.com)
Disclaimer:
This is a page where I look to share knowledge and keep track of trades. If questions, concerns, or suggestions, feel free to comment. I think everyone can improve (myself especially), so if you see something wrong, speak up.


