NYA
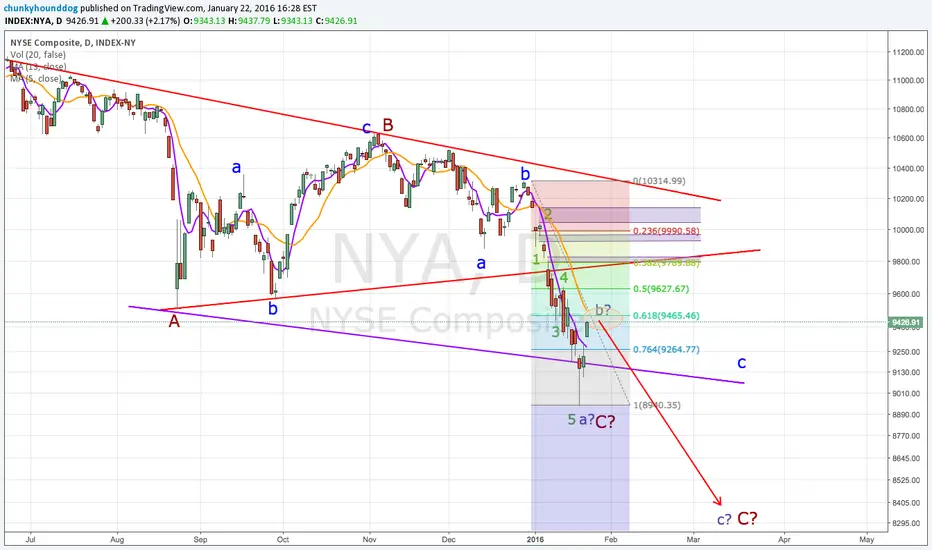
BROKEN ARROW in NYSE - Elliott Wave Bearish CountBroken Arrow - Ending Diagonal
New York Composite looks similar to the SP500.
Price action seems to had made the last wave up the 21th of may 2015 and thus done with the 5th of the 5 waves up since 2009 low.
Yesterday's price action stopped at the lower trend line for the ending diagonal.
We still need have confirmation - either by price action breaking the trendline or setting in a lower low on the daily timeframe.
NYSE has just like SP500 reached a fib-resistance area at 1.13
Fear not... believe what you see and trade it.
@BLawrenceM
Music at work:
www.youtube.com
open.spotify.com
Broken Arrow?
www.youtube.com
www.youtube.com
www.youtube.com

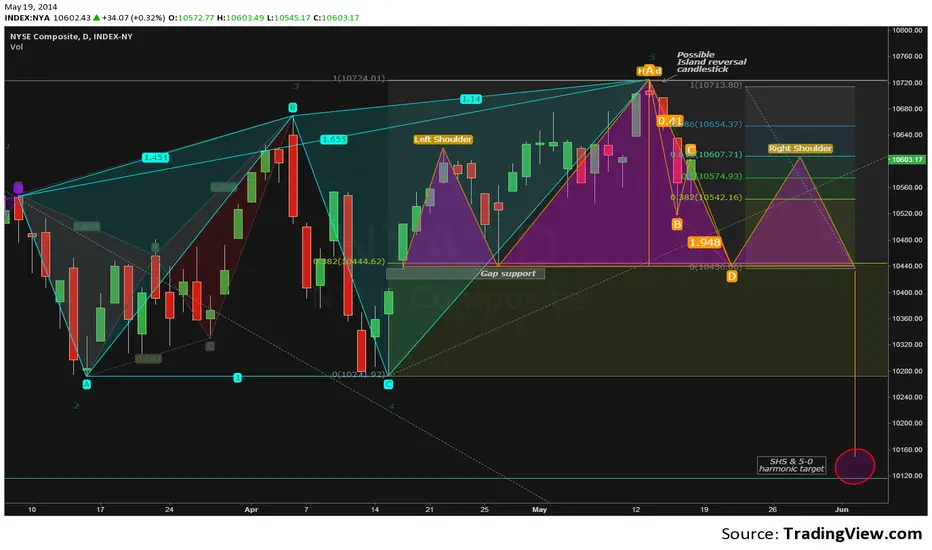
La Belle Epoque Nya est peut d'etre finiSeveral patterns are in play in NYA composite
The last 6 month NYA has made several harmonic patterns as shown on the chart (See chart below). The latest is a 5-0 pattern and a ABCD in spe. That should bring a price target of 10120
Last week price created an island reversal
For the time being I see price action has made a possible harmonic ABC move (not EW) with a possible D move in the cards.
That will bring price action to a gap support area completing a harmonic ABCD.
With this move price action will define a possible neckline and a bounce area around 10440 for a right shoulder in a possible SHS.
How high will price bounce? It will depend of conviction. I have placed a fib to shown normal areas. If bounce will as high as left shoulder then price will make a 61.8 retrace....remember this is if and if... so hard to tell.
The SHS - should neckline break - has a target that approx correspond with the 5-0 pattern. around 10160 at a 61.8 retrace of February low and the top in May
As always... time will show!
Safe trading Ladies and Gents!
BM
MUSIC AT WORK:
open.spotify.com
www.youtube.com
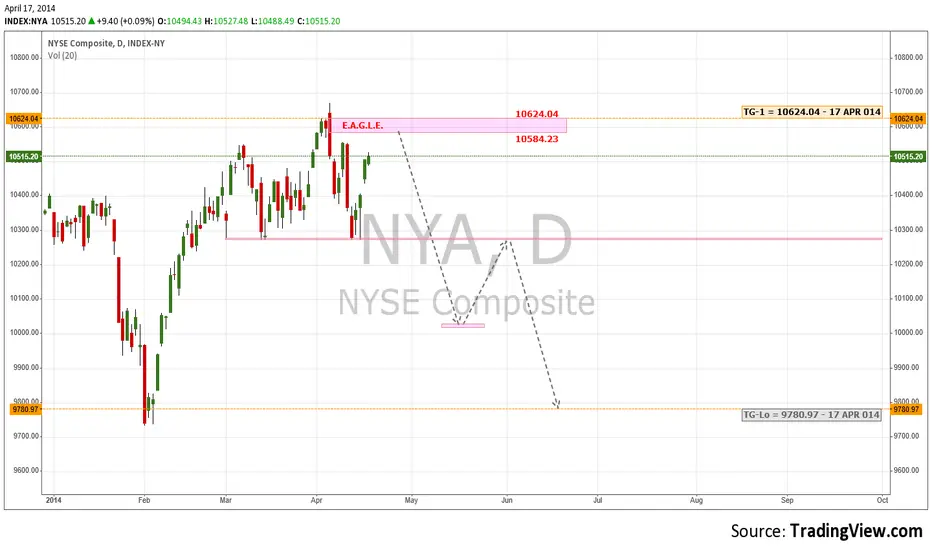
Releif Rally Likely Capped Sub-Surface | $NYSE $NYA $TWTRFriends,
As just indicated in the analysis of Twitter (see it here, "All Targets Hit ... ": ), my predictive analysis and forecasting system defined a probable bullish target as:
TG-1 = 10624.04 - 17 APR 2014.
However, I also cautioned that a significant E.A.G.L.E range (10624.04/10584.23) is likely to impose its own resistance, up to a level that falls in line with the primary bullish target just defined.
Given the economic context and a Fed 's implied plan to continue its taper, all fundamental ingredients seem to be present to support a net bearish sentiment.
If indeed a decline was to occur, my predictive analysis would generate a (still speculative) target low as:
-TG-Lo = 9780.97 - 17 APR 2014.
OVERALL:
For the time being, a relief rally remains the primary focus, but given the fundamental context and analysis above, one should consider bond prices as reliable indicators of pan-market direction, especially the 3-month and the 10-year treasuries. Just saying.
Cheers,
David Alcindor
Predictive Analysis and Forecasting
Get my signals, analyses and forecasts on Twitter:
(Alias: @4xForecaster)
-------------------------------------
Disclaimer:
- All my comments are founded on unshared proprietary as well as common knowledge of technical analysis: Do your own due diligence before trading any market/asset. Additionally, my signals, forecasts, analyses and directional opinions are for educational purposes only and are not trading recommendations. Again, do your own due diligence first, then seek financial advice from a licensed professional, and only then enter the market at your own perils - David Alcindor - TradingView.com Alias: 4xForecaster