TSLA - What did Elon say?NASDAQ:TSLA
It's not about the margins?
But it should be about VOLUME?
Market makers are disagreeing with Elon.
My money is n ELon
Nyse

Technical Analysis In The Following 3 StepsThe problem is finding the right stock to buy
Also to make it worse finding these opportunities
--
every week.
--
You have to look for these opportunities
every week with a powerful strategy
--
Because:
--
#1-A strategy will give you a peace of mind
.
.
#2- A strategy will give you confidence
.
.
#3-A strategy will help make money
.
.
Before you see a working strategy understand
the basic technical analysis
--
After that master your favorite patterns
--
this "Super Gap " Strategy will give you
the bridge to understand
--
Technical analysis in The following 3 Steps:
.
.
Step#1
-----------
.
.
Look for a "Super Gap" On Friday
.
.
Step#2
-----------
.
.
The "Super Gap" has to be above the 50 EMA line
.
.
Step#3
-----------
.
.
The " Super Gap" has to be above the 200 EMA line
.
.
Please Remember: Am not an expert on this information
This strategy is
--
based on my personal research
.
.
Do your own research before you trade
.
.
Regards,
.
.
Lubosi7

Visa Inc!!!Hello ladies and gentlemen, according to my graphical analysis of NYSE:V , there is a high probability of a incline towards the 231,50 usd level in the next few months!
if you have any questions do not hesitate to contact me.

TSLA IS ON AN IMPORTANT KEY LEVELFor more updates, please follow my TradingView page, and if you find the content useful, kindly hit the "thumbs up" button to show your support. If you have any queries regarding trading, please feel free to send me a direct message on TradingView. Additionally, please share this content with your friends who may find it beneficial.
Please note that any trading updates provided here are for educational purposes only, and it is always advisable to conduct your own research before making any investment decisions. It is important to ensure that all conditions are met before following any trade plan suggested in this update.

NVDA ON RESISTANCE WITH A POSSIBLE SELL OFFFor more updates, please follow my TradingView page, and if you find the content useful, kindly hit the "thumbs up" button to show your support. If you have any queries regarding trading, please feel free to send me a direct message on TradingView. Additionally, please share this content with your friends who may find it beneficial.
Please note that any trading updates provided here are for educational purposes only, and it is always advisable to conduct your own research before making any investment decisions. It is important to ensure that all conditions are met before following any trade plan suggested in this update.

DXY-- That candle, though! Reassurance, perhaps?Things are getting interesting! My colleagues don't
think it's time to start getting aggressive on the dollar,
with the main point of emphasis being that rate hikes are
supposed to slow, or not continue increasing as we continue
forward this year. I value my constituents opinions and will
consider it... But, no risk, no reward! Plus, I'm grateful to not
be so attached to my ideas. As long as we are extracting value
from the markets we participate in, who cares if we are right
or wrong in our guesses?
What markets are you focused on currently? Let me know!
As always, happy trading, and Godspeed.
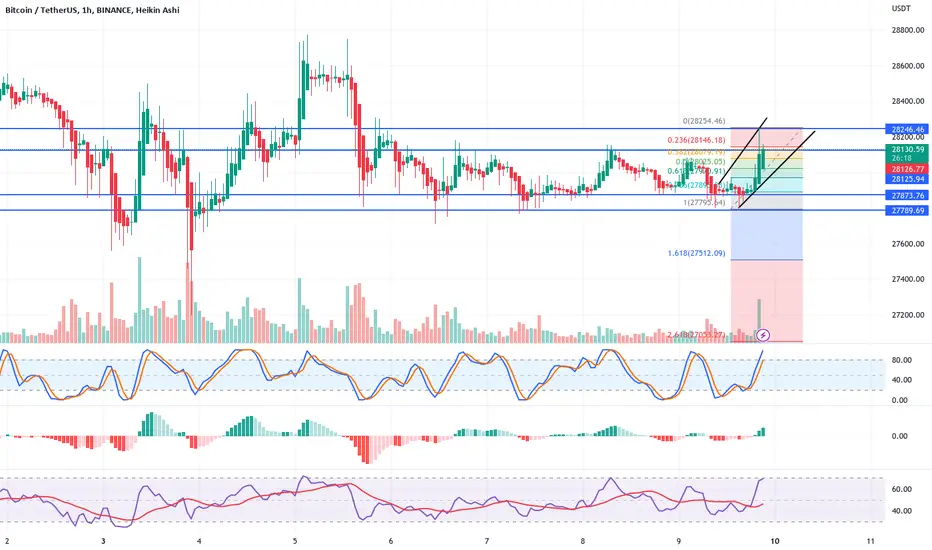
$BTC $USDT tether binance spot 1hour candle time frame, looking for a spring back test, before higher highs. overall bullish, short term bearish.


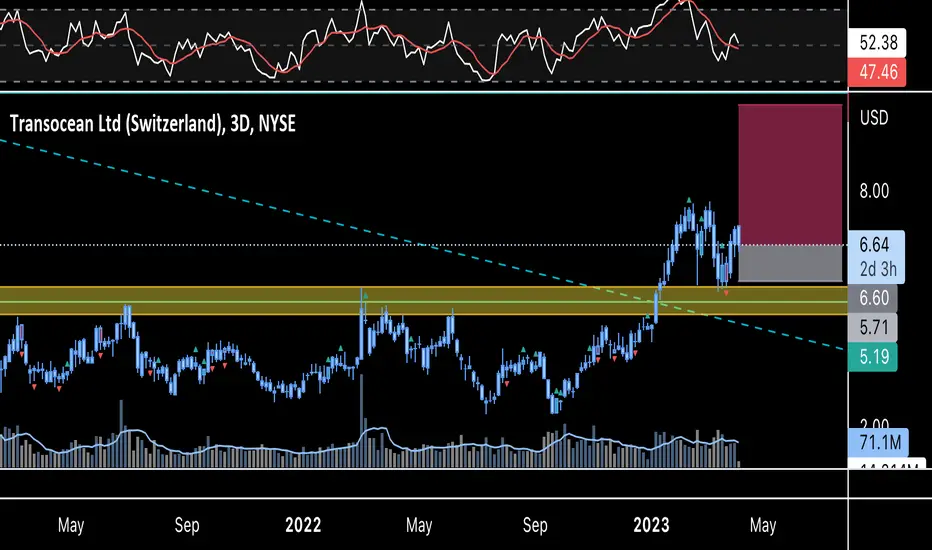
NYSE: RIG - BREAK & RETEST - MOMENTUMOur classic setup has been identified in RIG stock and purely seeing if my playbook work in stocks as well as forex. Risk at your own will if taking these plays, the strategy has not been life tested in stocks until now
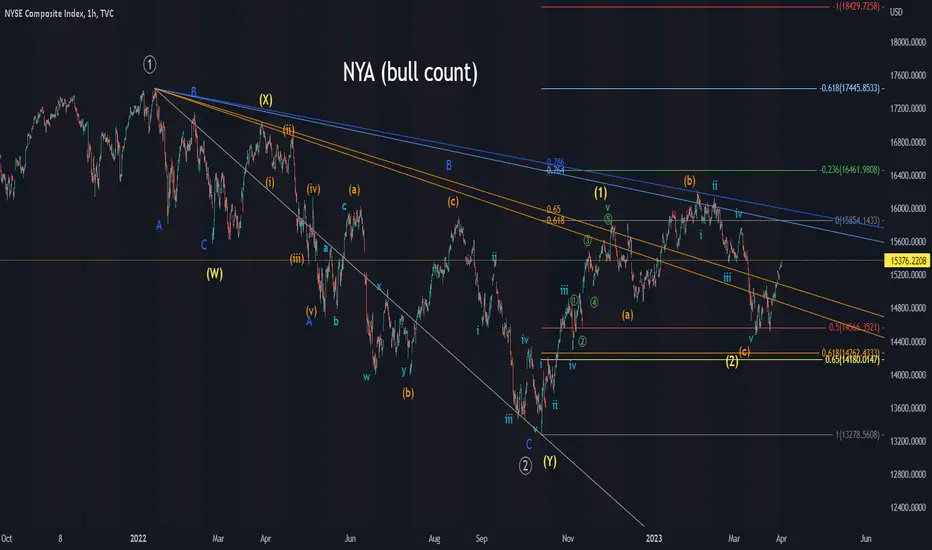
NYA bull countI had earlier published a bear count for the NYA. Well here is a bull count. Both are possible at this point. You want it to get past the 0.765 to 0.786 Fib Speed Resistance Fan to help confirm the bull market.
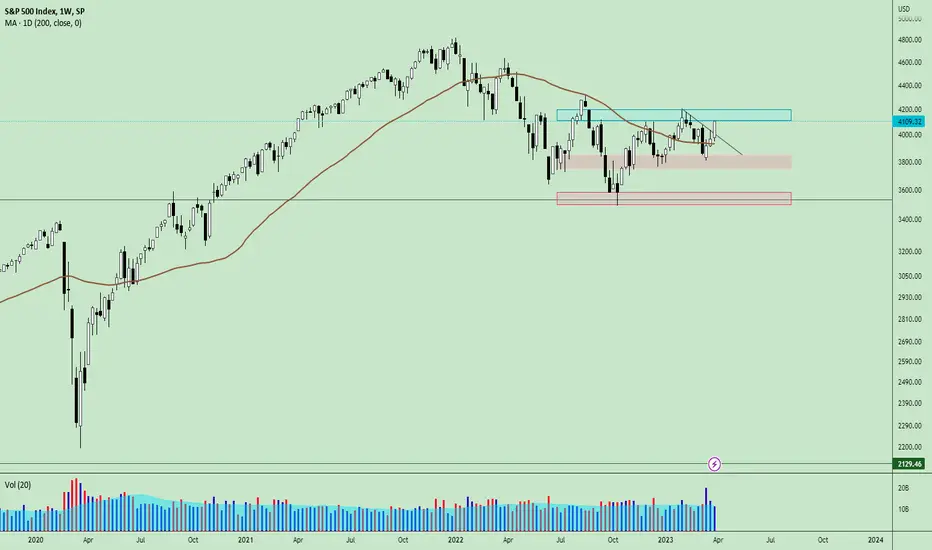
spx500 is started the 2nd round the zone of 4100 is a critical zone for #spy.
its the 2nd try to fight with this zone and this time a bit stronger.
I am personally 60% cash and I prefer to stay calm waiting for a strong breakout beyond the 4300 .
for the next week the volume is more important than the price.
SELL UNTIL 1.0840 and Wait for more !!News Made EUR USD false breakout !!
still 1.0840 in Play TP 1
then Everything going down !!!
Patience is the key !!!
have a good weekend !!!

NYSE: F (FORD) - HARMONIC GARTLEY - LIMIT BUY - ATR SLHarmonic gartley completed a few days ago and was identified today. The systems criteria is still being respected so an entry was taken at the price that would originally have hit the buy limit a few days ago using the same SL that the original harmonic setup rules call for. Lets see if it plays out

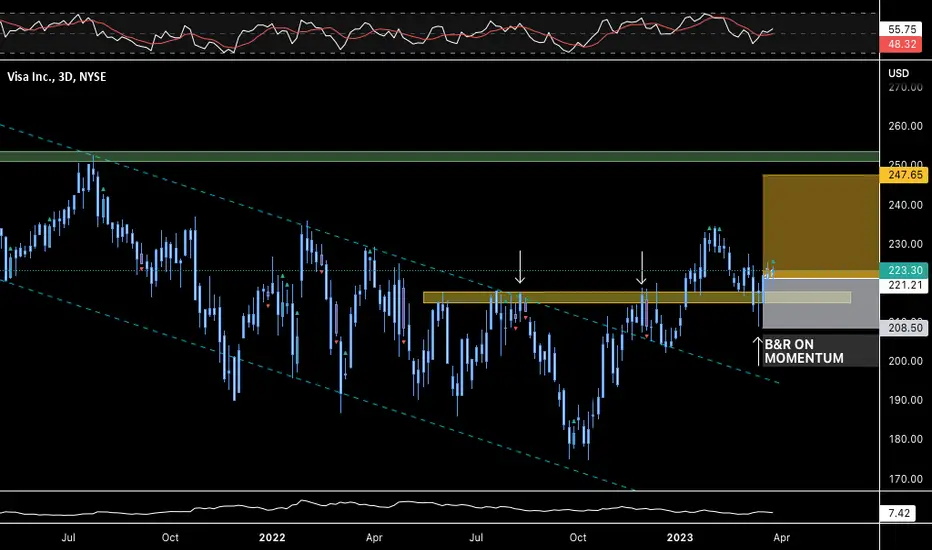
NYSE - VISA - BREAK & RETEST - MOMENTUMBeginning testing phase using my system in the stock market!
Aiming for being able to use it for my own personal longer term investments, ideally to diversify and sow multiple income streams!
The strategy is simple but very systematic and well defined and it's taken me many years to really put together every part of successful trading down to the most intricate detail. If it can work in other markets as well as forex, then the proof will be in these public ideas that everyone has access to and that can't be deleted once posted so there will be no doubt of the authenticity and quality of the system. Which in turn, might open the door later on for potential educational material to diversify income streams which will in turn bring a higher quality of execution in the markets because there will be less financial pressure to perform.
Anyways before any of that takes place, I must see if the system can achieve a positive expectancy in stocks so be on the lookout for future stock posts as well.
Starting out with V using my bread and butter! The classic B&R play that appears throughout my ideas in forex. As far as timeframes, from pure observation in past instances with the stock market, I've found the 3 Day candle chart to be particularly clean in terms of price action so that will become my default timeframe for stocks for this first testing phase.
Lets see how this plays out over the next few weeks!
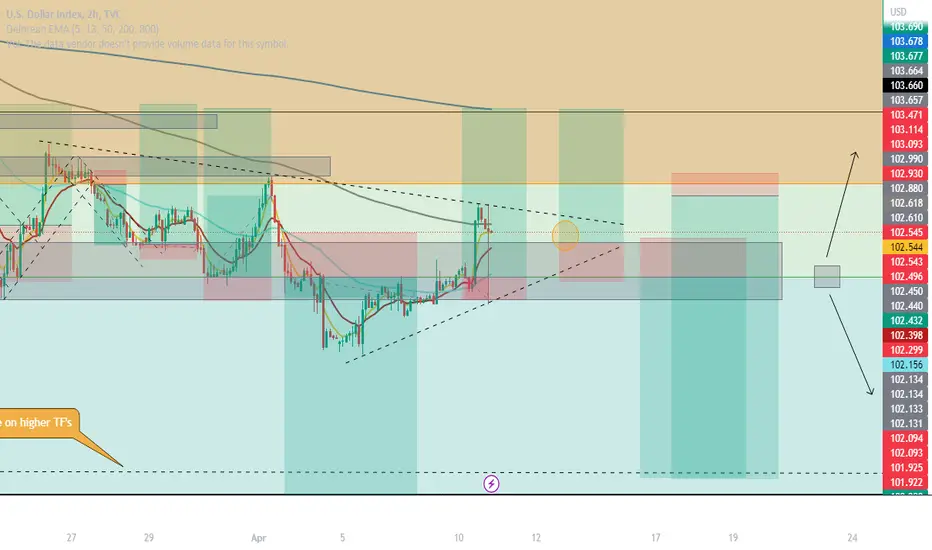
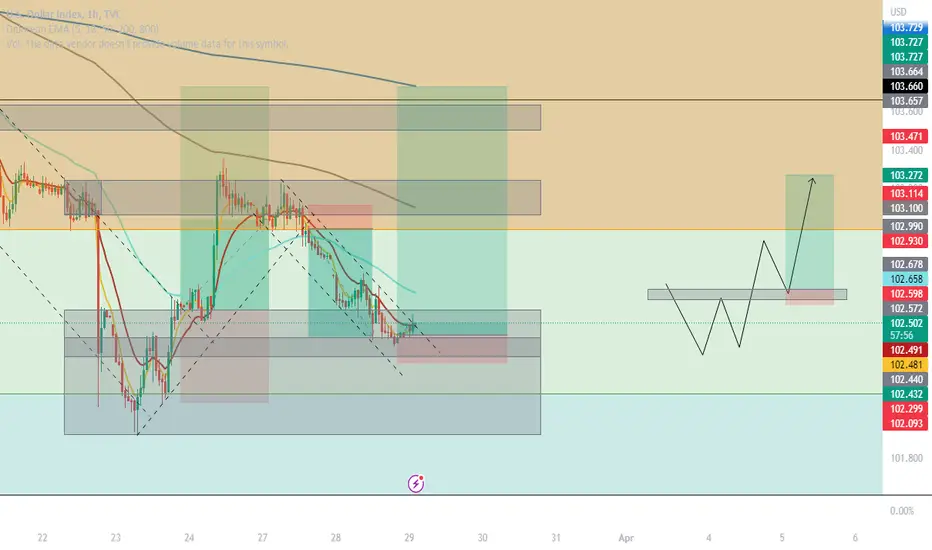
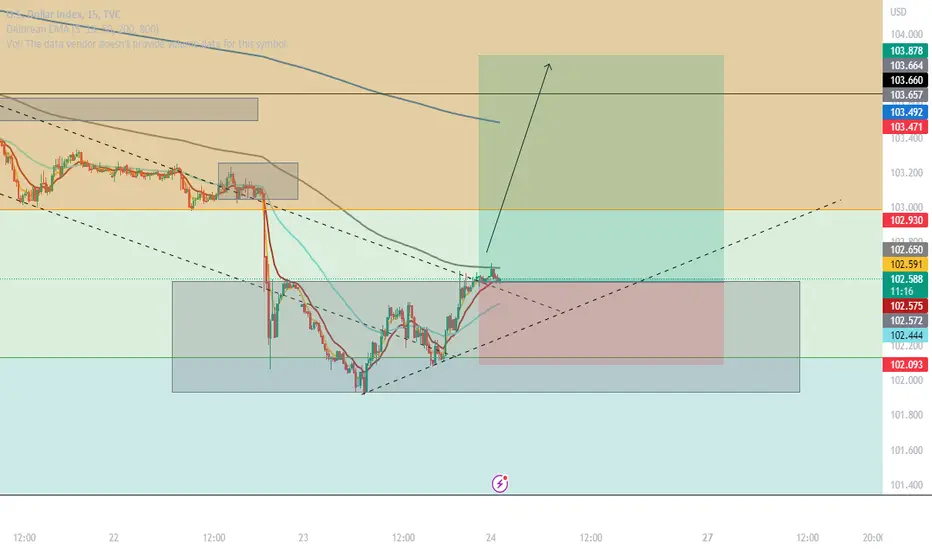
DXY-- Longing opportunity Wednesday-FridayStill feeling very neutral regarding the US Dollar, but in order to extract value
from a market, you have to take risks, and manage those risks properly.
Consider waiting for more confirmation that we are breaking out from this
small timeframe downtrend, and entering on the retest..
Expect more volatility heading into the NYSE open Wednesday, followed by
a lot q/q news, etc. on Thurs & Friday.
As always, happy trading, and Godspeed.
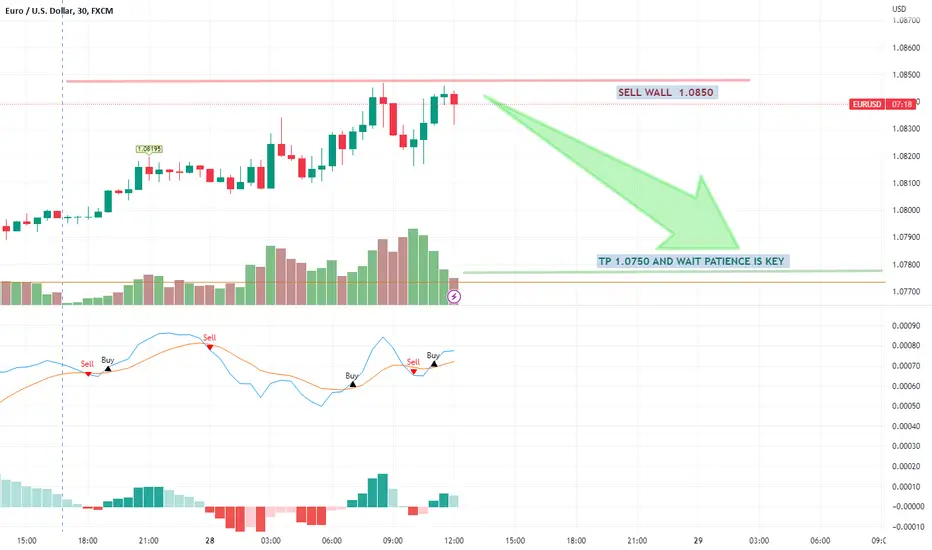
SELL FROM 1.0850 WAIT AND TP 1.0750 Big Data Release this week
do not be Greedy
do not over trade
do not add losers
be patience
1% execution
99 % patience
DXY-- Last trading attempt approaching Friday's openPlease take a look, enjoy, and criticize the last few postings I've made regarding
the DXY this week. Traders know there is not much to say. This truly is a beautiful game we
play. A never ending game, at that. I'm still trying to find my footing, my balance,
if you will, on the TV platform. Who has a question? Who wants to discuss? My
main studies have been on Fibonacci levels, general/typical market structure,
and, of course, the infamous left-wing news power-structure and how it affects
participant sentiment. Go long, baby. He's about to throw it. Just my opinion.
"Keep it simple, stupid."
As always, happy trading, and good luck!
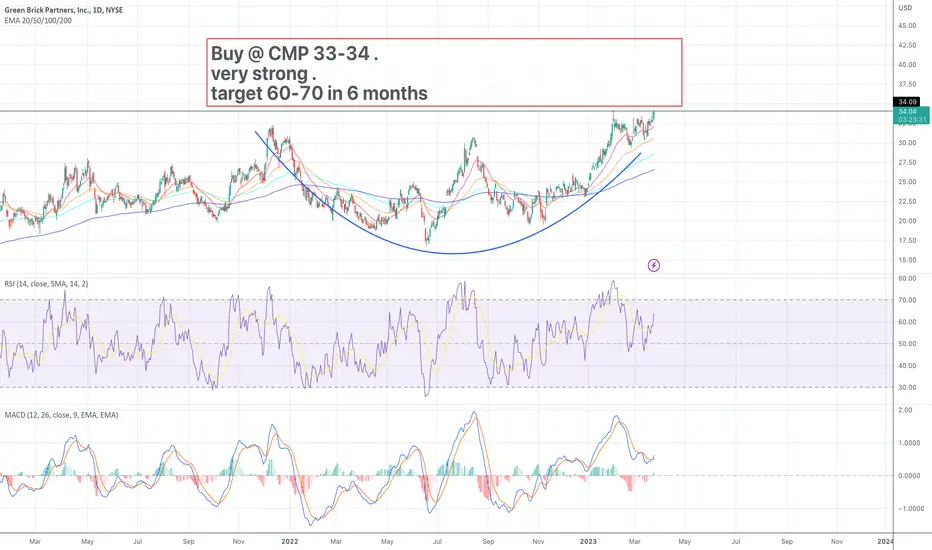
Grbk trending highbuy @ 33-34.
Target 60-70 in 6 month.
this stock is one the few winners in recent corrections.
TARGET reached NVIDIA to $215.54 - and now we just waitCup and Handle formed and broke to the upside.
Since then we have had the price swim nicely to the target at $215.54.
Also, the price has continued up and up which hasn't given us another trade signal.
I guess, we need the price to consolidate and equilibrate before us breakout traders can do anything :)

spx500 is in stage 1 still 1- markets are dynamic
2- when a trend got broken, new one starts not necessarily a reversed of last trend.
3- for now, we can say that, the stage 4 (bearish/ decline faze) has ended.
4- we are now in the end of a stage 1 situation
but, it can go to a stage 2 or new stage 4 . I mean in this situation we cant be sure about the next main trend.
so, being cash or trading with minimum position size and maximum risk management is highly recommended for now.
be aware of volume spike and to see more details go to the daily time-farm.
which daily candles accompanied with a bigger volumes?

Tesla short till 70It's looking weak on charts also fundamental losing the momentum and Volkswagen competition.

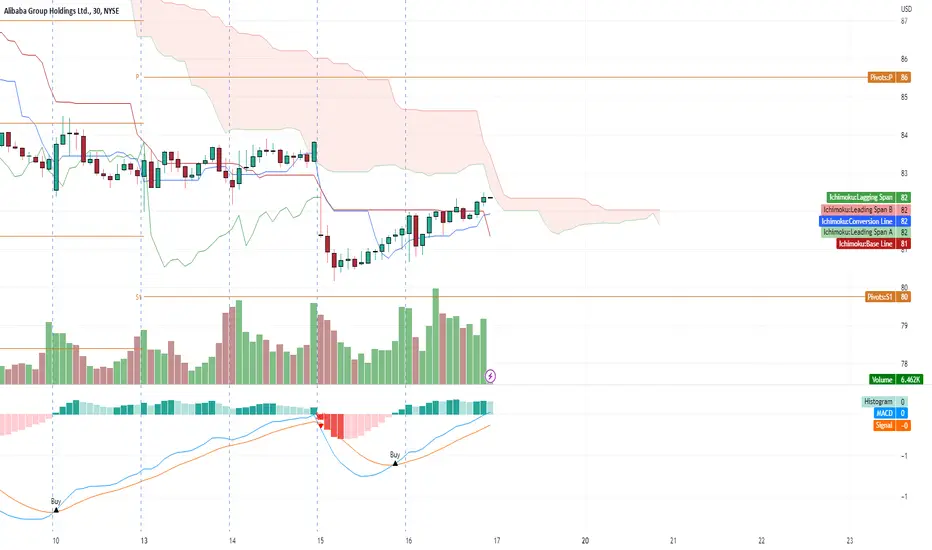
BUY UNTIL BABA 96 Baba Coming back to 100
Stay Profitable
do not add to losers
be patience
HAVE A GOOD WEEKEND !!!