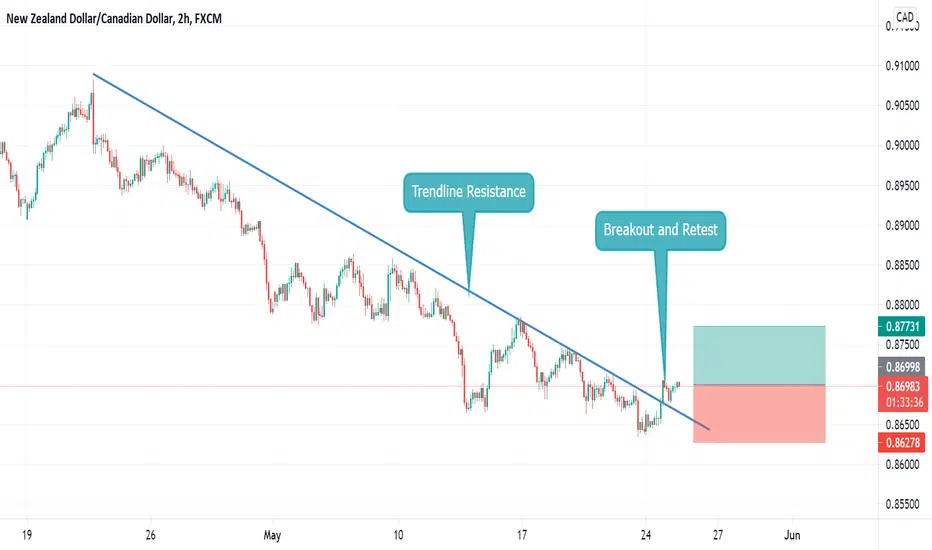
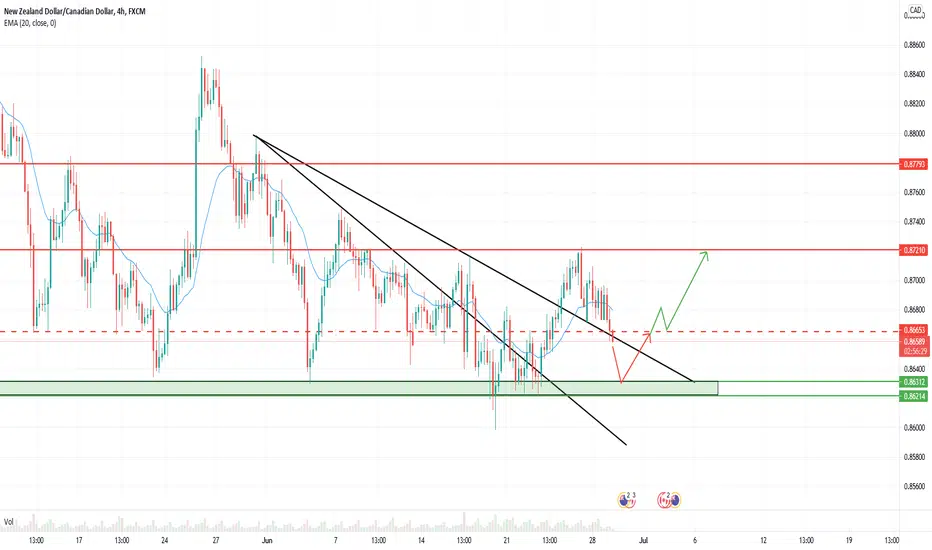
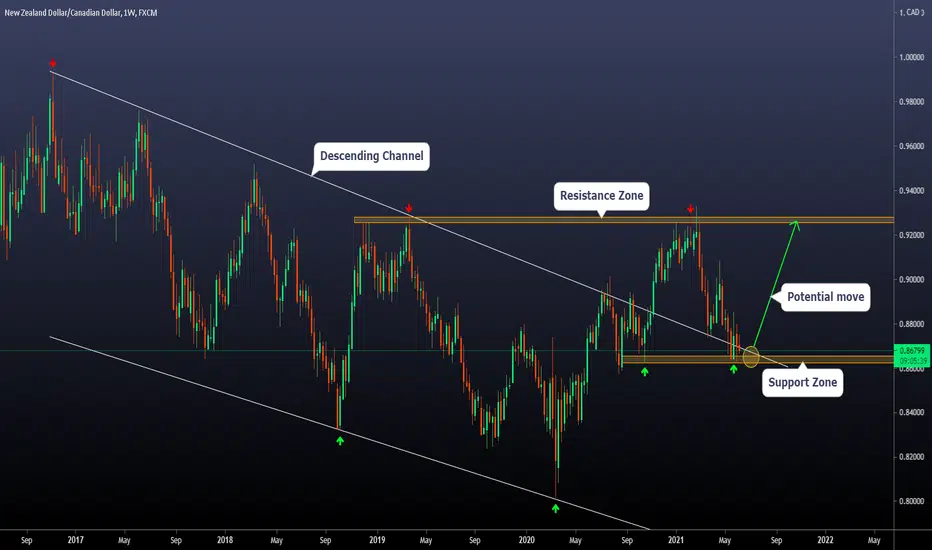
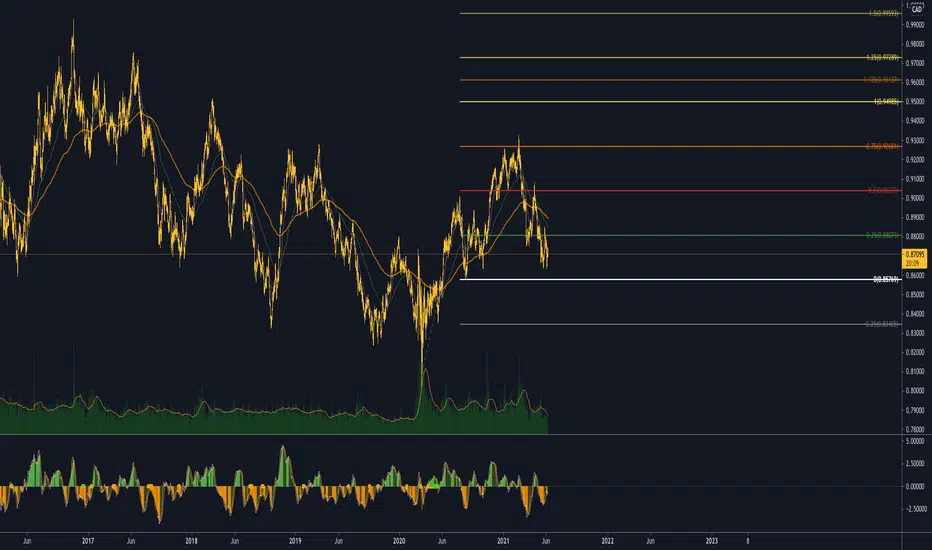
NZDCADA clear break and retest on the weekly chart for a bullish swing trade.
Pls, like and comment.
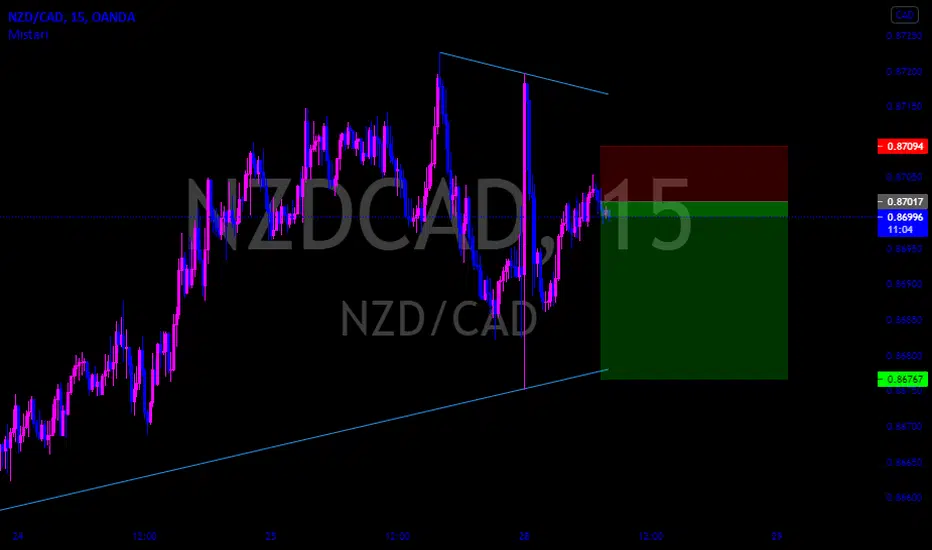
Follow link below on Related idea to see forecast on lower timeframe.
Nzd-cad
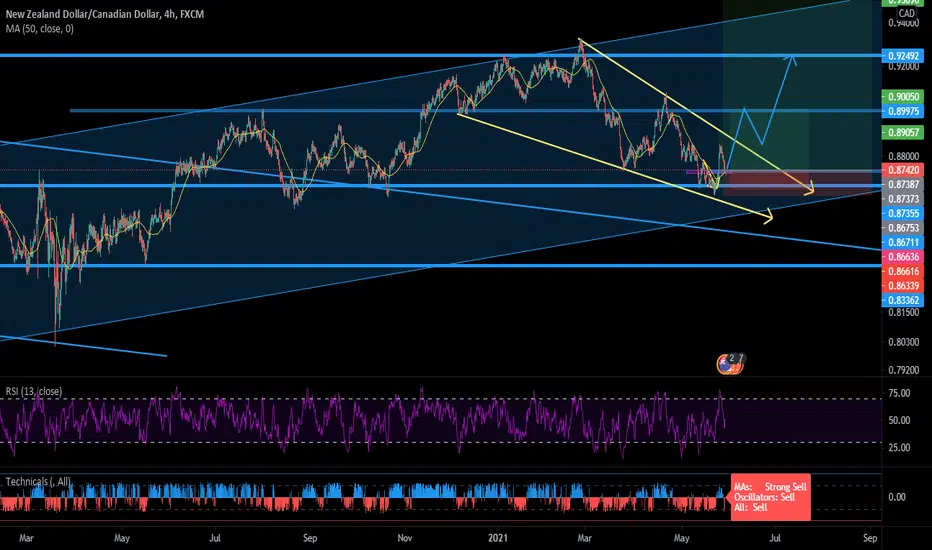
NZDCAD Sell Trade Opportunity (My View)NZDCAD>>>>>>> Shaping Up Nicely For A Sell Trade. Ideal Trade Is Waiting For The Market To Retest The Newly Created Downward Trendline (Higher Highs) Then Enter A Sell. Second Ideal Trade Indicated On Chart With Second TP The New Previous (LOL) Lower Low Created... You Can Alternatively Look For Sell et Ups With SL Slightly Above The Last Higher High Created...
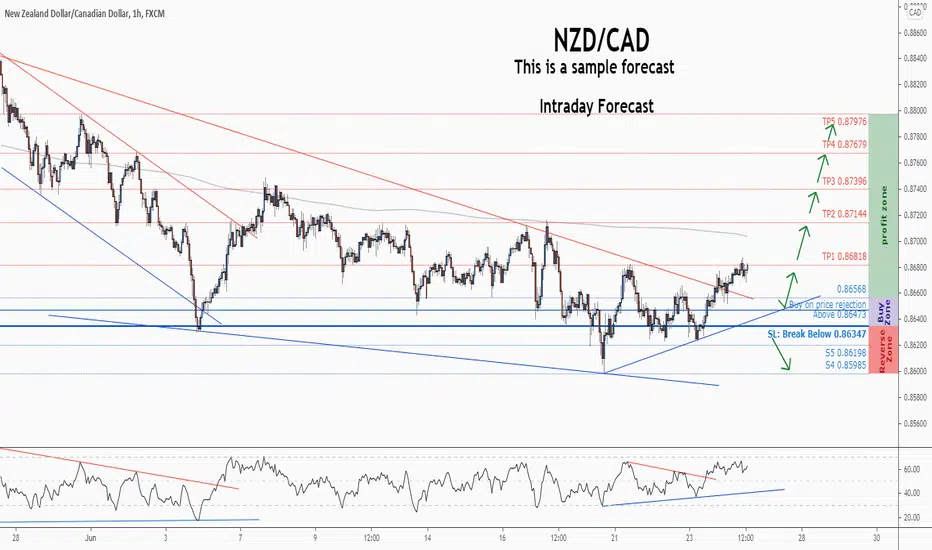
💡Don't miss the great buy opportunity in NZDCADTrading suggestion:
". There is a possibility of temporary retracement to the suggested support line (.086473).
. if so, traders can set orders based on Price Action and expect to reach short-term targets."
Technical analysis:
. NZDCAD is in a range bound, and the beginning of an uptrend is expected.
. The price is below the 21-Day WEMA, which acts as a dynamic resistance.
. The RSI is at 61 .
Take Profits:
TP1= @ 0.86818
TP2= @ 0.87144
TP3= @ 0.87396
TP4= @ 0.87679
TP5= @ 0.87976
SL= Break below S2
❤️ If you find this helpful and want more FREE forecasts in TradingView
. . . . . Please show your support back,
. . . . . . . . Hit the 👍 LIKE button,
. . . . . . . . . . Drop some feedback below in the comment!
❤️ Your support is very much 🙏 appreciated!❤️
💎 Want us to help you become a better Forex / Crypto trader?
Now, It's your turn!
Be sure to leave a comment; let us know how you see this opportunity and forecast.
Trade well, ❤️
ForecastCity English Support Team ❤️

💡Don't miss the great buy opportunity in NZDCADTrading suggestion:
". There is a possibility of temporary retracement to the suggested support line (.086473).
. if so, traders can set orders based on Price Action and expect to reach short-term targets."
Technical analysis:
. NZDCAD is in a range bound, and the beginning of an uptrend is expected.
. The price is below the 21-Day WEMA, which acts as a dynamic resistance.
. The RSI is at 63 .
Take Profits:
TP1= @ 0.86818
TP2= @ 0.87144
TP3= @ 0.87396
TP4= @ 0.87679
TP5= @ 0.87976
SL= Break below S2
❤️ If you find this helpful and want more FREE forecasts in TradingView
. . . . . Please show your support back,
. . . . . . . . Hit the 👍 LIKE button,
. . . . . . . . . . Drop some feedback below in the comment!
❤️ Your support is very much 🙏 appreciated!❤️
💎 Want us to help you become a better Forex / Crypto trader?
Now, It's your turn!
Be sure to leave a comment; let us know how you see this opportunity and forecast.
Trade well, ❤️
ForecastCity English Support Team ❤️
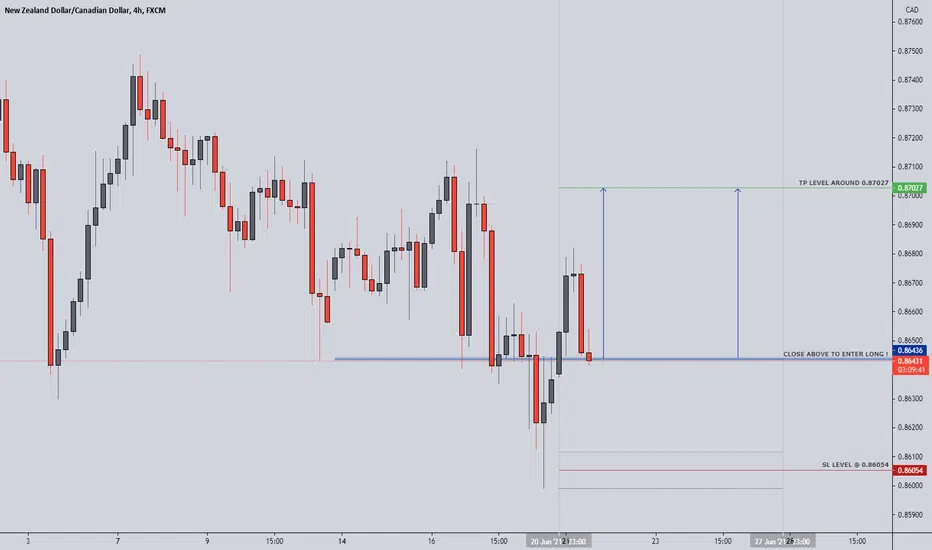
NZDCAD - FOREX - 21. JUNE. 2021Welcome to our weekly trade setup ( NZDCAD )!
-
1 HOUR
Bullish price action after closing above main sr level.
4 HOUR
Overall bullish market structure.
DAILY
Expecting further bullish price action.
-
FOREX SETUP
BUY NZDCAD
ENTRY LEVEL @ 0.86430
SL @ 0.86050
TP @ 0.87030
Max Risk: 0.5% - 1%!
(Remember to add a few pips to all levels - different Brokers!)
Leave us a comment or like to keep our content for free and alive.
Have a great week everyone!
ALAN
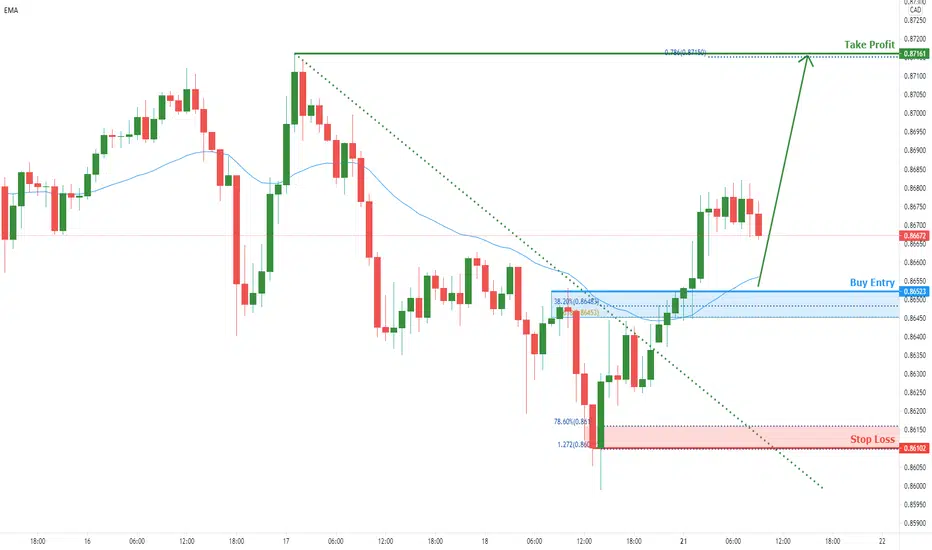
NZDCAD bullish breakout | 21st June 2021NZDCAD has shown a bullish breakout from the descending trendline resistance-turned-support and is now holding above the moving average support. We could see a bounce at Buy Entry level, in line with 38.2% Fibonacci retracement, 61.8% Fibonacci extension, horizontal pullback support and moving average support, and further upside towards Take Profit level, in line with 61.8% Fibonacci extension and horizontal swing high resistance.
Any opinions, news, research, analyses, prices, other information, or links to third-party sites contained on this website are provided on an "as-is" basis, as general market commentary, and do not constitute investment advice. The market commentary has not been prepared in accordance with legal requirements designed to promote the independence of investment research, and it is therefore not subject to any prohibition on dealing ahead of dissemination. Although this commentary is not produced by an independent source, FXCM takes all sufficient steps to eliminate or prevent any conflicts of interest arising out of the production and dissemination of this communication. The employees of FXCM commit to acting in the clients' best interests and represent their views without misleading, deceiving, or otherwise impairing the clients' ability to make informed investment decisions. For more information about the FXCM's internal organizational and administrative arrangements for the prevention of conflicts, please refer to the Firms' Managing Conflicts Policy. Please ensure that you read and understand our Full Disclaimer and Liability provision concerning the foregoing Information, which can be accessed on the website.
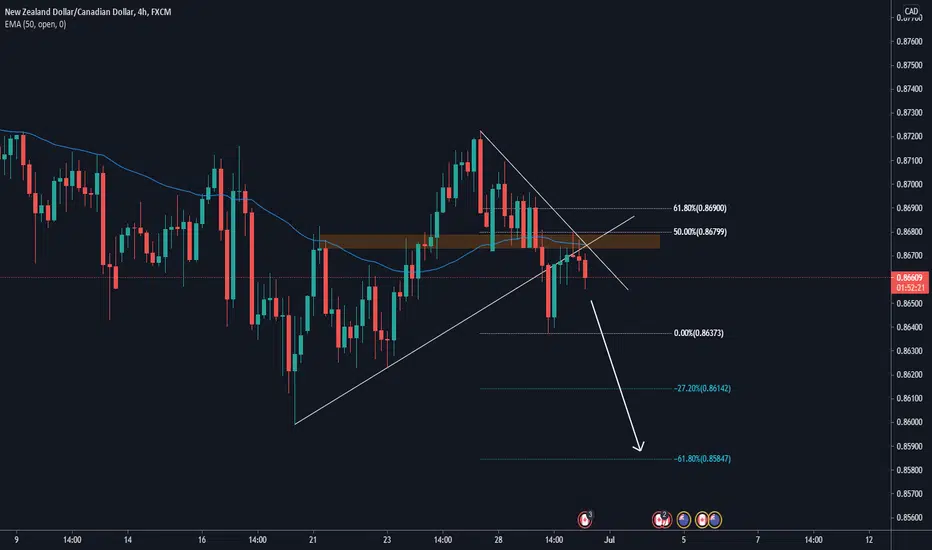
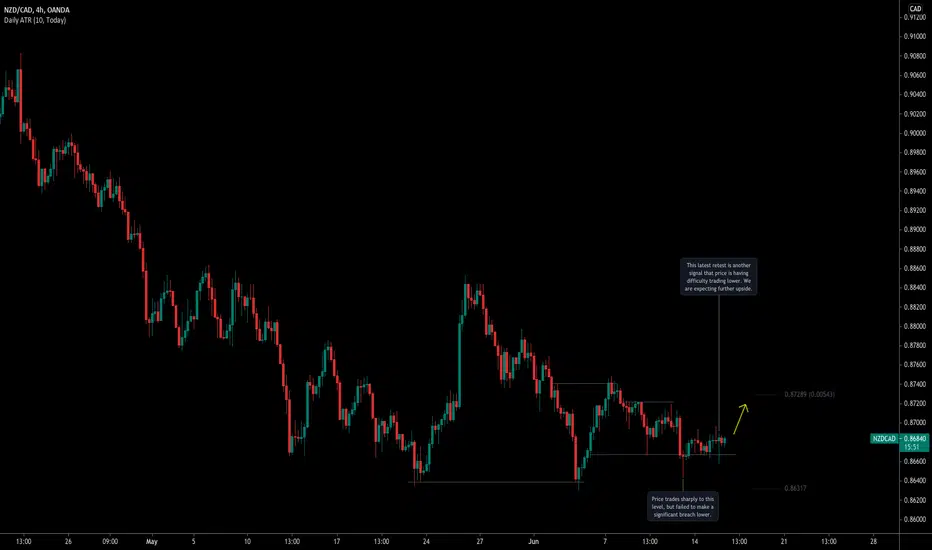
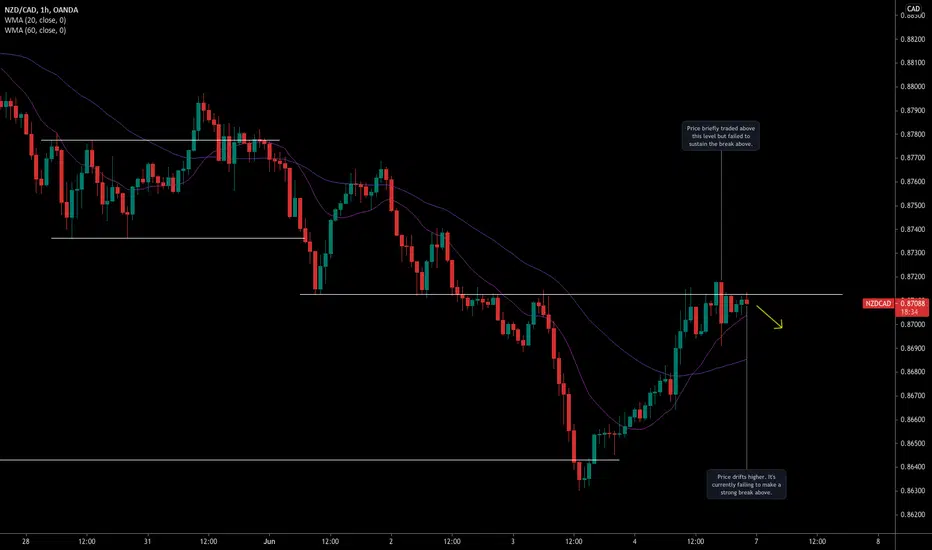
NZDCAD To Hold Above 0.86675See Signposts for key price action details.
This is actually my second attempt. My original trade got stopped out due to the choppiness of this pair. Set a wider stop based on a 2x ATR over on the 4-hour time frame. Expecting this to be a longer term play.
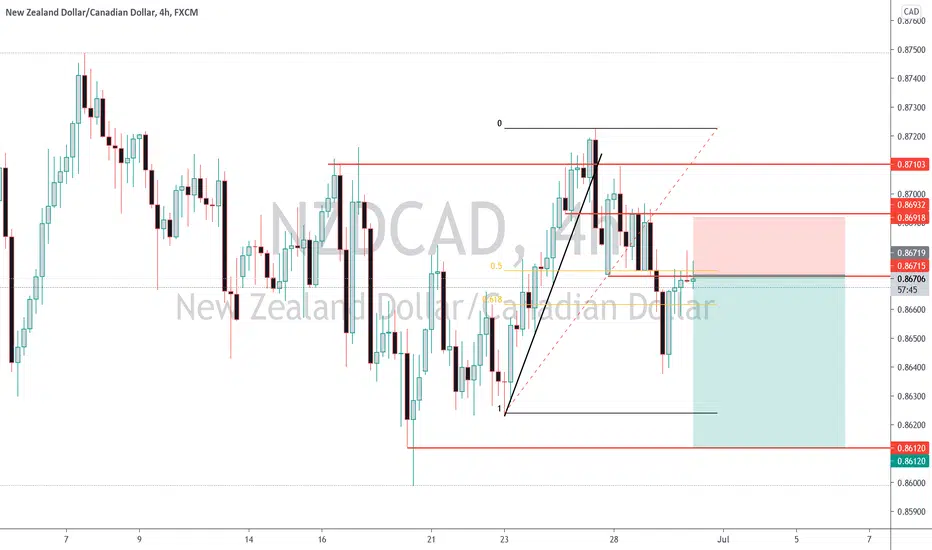
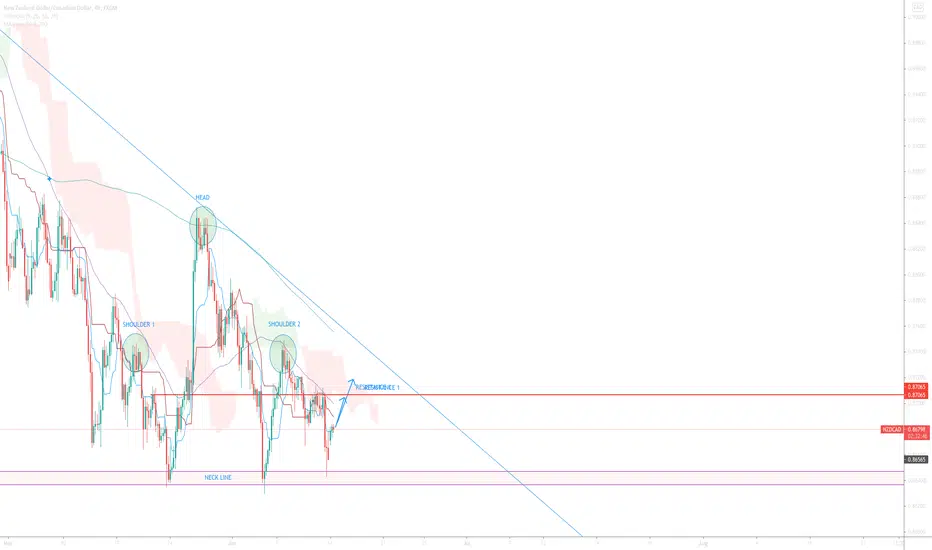
NZD/CAD H4 Possible Shoulder-Head-Shoulder pattern reversal?Spotted a possible upside movement for NZD/CAD from a Head-Shoulder-Head pattern on H4 timeframe.
Feel free to correct me, any constructive criticism is welcome!
FX:NZDCAD
NZD/CAD Preparing for a new Rally?Good morning traders! Today we will analyze NZD/CAD as we detect a potential bullish trade. This situation is not ready since we are analyzing a high timeframe, but we want to be ready when the situation arises.
It is ALWAYS advisable to anticipate the price and state what we are looking for to plan the trade correctly and manage it in the best possible way. This makes us eliminate most of our emotions during the trade since we will have all the possible scenarios contemplated and assumed.
🔸Now we go to the technical aspect:
- In the weekly chart (posted on the idea), we see that the price broke a bearish channel that was active for approximately 5 years. Then, on the rise, it faced the resistance zone and from there began a corrective process.
- It is facing a strong support zone, formed by the broken trend line + a strong demand zone.
- Although it is an interesting level, we should wait for some confirmations for the situation to develop.
🔸We will expect the following:
- This is the daily chart, here we see the Descending Trendline of the current structure. What we are waiting for is a breakout + correction pattern. If this happens, we will pose a bullish trade after the correction breakout and look for a target towards the next resistance zone. In this way, we maximize the R/R ratio.
NZDCAD testing 1st resistance, potential for reversal!Price is testing the 1st resistance, in line with 50% Fibonacci retracement, 127.2% Fibonacci extension, horizontal pullback resistance and descending trendline resistance. We could see a reversal here and further downside towards 1st support, in line with 100%, 127.2% Fibonacci extension and horizontal swing low support. Price is also holding below the descending trendline and moving average resistances, showing signs of bearish pressure in line with our analysis.
Trading CFDs on margin carries high risk.
Losses can exceed the initial investment so please ensure you fully understand the risks.

NZDCAD - FORECASTHere is a FOREX trade for all you currency traders. If you're into holding foreign currency for long term this chart might interest you.
NZDCAD is in the buy zone after a nice move up showing some bullish sentiment. I'm looking to long here, lower or if you just need further confirmation get in as it breaks out of the green line. Worth the risk at the price IMO. Stoploss below white line, take profits at colored lines above. THIS IS NOT FINANCIAL ADVICE, DO NOT BLINDLY FOLLOW THIS TRACE.
NZDCAD testing descending trendline resistance, drop incoming!Price is testing the descending trendline resistance and holding below 1st resistance, in line with 61.8% Fibonacci retracement, 161.8% Fibonacci extension and horizontal pullback resistance. We could see a reversal here and further downside towards 1st support, in line with 61.8% Fibonacci extension and horizontal swing low support. Stochastics is also testing the 94.05 resistance where it has reversed from before, showing signs of bearish pressure in line with our analysis.
Trading CFDs on margin carries high risk.
Losses can exceed the initial investment so please ensure you fully understand the risks.

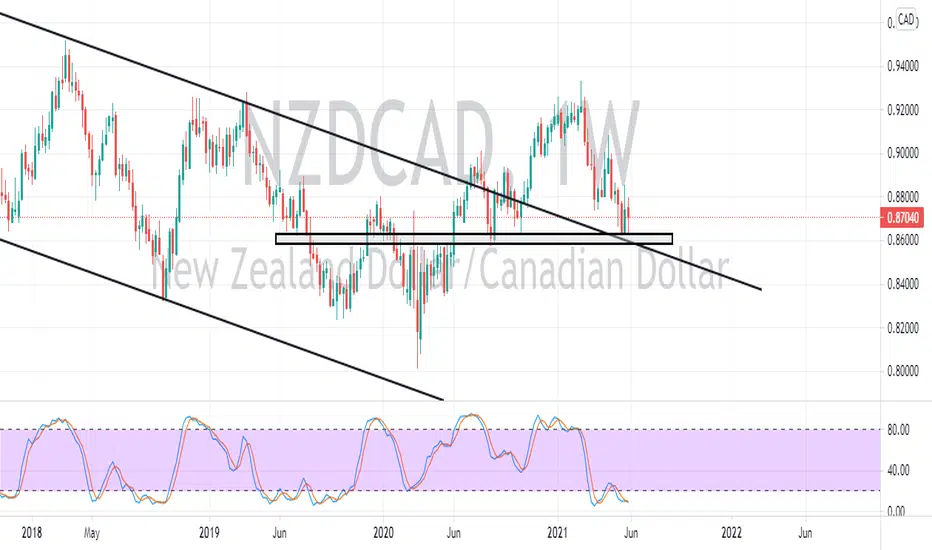
NZDCAD BULLISH WEEK?looking on the weekly we have a beautiful retest of the broken trendline and now has hit the support on weekly looks like a double bottom
zoom into the daily and we see that we already see another double bottom happening followed by a almost a engulfing bull
on the 4h i see price is rejecting the current down trend it is in and ready to shoot back down probably to form another double bottom on 4h with the correct price action rejection etc i will enter and if if price makes another HH on 4h i will wait for retest for another position
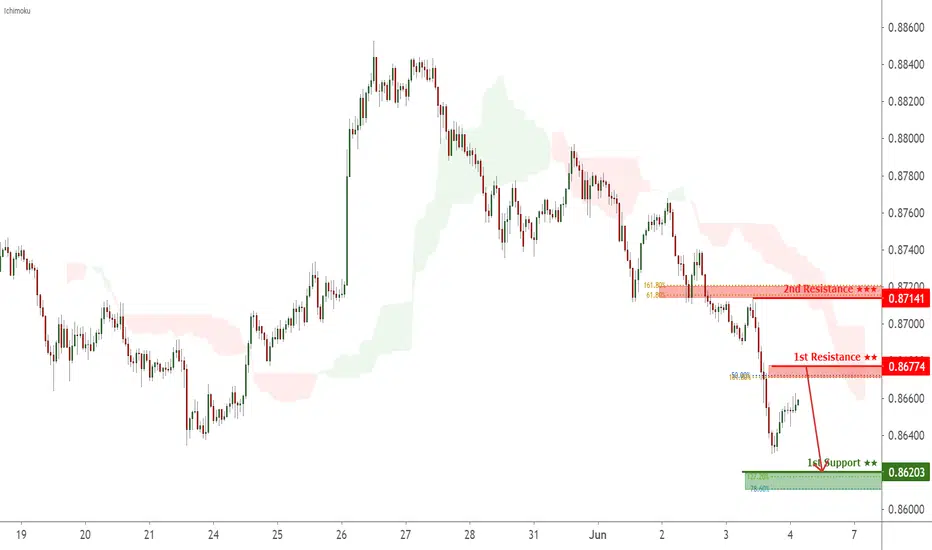
NZDCAD facing bearish pressure, potential for further downside!Prices are facing bearish pressure from 50% Fibonacci retracement and 161.8% Fibonacci extension Fibonacci confluence zone. Prices might push down towards 127.2% Fibonacci retracement and 78.6% Fibonacci extension fibonacci confluence zone. If price pushes up further, prices might face resistance from horizontal swing high resistance in line with 61.8% Fibonacci retracement and 161.8% Fibonacci extension. Ichimoku cloud is also above prices, showing a bearish pressure for prices.
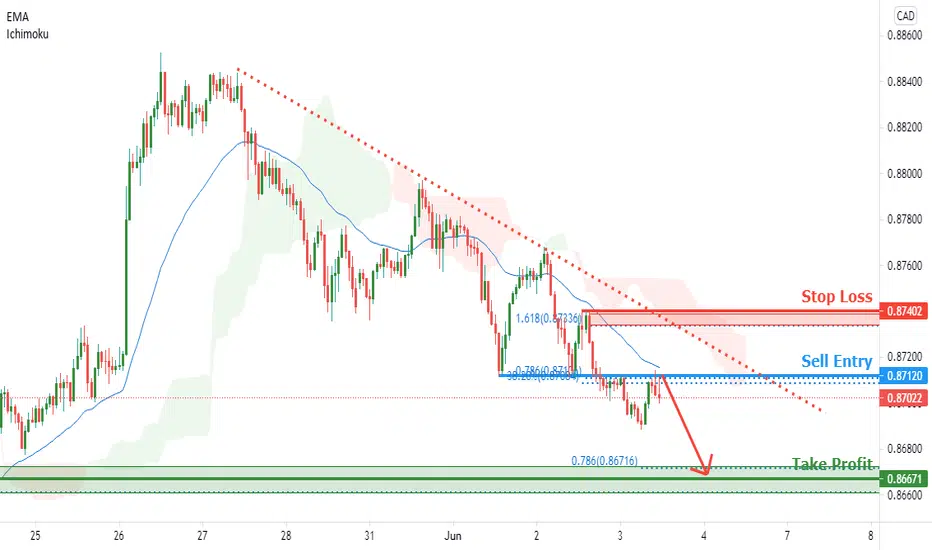
NZDCAD facing bearish pressure | 3rd June 2021ZDCAD is approaching Sell Entry level, in line with 38.2% Fibonacci retracement , 78.6% Fibonacci extension and horizontal pullback resistance, where we could see a reversal and further downside towards 1st Support, in line with 78.6% Fibonacci extension , 88% Fibonacci retracement and horizontal pullback support. Price is also holding below moving average resistance as well.
Any opinions, news, research, analyses, prices, other information, or links to third-party sites contained on this website are provided on an "as-is" basis, as general market commentary and do not constitute investment advice. The market commentary has not been prepared in accordance with legal requirements designed to promote the independence of investment research, and it is therefore not subject to any prohibition on dealing ahead of dissemination. Although this commentary is not produced by an independent source, FXCM takes all sufficient steps to eliminate or prevent any conflicts of interests arising out of the production and dissemination of this communication. The employees of FXCM commit to acting in the clients' best interests and represent their views without misleading, deceiving, or otherwise impairing the clients' ability to make informed investment decisions. For more information about the FXCM's internal organizational and administrative arrangements for the prevention of conflicts, please refer to the Firms' Managing Conflicts Policy. Please ensure that you read and understand our Full Disclaimer and Liability provision concerning the foregoing Information, which can be accessed here.
nzdcadour last week buy bias played out which was actually a breakout and did the retest before the week closed, price action should determine when to continue the buy, last week candle close looks good to have a buy bias and in an uptrend channel, happy trading week...
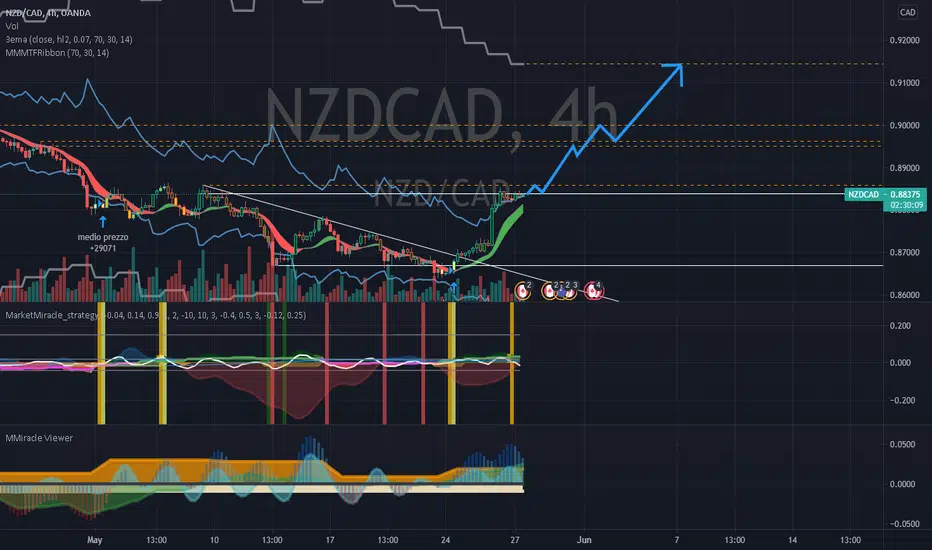
NZDCAD up up and up againMy Marketmiracle advisor provided an input signal on the NZDCAD cross forex
at the price 0,883250
with target 0,914329
for a possible profit of 3.52% which on forex is a lot
Analyzing the graph we realize how we are actually at the point of possible rupture in a head shoulders upside down so at the rupture of this the price could start quickly towards the target.
Actually, the LONG interest on NZDCAD is increasing a lot ( see Mmiracle Viewer indicator)
The scenario is possible in my opinion so I decided to take positions on the cross in this regard.
NZDCAD was already climbing and the previous analysis had provided a perfect signal as per related idea
This idea is based on a signal generated by the advisor Marketmiracle, down on this page you will find the link to the page of signals of the advisor that you can see for free without any cost or registration
Below are also the results of the backtest of Miraclemarket on this cross
NZDCAD long set upWait for price to retrace to around 50% level...based on candle confirmation, one can go long for tgt shown
BUY ON NZDCADHello, my fellow traders hope you all are making some profits. We are here with our new analysis so that we can increase those profits for you. Let’s get into it.
As we can see, the price broke from its TRENDLINE RESISTANCE and did a RETEST.
Let us know your views on this in the comment section. Thank you all.
There is good news for our followers. We will be analyzing on-demand.
So let us know which pair you want our analysis on, and we will get it for you. Do like and follow us.