Nzd-cad
NZDCAD | DAILY SESSION | SHORTLooking for a continuation down based on the weakness of the CAD. Will also need to monitor the AUD to ensure it is strong for the session.
Big Picture View
Strong: NZD
Weak: CAD
This trade is valid until 29/06/2020 @ 9 pm BST.
Follow me on Tradingview or DM in the chat.
Don't forget to hit the like button
🐉 HAPPY TRADING 🐉
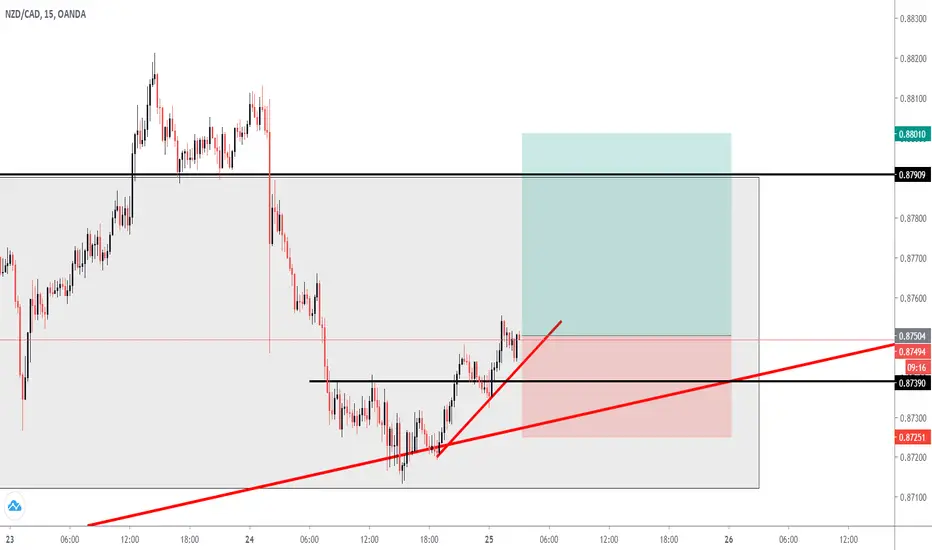
NZD CAD SELL (NEW ZEALAND DOLLAR - CANADIAN DOLLAR)Hi there. Price is forming a reversal pattern to change its formation. Watch strong price action at the current levels for sell.
NZDCAD LONG TRADE IDEAHello guys, here is the trade plan for NZDCAD. For trade details please refer to the chart. If you guys like my analysis please hit like. Thanks.
NZDCAD SHORT TRADE SETUP FOR INTRADAY TRADENZDCAD SHORT TRADE SETUP FOR INTRADAY TRADE
Please manage your risk. Use Stop loss. And do not take blind entries.
If you have question let me know. If you want to analyze any pair let me know.
This is just an idea. What we see.
Market can go in the opposite direction, what we analyze. so we have to manage our risk and adopt the situation accordingly.
NZDCAD Long SetupLong : 0.87335
Stop : 0.87100
Target : 0.87600 , 0.87800
Will Take very small position
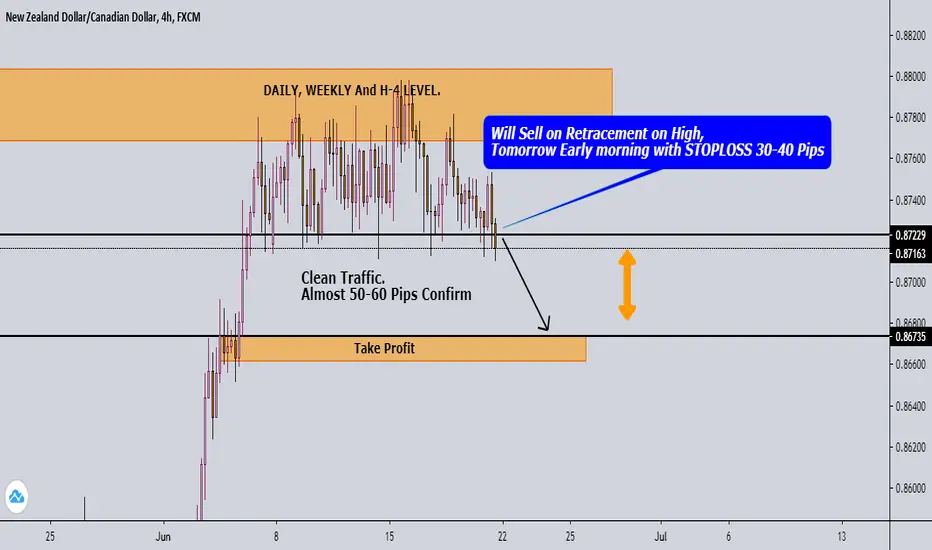
NZD/CAD FULL ANALYSIS: Sell opportunityHi traders,
Here's a possible sell opportunity in NZD/CAD. The pair has been in a nice downtrend for a longer period now, and is currently trading at a major resistance level near the 0.88 round-number. The resistance also aligns with the 61.8% Fib level.
Positioning data and recovering oil prices support a sell as well.
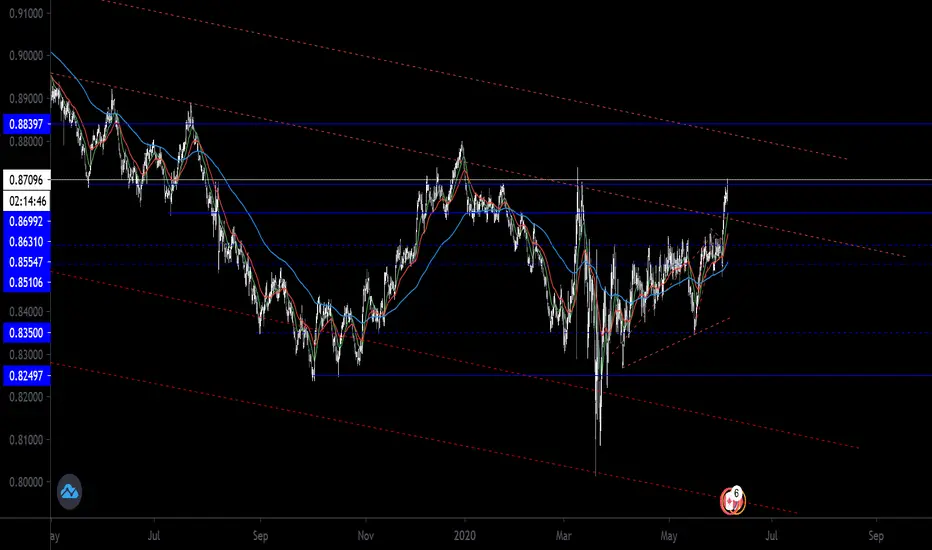
Here's a chart of current 2y yield differentials which are pointing lower, so the price might have to catch up with the divergence.
Please hit the "LIKE" button to support our free work. Thanks!

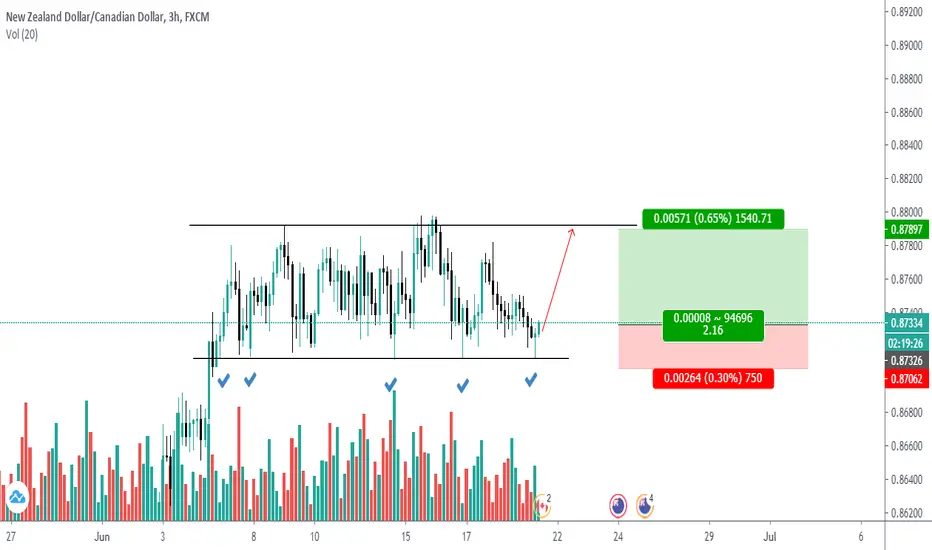
NZDCAD - ShortLooking for a triple top, price has been on a strong bullish push, now seeming to have slowed and met temporary resistance, looking to fade down, good RR offered with a SL above the most recent high to give the trade room to breath.
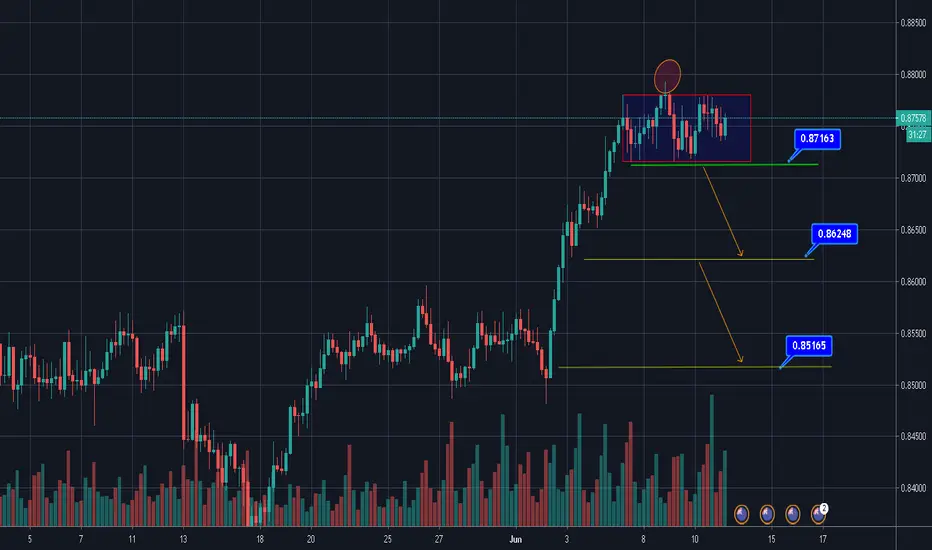
Great Sell Opportunity for the NZDCAD A price channel with a false penetration from above.
An Opportunity to sell with a break of 0.8714 .
Targets are : 0.8624 and 0.8516
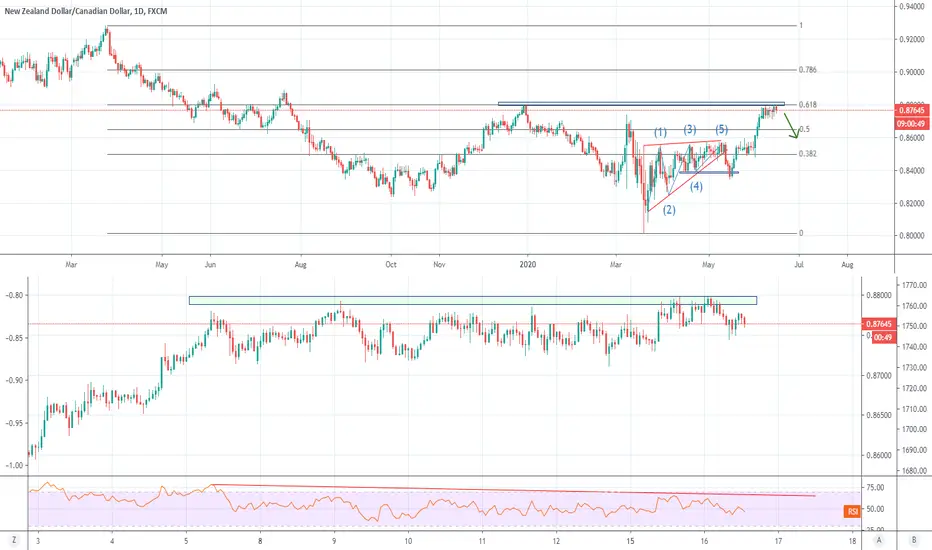
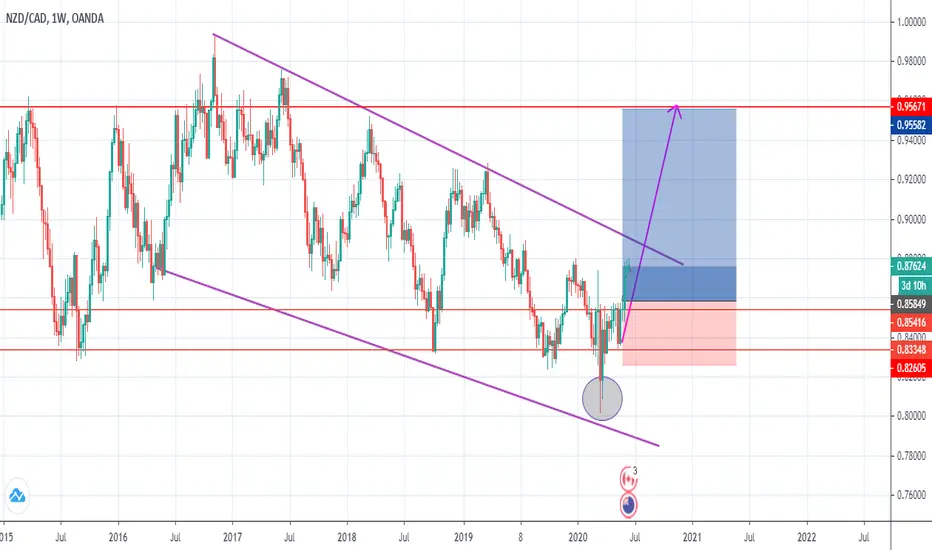
NZDCAD swing - inverse H&S on the monthly possibleMonthly resistance in Red, probable sell area.
Weekly support in blue, targets for sell. Close 75% at first target and leave 25% for the 2nd target with SL at entry.
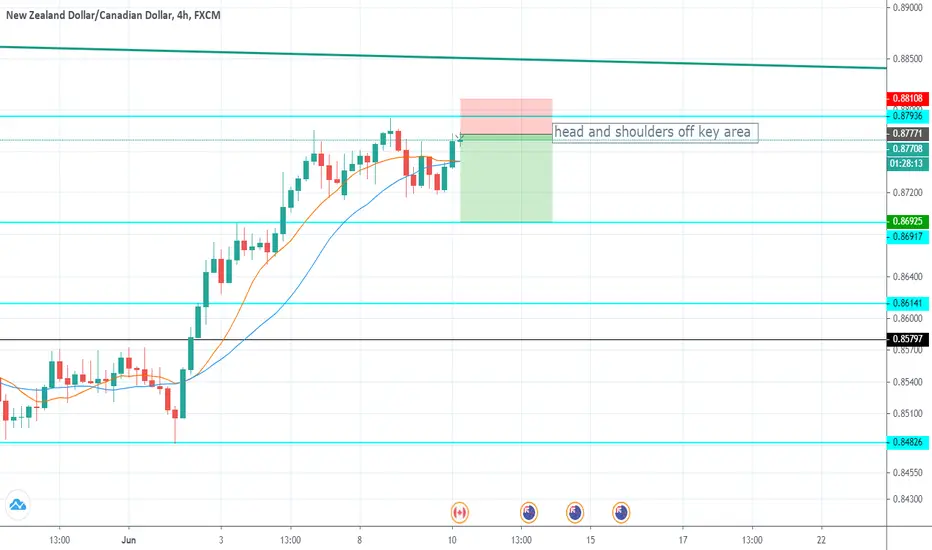
NZDCAD SELL reversing head and shoulders off key areaNZDCAD SELL
start: 0.87771
stop loss: 0.88108
take profit: 0.86925
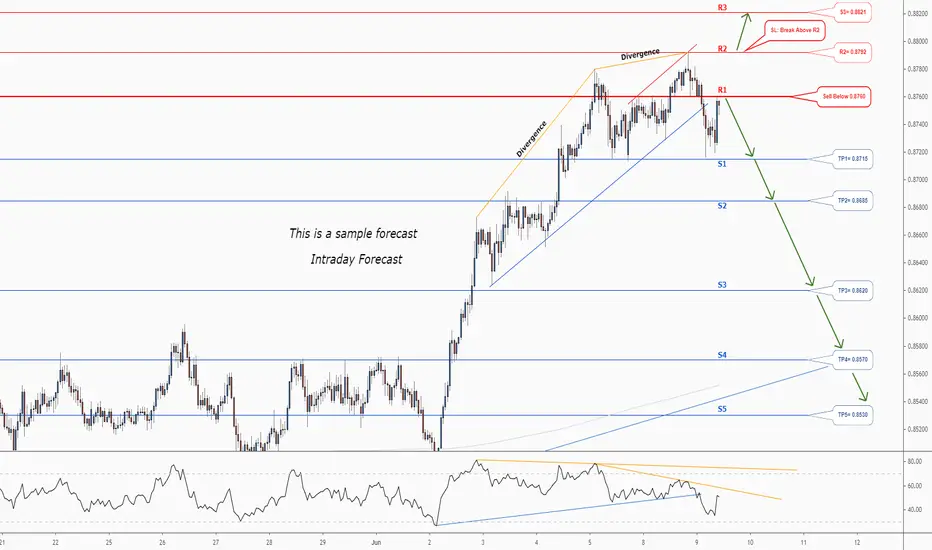
Don't miss the great sell opportunity in NZDCADTrading suggestion:
. There is still a possibility of temporary retracement to suggested resistance line (0.876). if so, traders can set orders based on Price Action and expect to reach short-term targets.
Technical analysis:
. NZDCAD is in a range bound and the beginning of downtrend is expected.
.The price is above the 21-Day WEMA which acts as a dynamic support.
. The RSI is at 40.
Take Profits:
TP1= @ 0.8715
TP2= @ 0.8685
TP3= @ 0.8620
TP4= @ 0.8570
TP5= @ 0.8530
SL: Break Above R2
❤️ If you find this helpful and want more FREE forecasts in TradingView
. . . . . Please show your support back,
. . . . . . . . Hit the 👍 LIKE button,
. . . . . . . . . . . Drop some feedback below in the comment!
❤️ Your Support is very much 🙏 appreciated! ❤️
💎 Want us to help you become a better Forex trader?
Now, It's your turn!
Be sure to leave a comment let us know how do you see this opportunity and forecast.
Trade well, ❤️
ForecastCity English Support Team ❤️
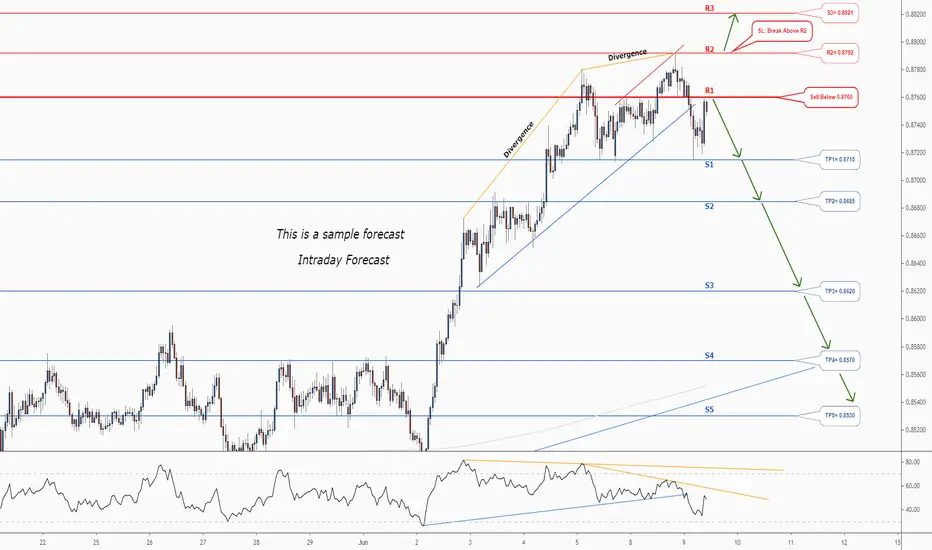
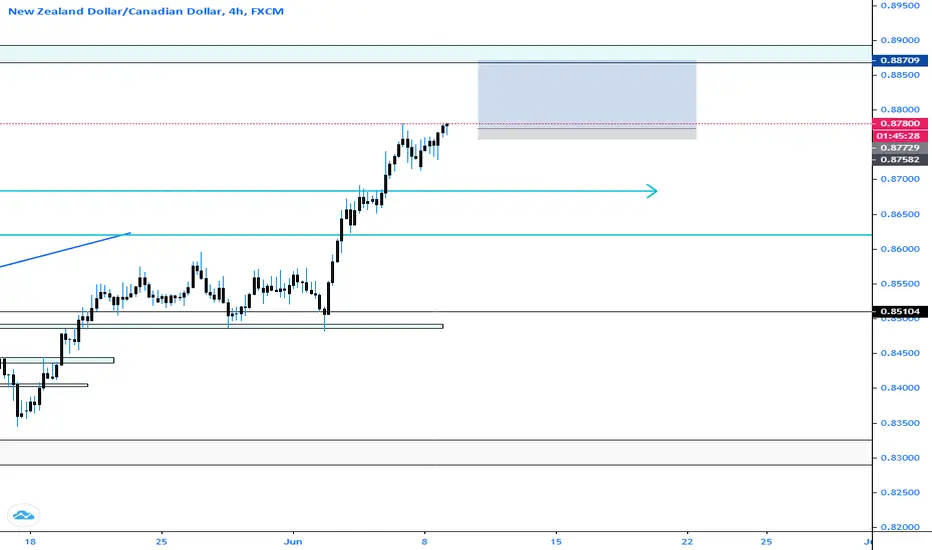
NZD/CAD Time for a Retracement by ThinkingAntsOk🔸 4H CHART EXPLANATION:
.
🔸 Price broke the Descending Trendline and made a strong upside move.
.
🔸 Now, it is facing the Resistance Zone.
.
🔸 We are waiting for a definition here. If price breaks to the upside, then the target would be the Descending Trendline, and, if price bounces, then the target zone is the Support Zone.
.
🔸 Will look for a lower timeframe setup when the direction is clear.
🔸 DAILY CHART ANALYSIS:
NZDCADPrice failed bullish movement last night due to EURUSD pullback, hoping for now to take its movement up

Bullish TrendBullish on multiply timeframes W1-H1.
Take Profit: 0.88000
Stop Loss: 0.86400
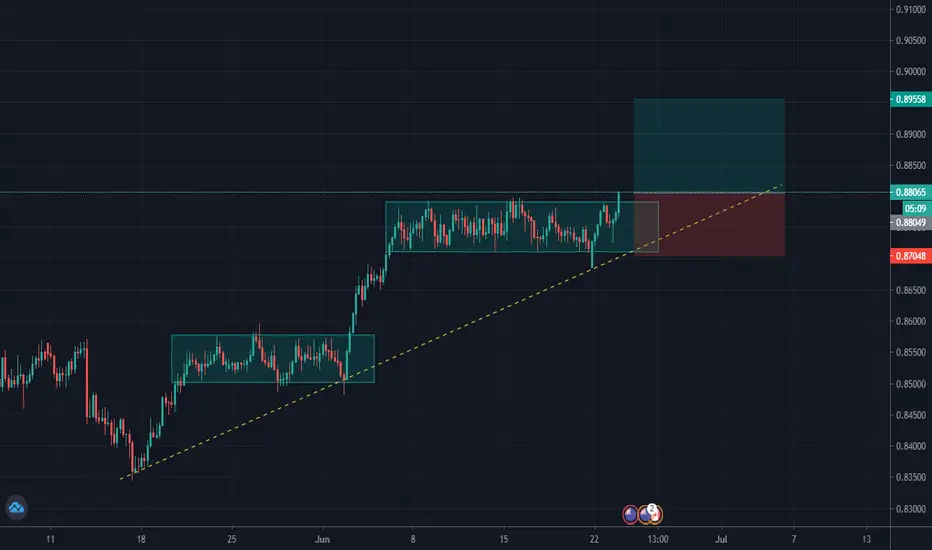
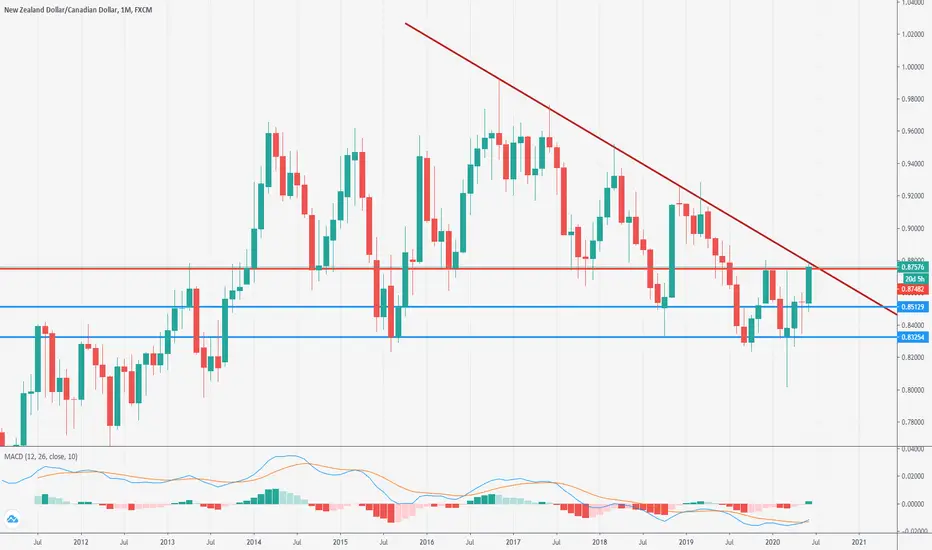
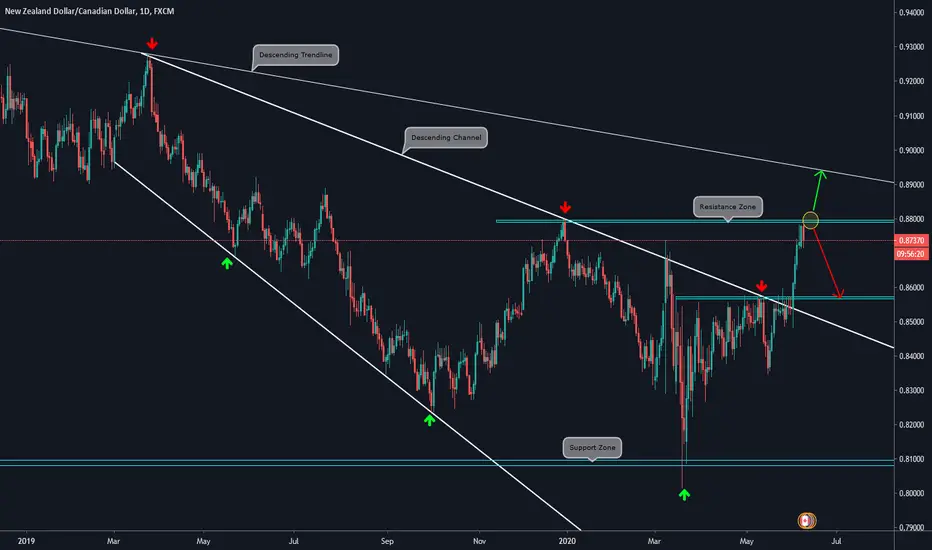
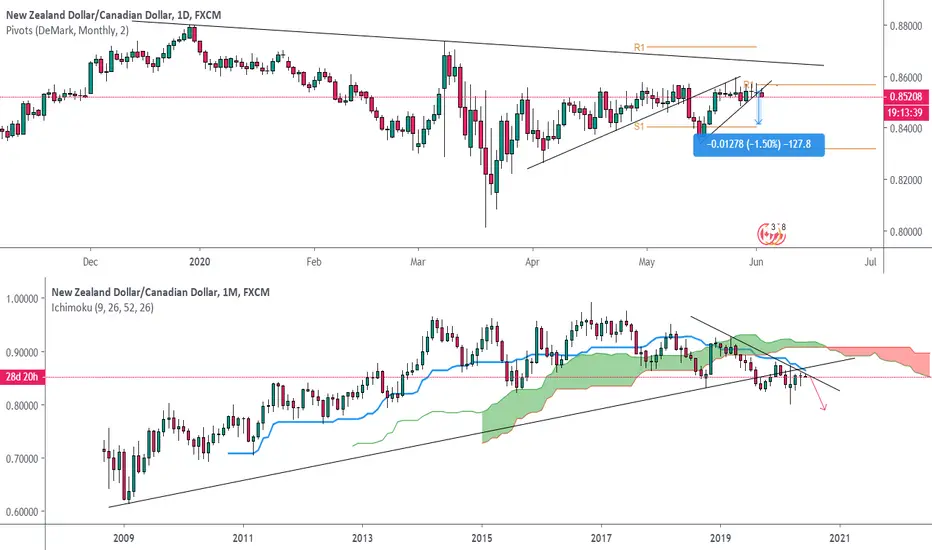
From 04-11-16 price has been bearish till 23-03-20 due to coronavirus price had hyperextended bearish, testing the trendline low. Since 28-03-19 high price has trended bearish currently price is above trendline. This could suggest that price has reversed from March low and now is bullish with possible target of 0.88910. However, price is currently finding resistance at 50%-0.86510 retracement from 03/2019.
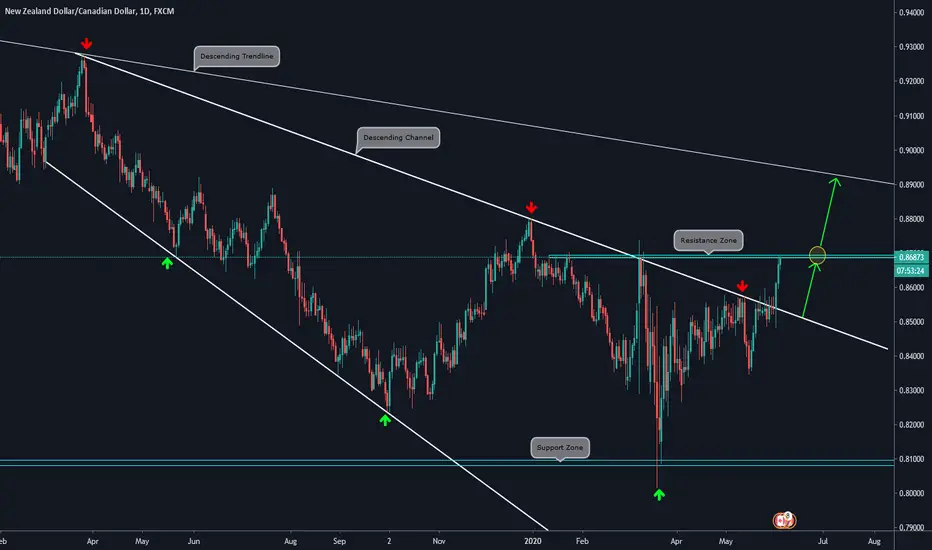
NZD/CAD On the Resistance Zone by ThinkingAntsOk🔸 DAILY CHART EXPLANATION:
.
.
🔸 Price made a strong upside move that broke the Descending Trendline.
.
🔸 At this level it can bounce and make a corrective move towards the 0.85500 Zone.
.
🔸 If the level can not hold the price, then the bullish impulse could continue towards the Weekly Descending Trendline.
.
🔸 Will look for a lower timeframe setup.
🔸4H CHART ANALYSIS:
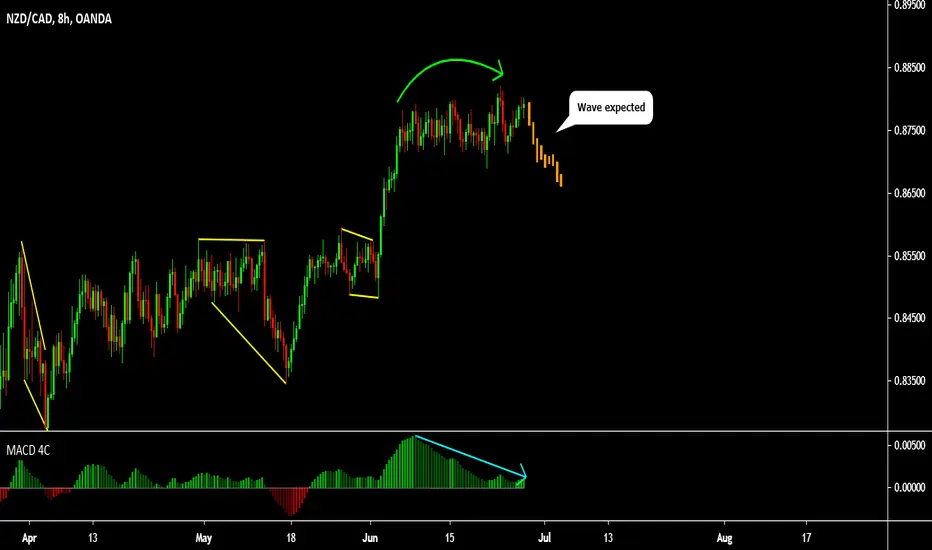
Several breakdownsPrice broke down through longterm uptrendline on monthly + smaller uptrendlines on daily and now it hit major resistance downtrendline on monthly (its like a roof) as you see and is likely to drop a lot this week as weekly pivot range is very thin. My 1st short target is some 70 pips down at 84.676.
For educational purposes only.
NZDCAD. Drop to target.
Hello dear subscribers!
The price of this currency pair has approached the resistance level.
The price will fall to the target,
it is at around 0.85000.
Good luck to you.
If you liked this idea, please like and subscribe to my profile.
This idea does not provide the financial advice.

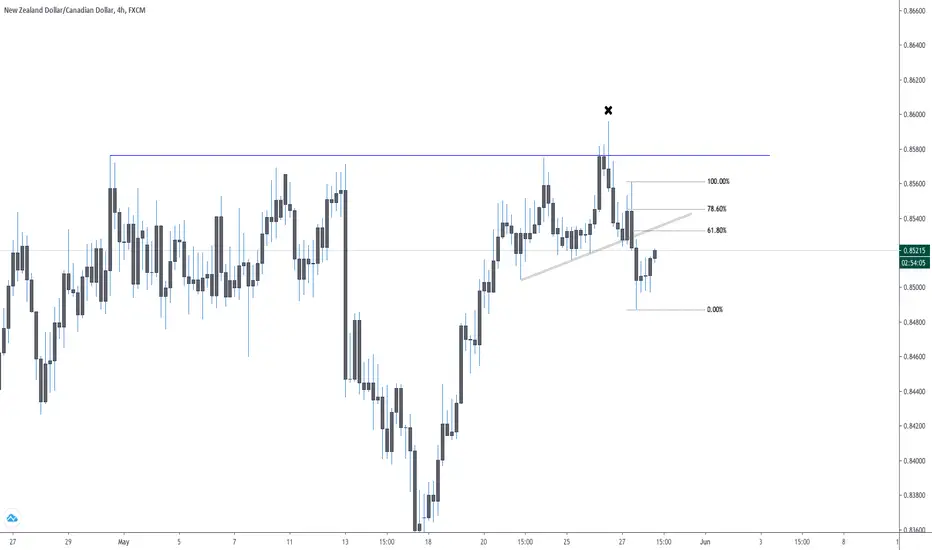
NZDCAD - Clarity at last After weeks of messy PA, previous week NZDCAD experienced a massive meltdown, followed by a very big rally to the upside. Back to 0.85500 once a again. A big order hunt above the liquidity pool occurred that caused the sell off to continue quite rapidly. Price has now broken structure and a lower high formation could provide a good set up