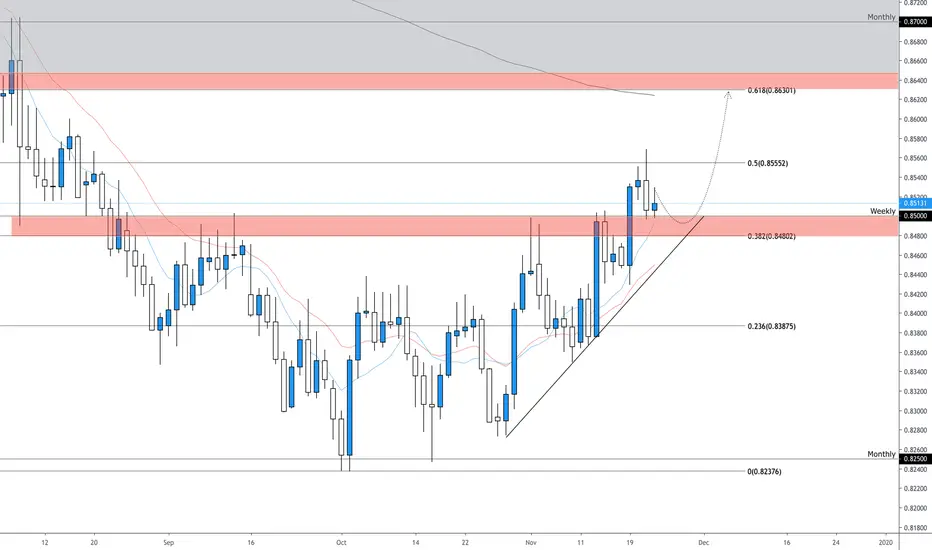
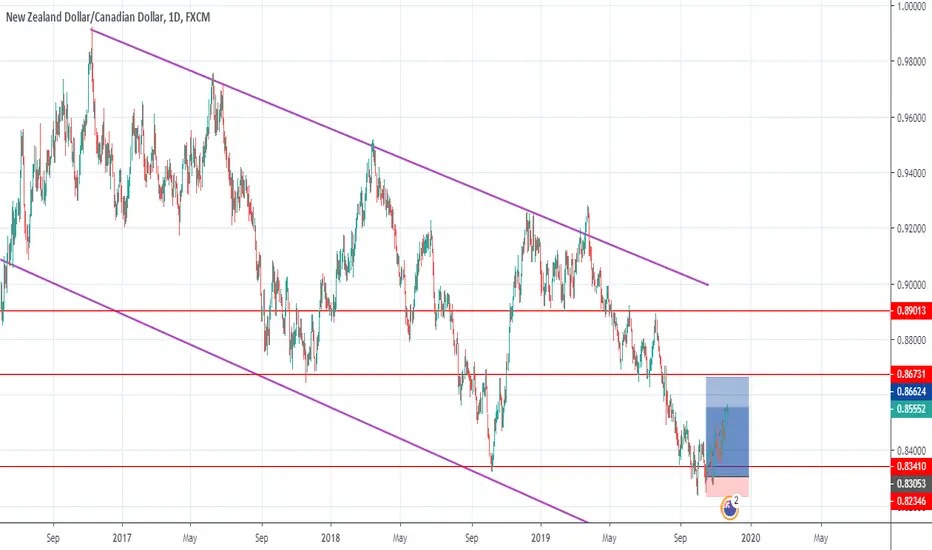
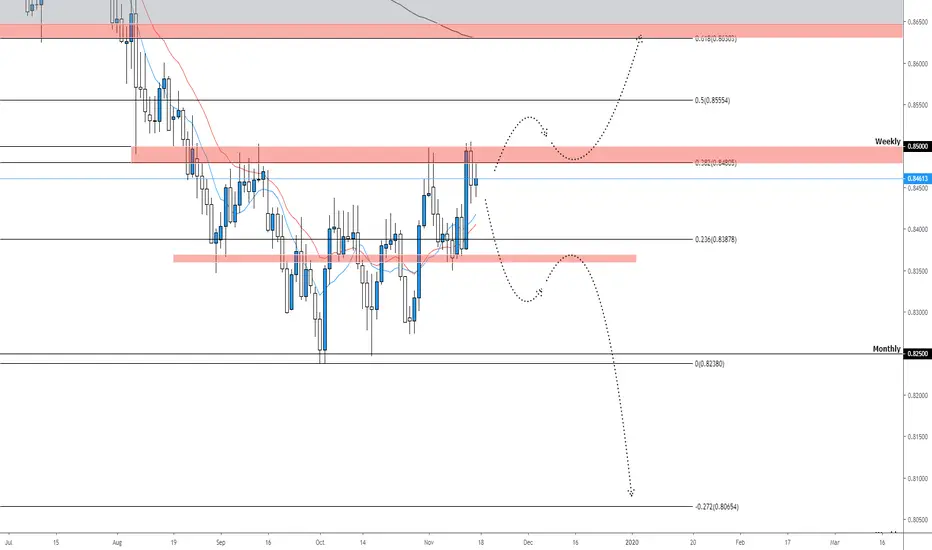
NZDCAD Daily Analysis 11/24/19Higher timeframe analysis for NCAD has been more bearish but on this daily time-frame we have seen a strong bullish trend that is not quite ready to drop.
Last week the major weekly resistance level was broken and is now being retested, price action also failed to reverse at our 38.2% fib level so we will look toward our next key fib level, the 61.8%.
If we see strong bullish setups off this weekly support we will look to target toward the 61.8%, monthly resistance and 200 ema around 0.86350 which is over 120+ pips away.
Be careful around that confluence area as it is an important zone that may show bearish volume and favor the overall higher time-frame bearish trend!
Nzd-cad
NZDCAD LONG CONTIUATIONThis pair tends to make double bottoms every swing low before continuing, so far price hasn't achieved one at Support which was our heavy Resistance before hand. An engulfing candle/ Bullish momentum would be a great indication that Buyers are in fact entering this area.

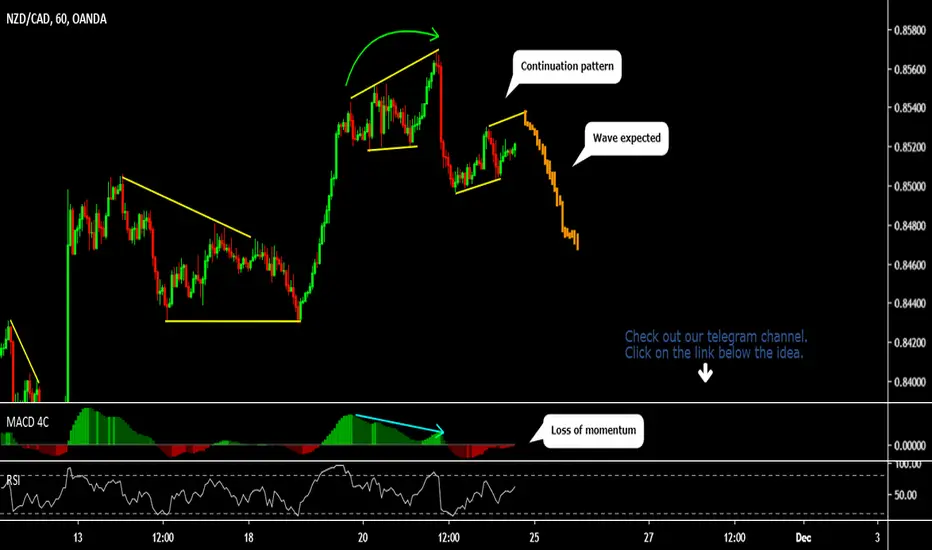
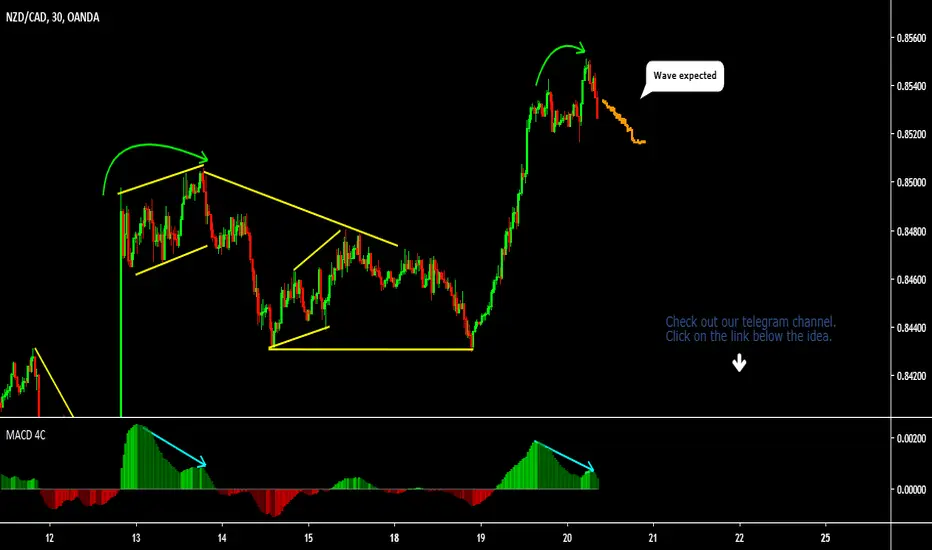
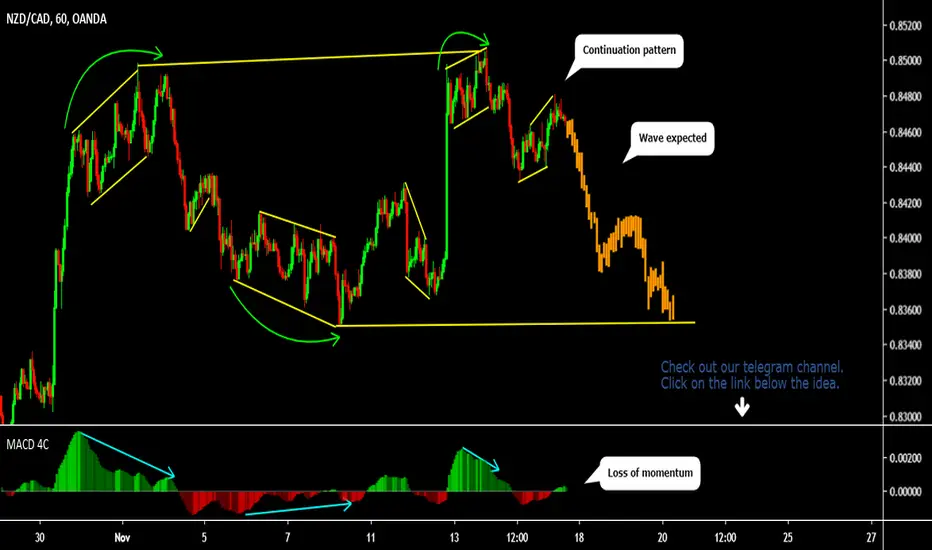
NZD CAD SELL (NEW ZEALAND DOLLAR - CANADIAN DOLLAR)Hi there. Price is forming a continuation pattern to the downside. Wait for the price to complete the pattern and watch strong price action for sell.
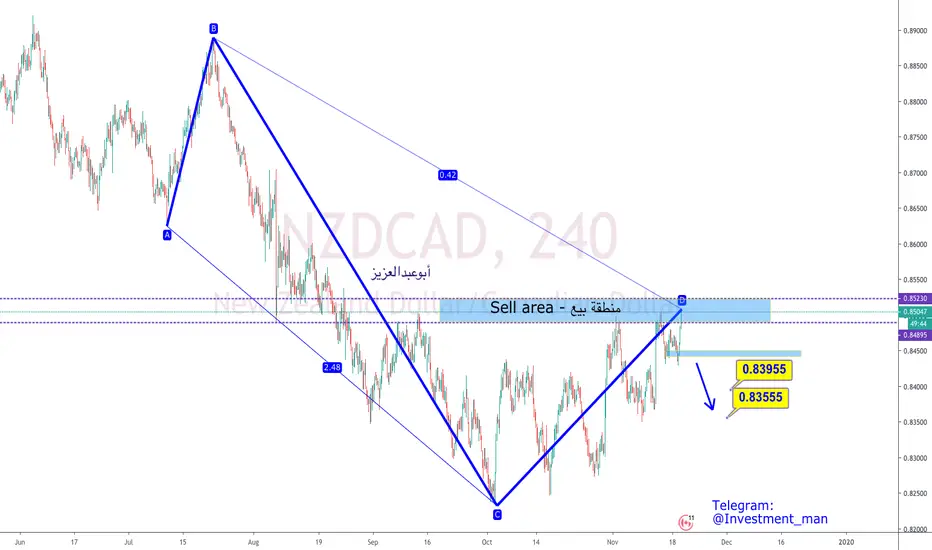
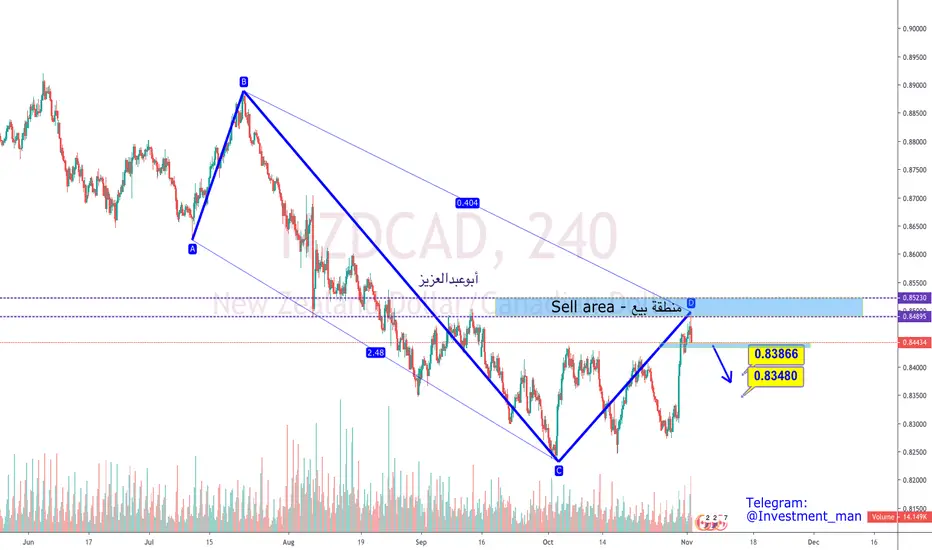
NZDCAD - 4HDears,
please, be the area for sell it is still strong and if you want to sell with the safety you can sell under the area.
Good luck.

NZD/CAD on point*All content have only educational and informational purposes, and never should use it as financial advice.

NZD CAD SELL (NEW ZEALAND DOLLAR - CANADIAN DOLLAR)Hi there. Price is forming a reversal pattern to change its direction. Watch strong price action at the current price for sell.
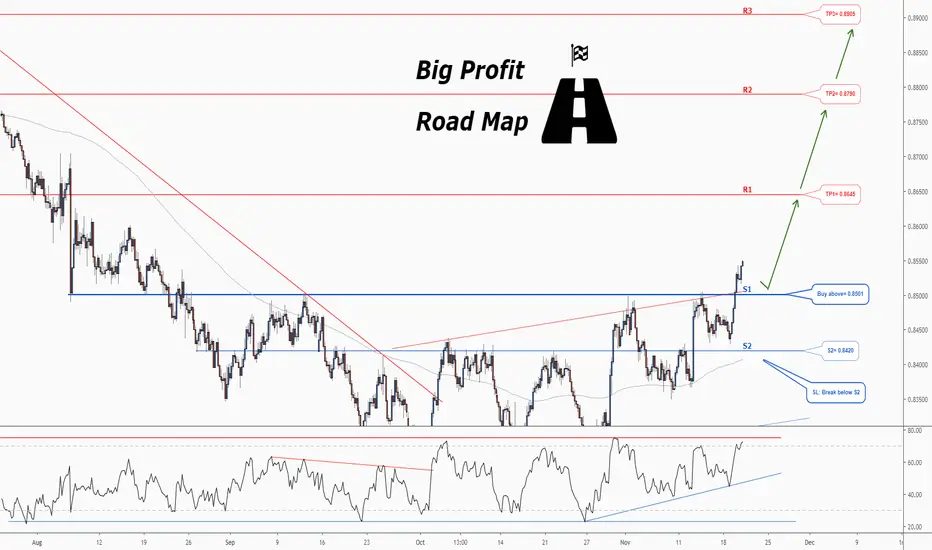
Don't miss the great buy opportunity in NZDCADTrading suggestion:
. There is a possibility of temporary retracement to suggested support line (0.8501). if so, traders can set orders based on Price Action and expect to reach short-term targets.
Technical analysis:
. NZDCAD is in a range bound and the beginning of uptrend is expected.
.The price is above the 21-Day WEMA which acts as a dynamic support.
. The RSI is at 77.
Take Profits:
TP1= @ 0.8645
TP2= @ 0.8790
TP3= @ 0.8905
SL= Break below S2

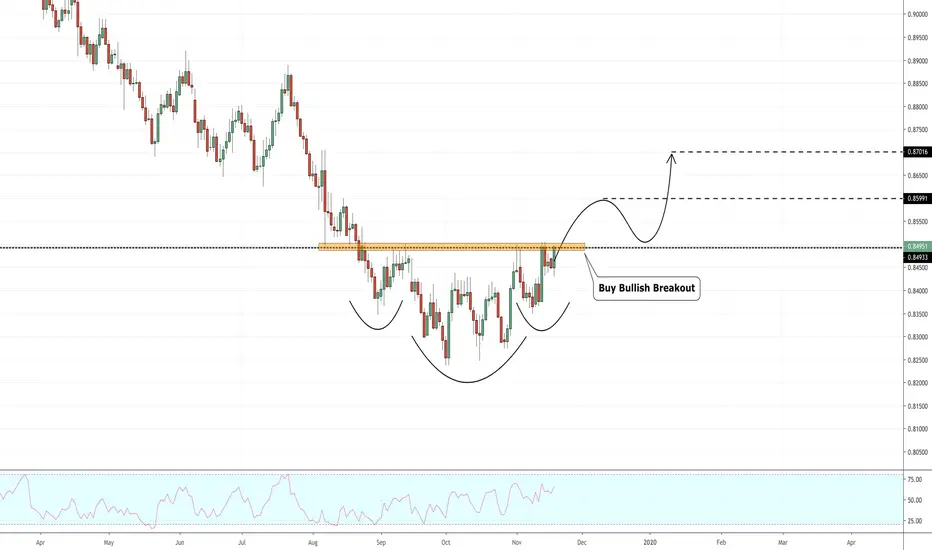
NZDCAD: Trend Shift
hey traders,
It looks like NZDCAD is finally going to reverse.
from summer the market started to slow down
and with the formation of the higher low, I think that the sentiment is steadily changing from bearish to bullish on this currency pair.
one thing that we need is the bullish break and close above the neckline - 0.85 level.
then we are free to buy the pair expecting bullish continuation to 0.86/0.87 level.
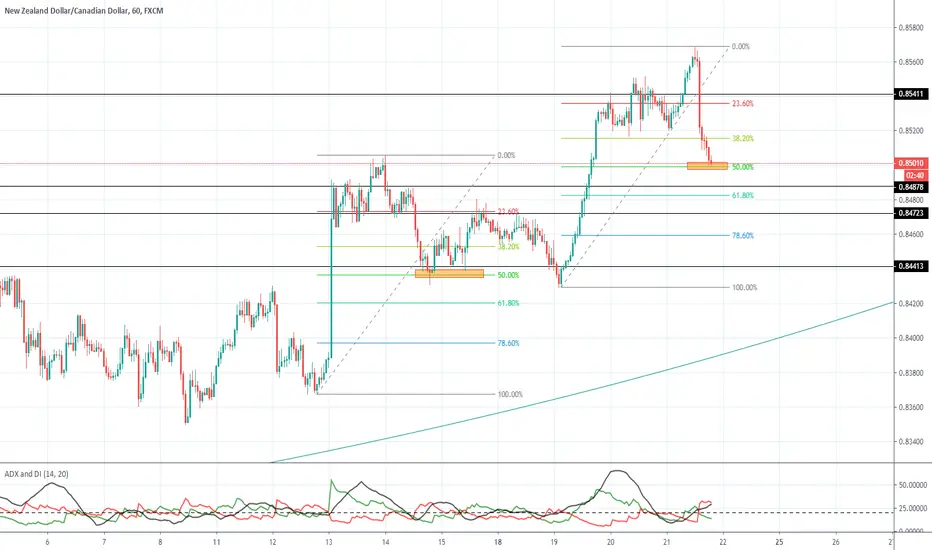
NZDCAD - Perfection does exist Last week's trade set up played out perfectly. Awaiting a retracement now for a new push to the upside potentially making new highs
NZDCAD DAILY 11/17/19NZDCAD SHORT IDEA
Overall higher time-frame analysis shows that price action has been majorly bearish
Current price action is near the daily 38.2% fib level as well as a weekly resistance level around 0.8500
To support our bearish sentiment we would like to see strong bearish setups coming from the current level and pushing down toward 0.83500
Upon a break and retest of the 0.83500 level we will target toward our monthly support around 0.82500 followed by a target toward our daily -27% fib level near 0.80600
If price action breaks the 0.8500 look for price to reach the daily 61.8% fib level around 0.86300
NZD CAD SELL (NEW ZEALAND DOLLAR - CANADIAN DOLLAR)Hi there. Price is forming a continuation pattern to the downside. Wait for the price to complete the pattern and watch strong price action for sell.
NZDCAD sell signal op [50pips]
ENTRY: 0.84500
TP1: 0.84200
TP2: 0.84000
SL: 0.84700
Chart time frame - 4h
Time for reaching TP - 1-3D
Follow, Like, Share or Comment
Thanks on supporting!
All best!

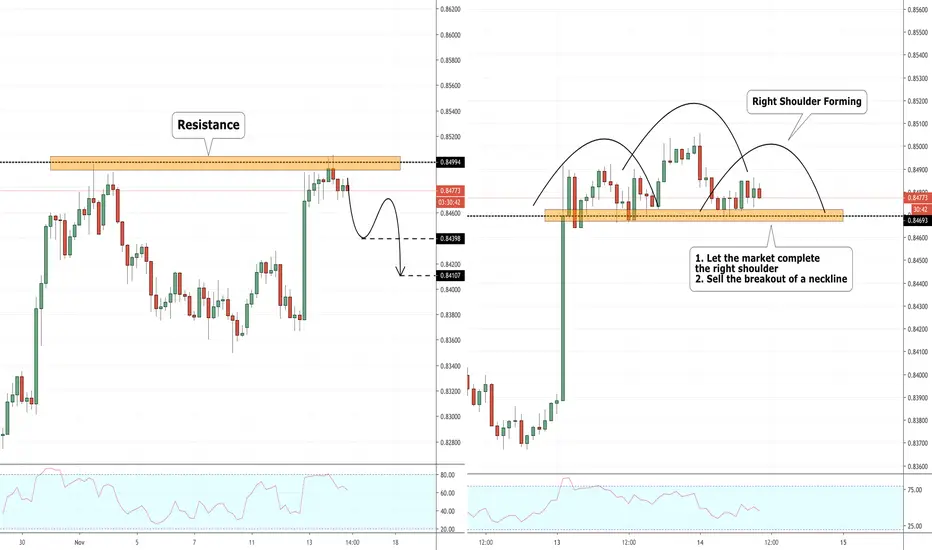
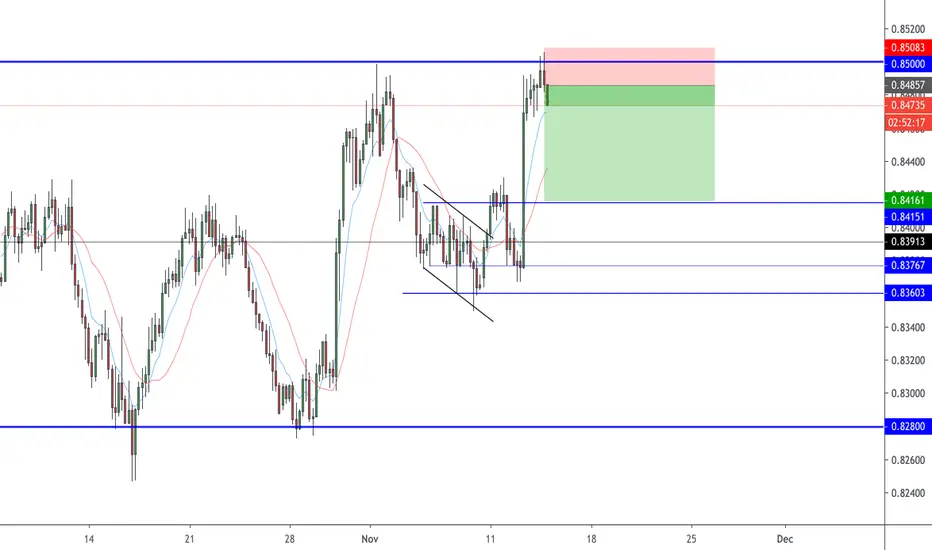
NZDCAD: Trading Plan
NZDCAD is approaching a strong level of resistance.
We have an opportunity to catch a retracement.
pay close attention to a potential head and shoulders formation.
market is currently forming a right shoulder.
let it complete it and then look for an occasional breakout.
Target levels will be:
0.844
0.841
stop will be above the right shoulder.
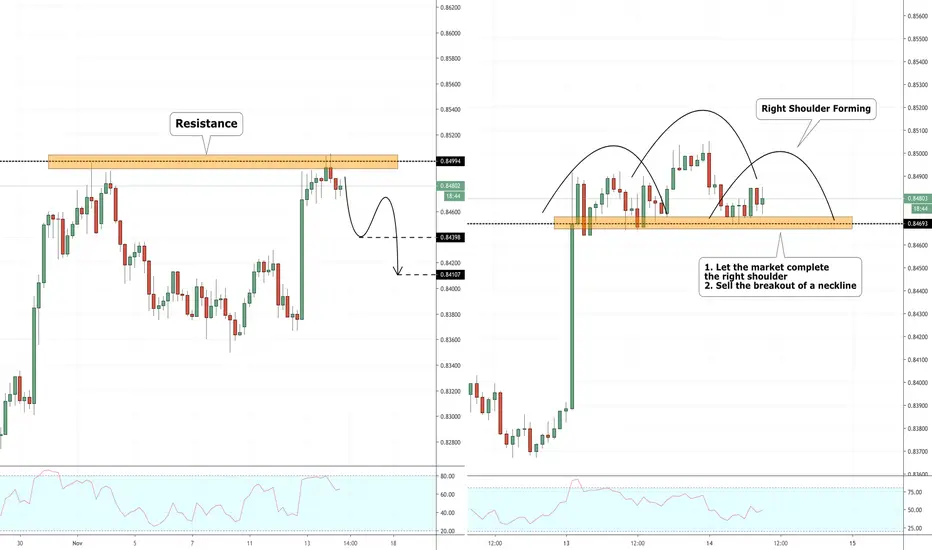
NZDCAD sell signal op [50pips]
ENTRY: 0.83750+-
TP1: 0.83500
TP2: 0.83250
SL: 0.84060
Chart time frame - 4h
Time for reaching TP - 3 - 48h
Follow, Like, Share or Comment
Thanks on supporting!
All best!

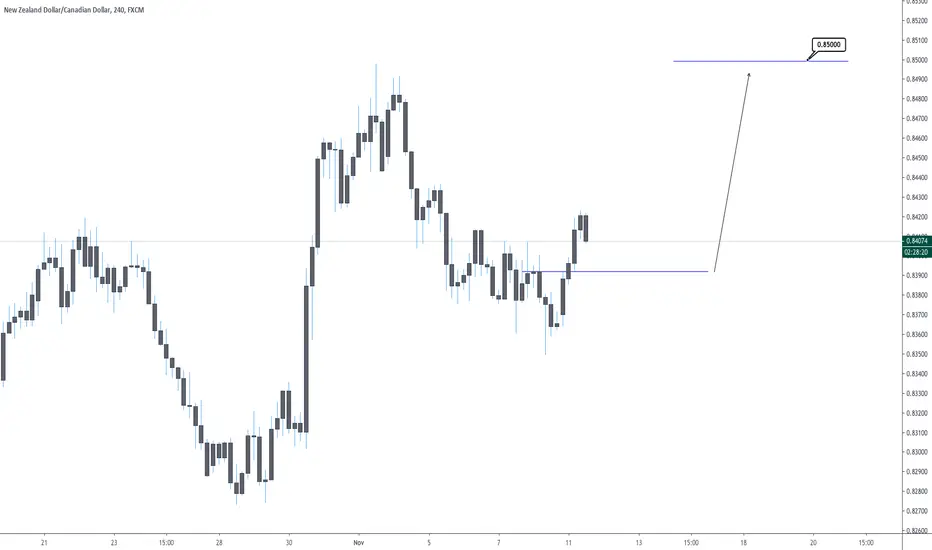
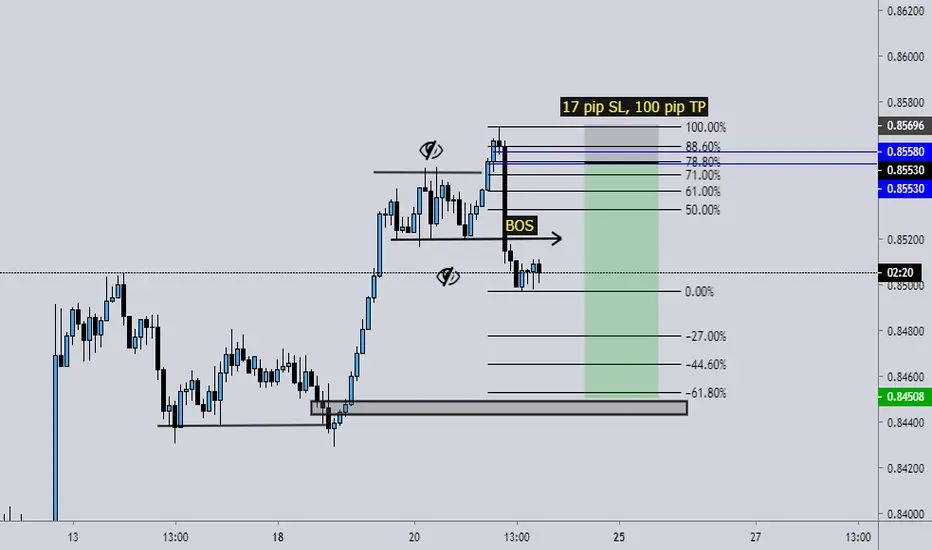
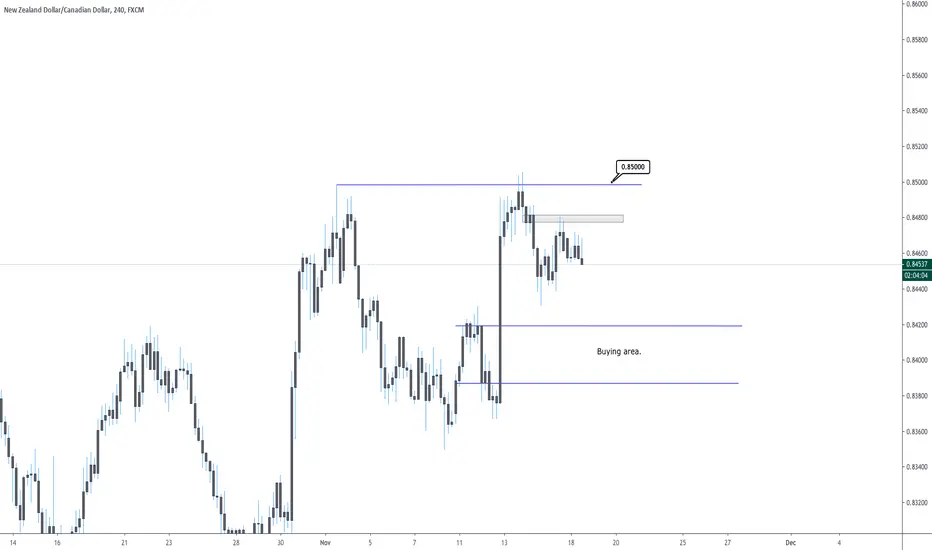
NZDCAD - Correction finishedLooking at NZDCAD we had a clean break of the previous correction wave. Looking for a retracement to execute a good RR position. 0.85000 first TP.