Nzd-cad
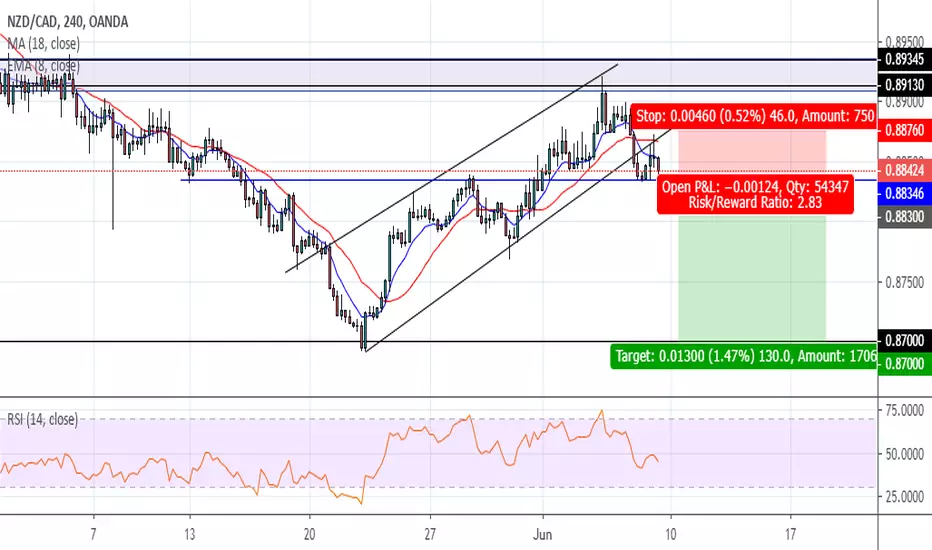
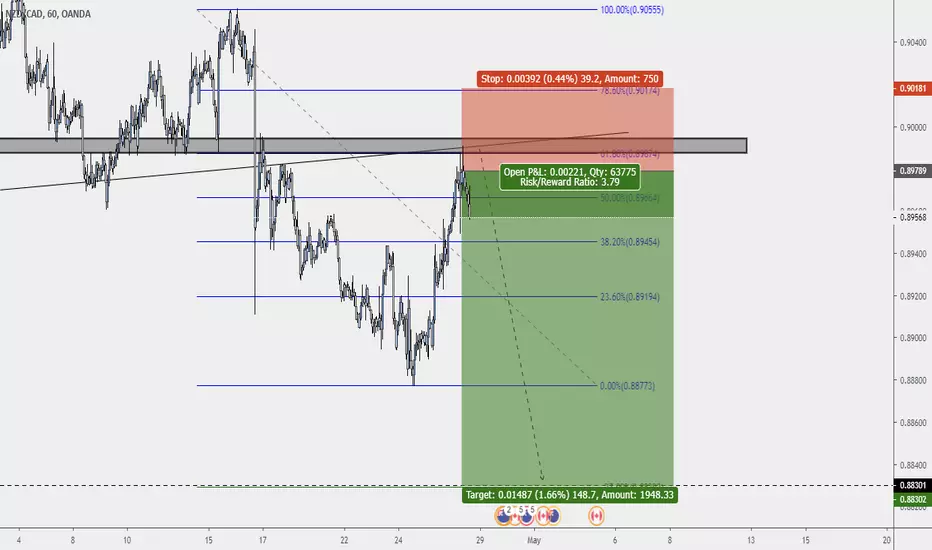
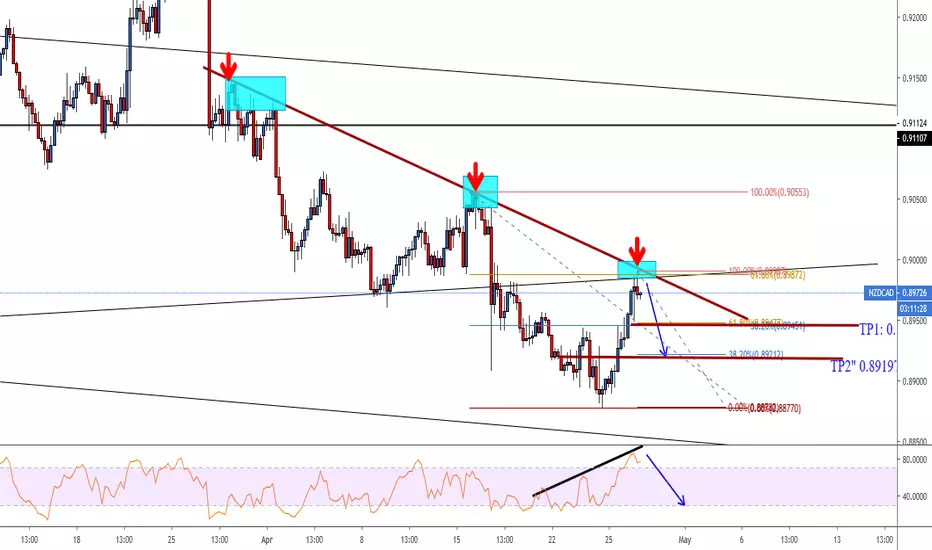
SHORT NZDCADI expect bears to take control of NZDCAD.
The reasons:
- Prior Bearish movement
- Breakout of the corrective ascending channel + retest of the trend line and 18 EMA with a pinbar formation.
I would favour an entry at 0.88300 with a stop at 0.88760 and a Profit target at 0.87000
quick NZD/CAD longRight now it is the perfect opportunity for an long position, the trend lines align really good. But a bearish breakout is still concerning me. Don't risk anything you can't loose.

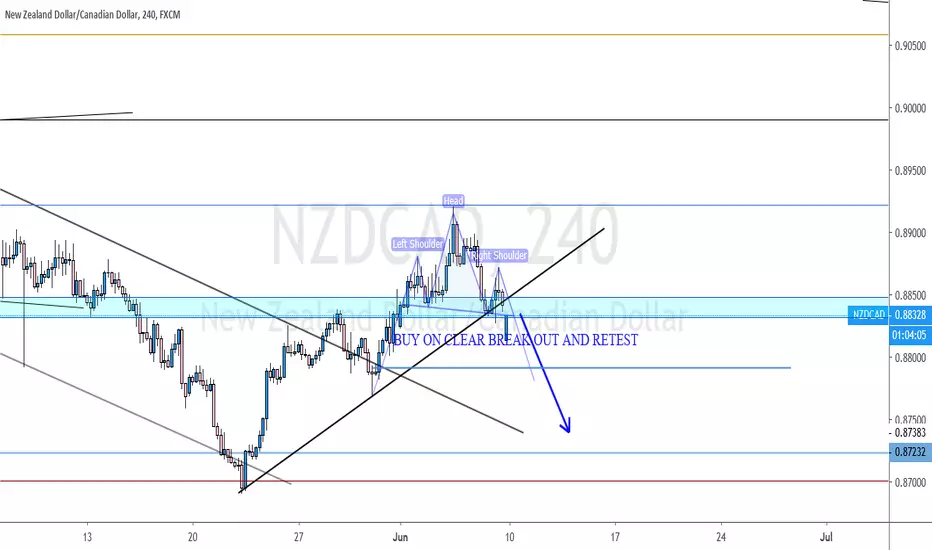
NZDCAD SHORT ANALYSISWe can see a clear H&S formed and we also have seen a broken uptrend line. At the closure of the broken neckline I expect this pair to keep pushing downwards.
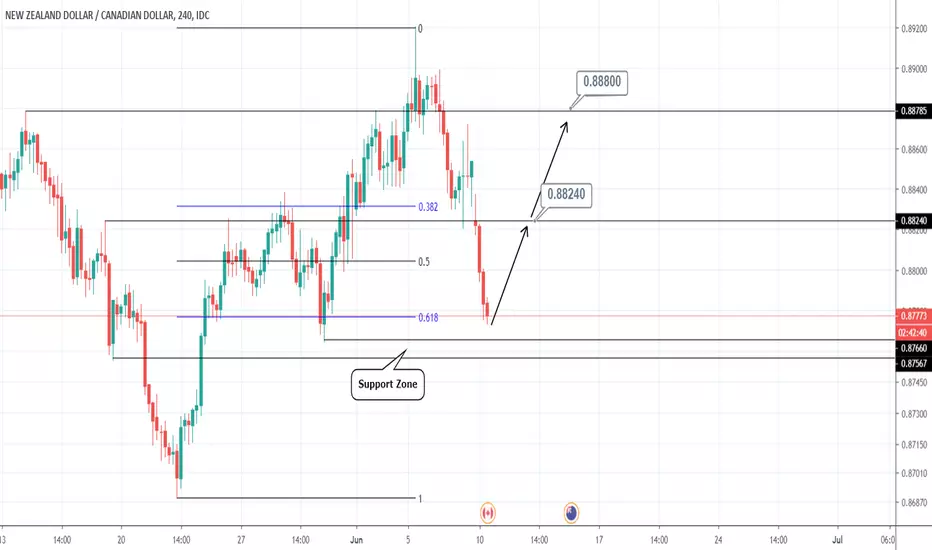
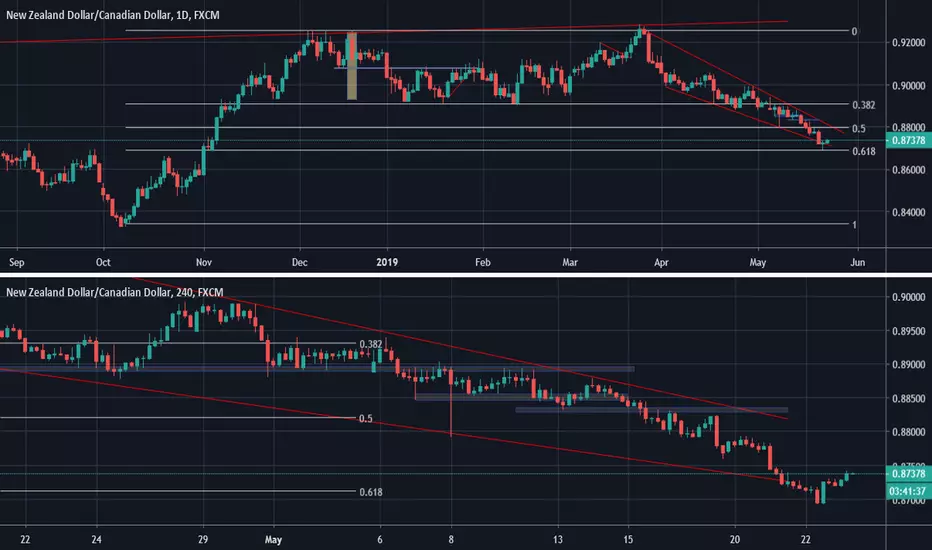
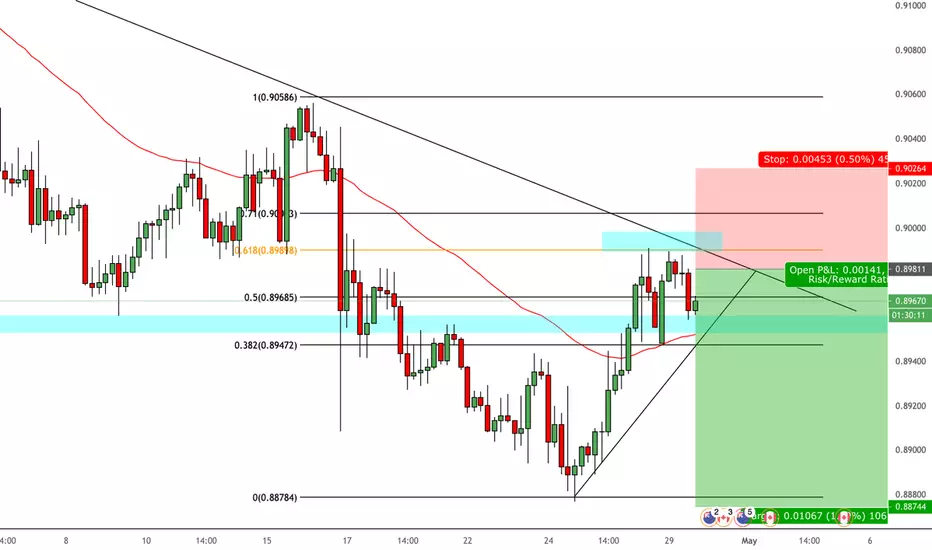
NZDCAD Buy SignalPattern: 4H correction after a 1D High.
Signal: Bullish as the price is testing the 0.618 Fibonacci retracement level and 1D Support Zone.
Target: 0.88240 and 0.88800 (if 0.382 breaks).
NZDCAD is gaining bullish momentumThis chart looks similar to AUDCAD but that one is not quite ready and to my liking. Green candle and lots of volume.

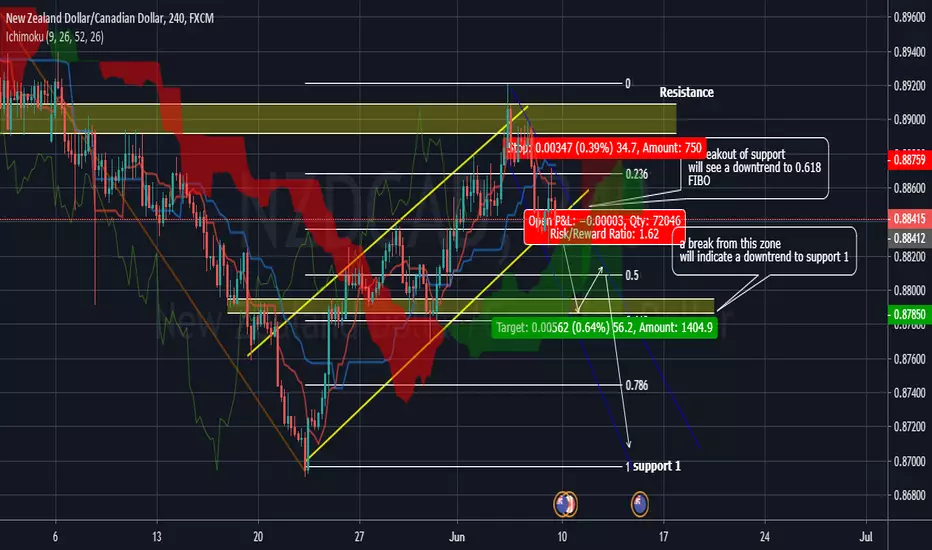
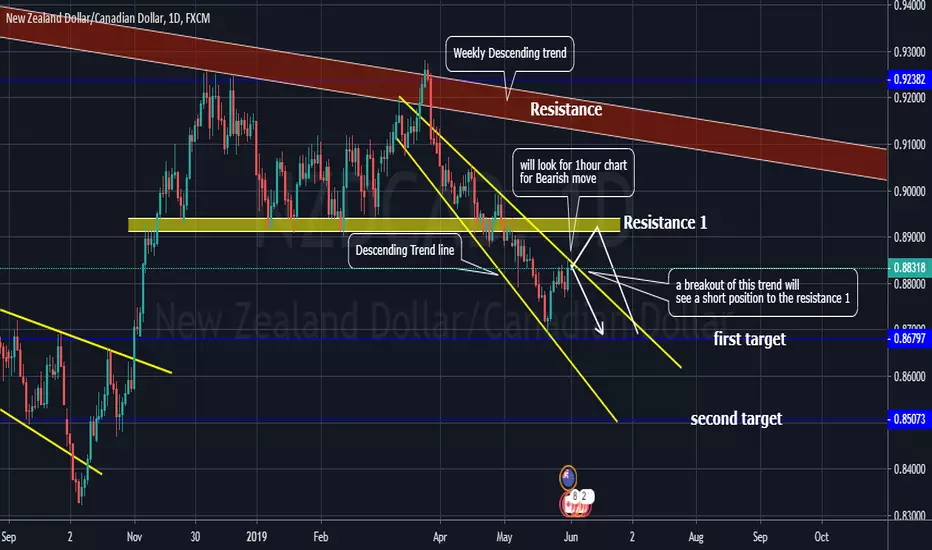
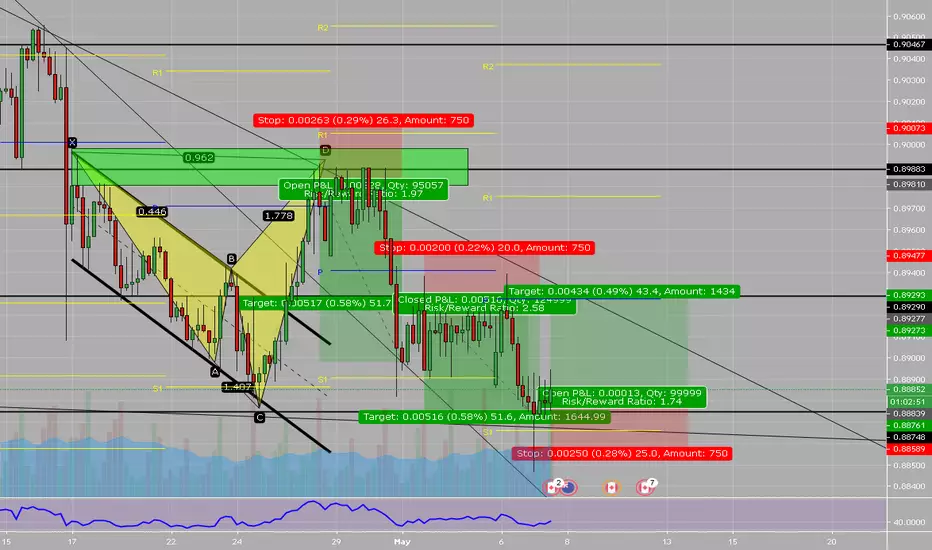
NZDCAD VERY SIMPLE MOVEWe are moving in an ascending trend line, a breakout from the trend will see short to resistance 1
if we see a rejection at 1hour chart of the current price will have an opportunity for a bearish movement
to a key level
NZDCAD LongNZD - bottoming now and currently gaining upwards momentum, possible continuous bounce up to 61.8 fib esp 10-year seasonality for NZDCAD favors it being bullish this coming June
CAD - will take some time to clear out the glut in oil inventories (oilprice.com) hence the recent slide, but still must be careful to prevent getting whipsawed. Expecting oil to drop @55 psychological resistance which will also bring CAD down
Oil:
Weekly:
NZDCAD LONG SWING TRADEInverted head and shoulder on the Weekly Time Frame. 61.8 fib and looking at price action it does seem we are making a reversal back to the upside. Targets for me will be -0.27
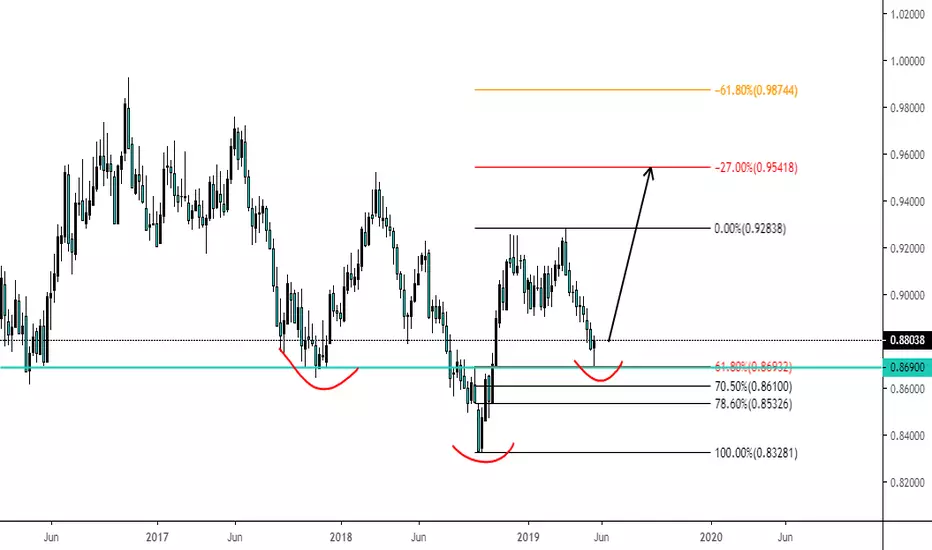
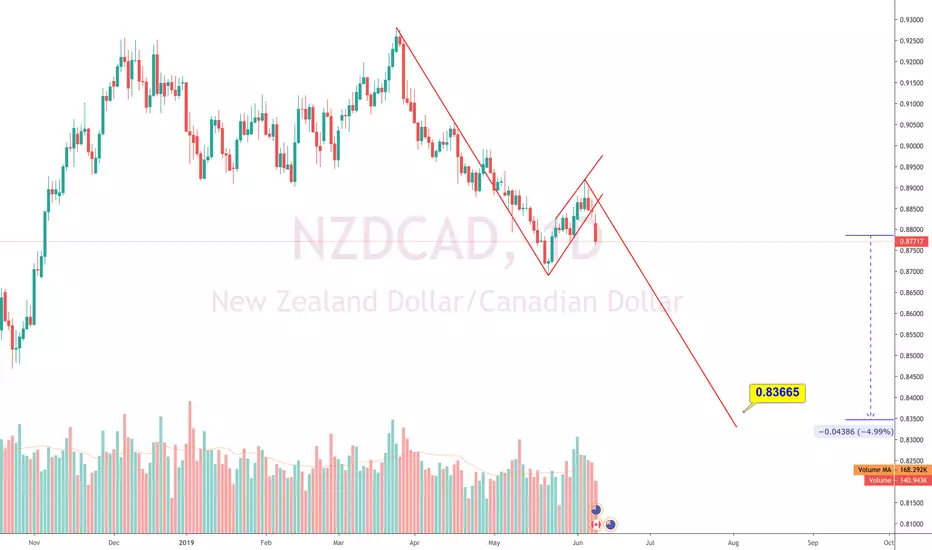
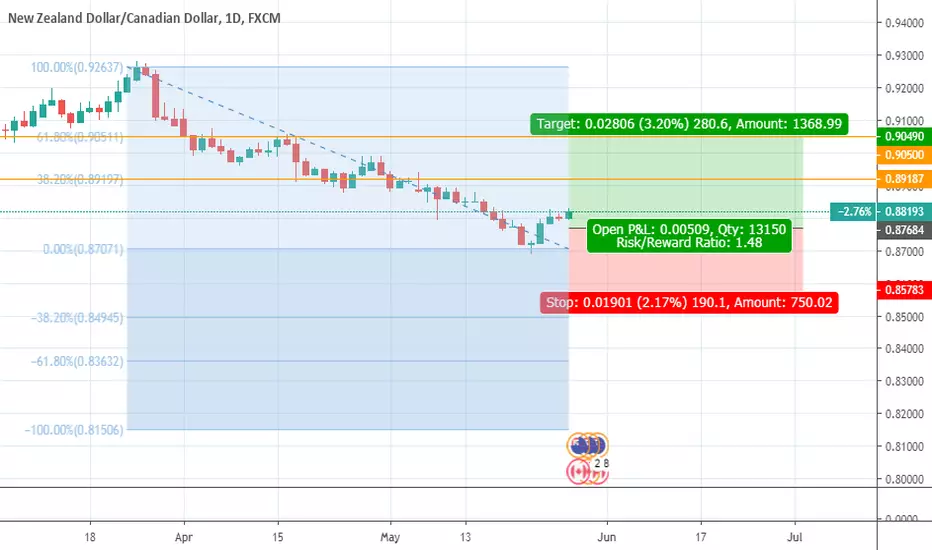
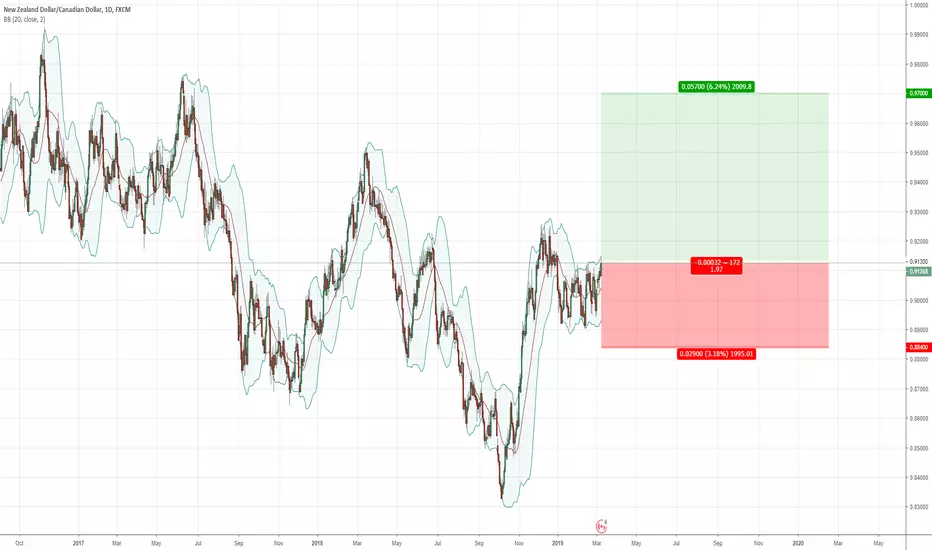
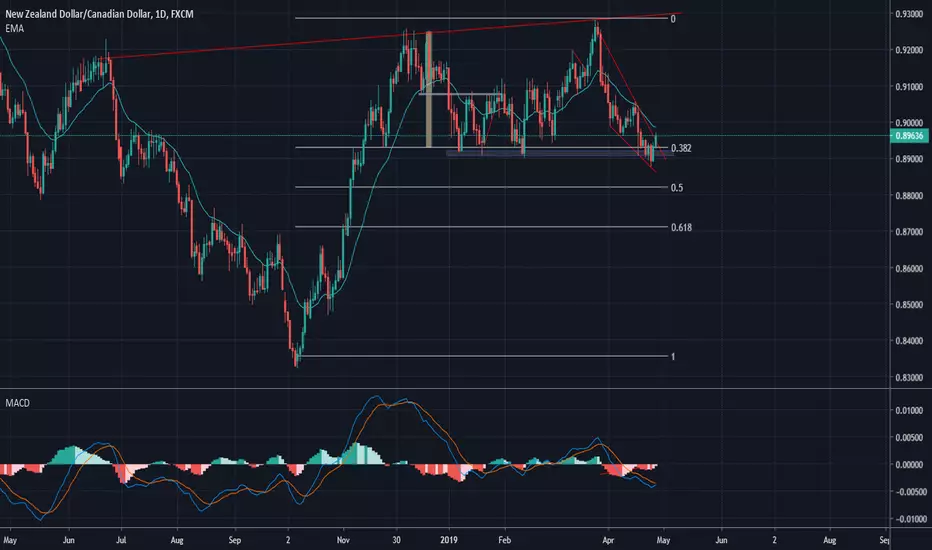
NZDCAD on the way to gain 3%A beautiful setup appeared on NZDCAD. The pair has reached the 61.8% Fib level which seems rejected with a reversal morning start forming on the daily chart.
The pair has also been trading inside a bullish wedge, and a break above the upper wedge line could send the pair to the 0.91xx area (a 3% gain).
The recent down-move on the daily seems overstretched relative to the previous range.
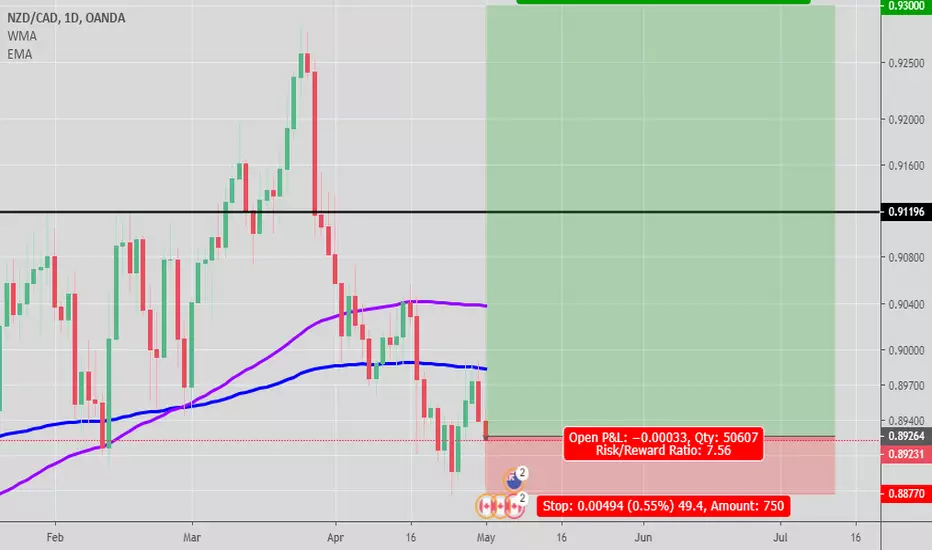
NZD/CAD will start trending upwards
After a long consolidation, time for an uptrend arrived! I intend to hold this trade for a few months.
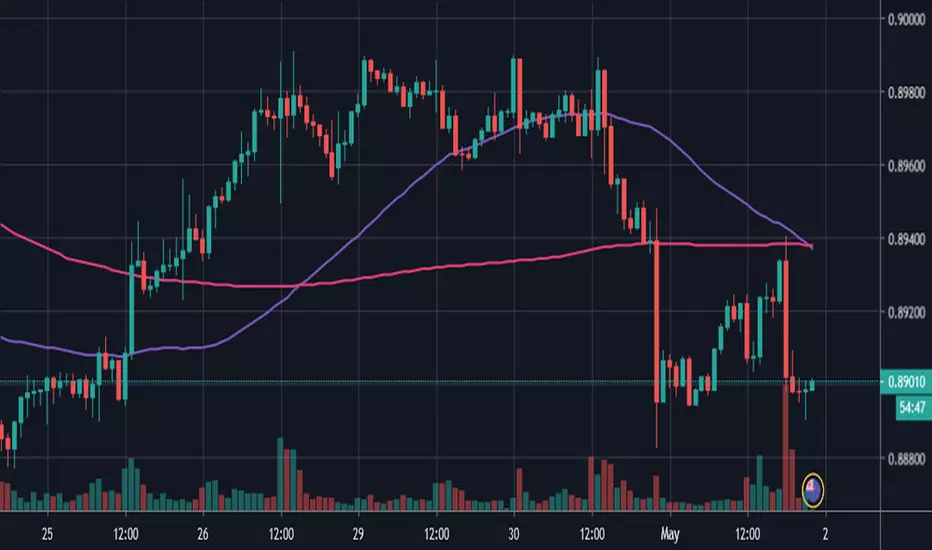
NZDCAD Simple Moving Average Long150 MA (Moving Average) has crossed the 50 MA heading upwards. TP .8980
May the pips be with you.
I support the big banks with my pips.
Not a call to buy or lettuce.

NZDCAD Long - Watch out for a bullish wedge breakoutNZDCAD is triggering a bullish wedge pattern on the daily chart, after finding strong buying power at a horizontal support zone previously. (Setup posted recently).
The bullish divergence is also still in-tact. Overall, the pair trades near the lower range levels and has more upside potential.
Today's risk-on market environment and week/month-end profit taking taking may also push the pair higher.
NZDCAD Buy Setup: H.Support, Divergence and MomentumNZDCAD reached a horizontal support level, near the lowest level of 2019. A strong bullish candle is forming, and a bullish view is also confirmed by a bullish divergence between the price and the MACD.
Furthermore, the pair is forming a bullish wedge pattern with the current fifth having a high probability of breaking above the upper wedge line.
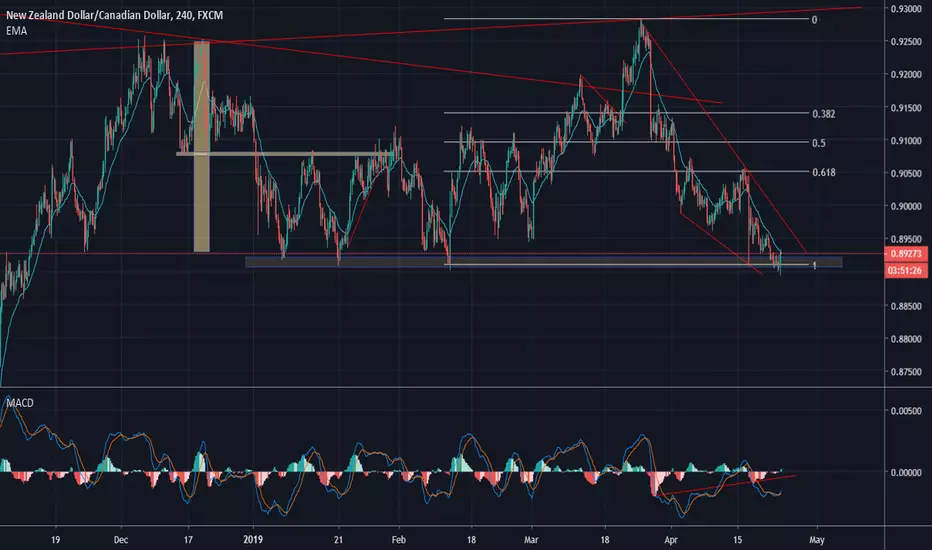
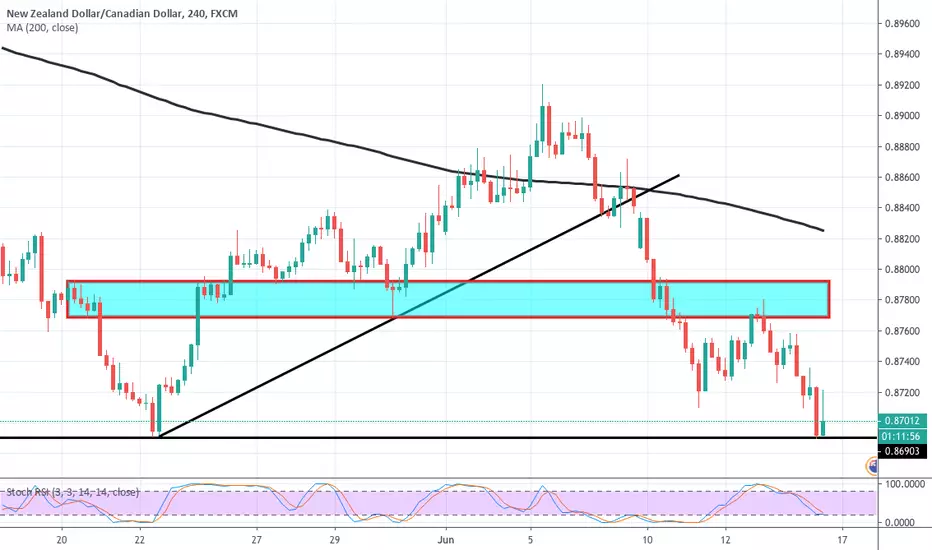
NZD/CAD Daily. the price at key level 1. We can short if the price break down and close
down of upper rectangle or wait break down and
short pull back .
2. For long we need to find
turn back pattern .
This is not an investment recommendation or any call to buy or sell
It is just an analysis based on a study of the history of price action
Behavior , that may not be a necessarily reason for the success of
the structure or repetition. So please make your decision based on your vision .
To protect capital and manage your deals and trading successfully
the maximum loss in each transaction for the same currency or
commodity in the same direction should not exceed ( 2% ) of the capital .
Good luck >>
