NZD/CAD 1H Chart: Kiwi stranded in bullish triangleThe New Zealand Dollar has been trading in an ascending channel against the Canadian Dollar since mid-November. The upper boundary of this pattern was tested on November 18 that was followed by a new wave down. The Kiwi has stopped near the 0.8900 on various occasions, thus forming a descending triangle.
Characteristics of both patterns suggest that the Kiwi should soon enter a period of appreciation. It is likely that the triangle continues to prevail in this session and early on Monday, as the pair has not yet reached the bottom channel boundary located circa 0.8890.
This trading session is expected to be relatively quiet. Thus, it is unlikely that the combined resistance of the 55– and 100-hour SMAs is breached; the 0.8890 area should likewise hold.
The base scenario favours strengthening of the Kiwi during next week.
Nzd-cad

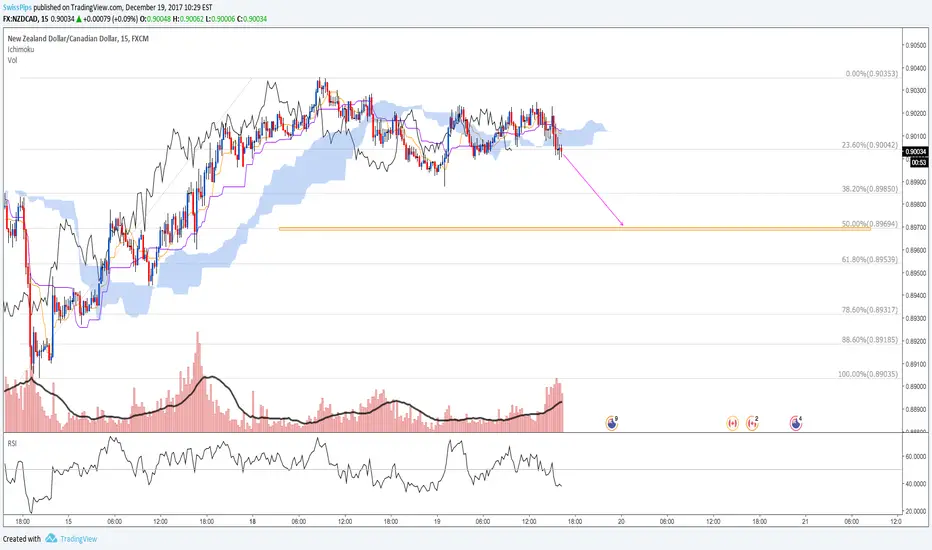
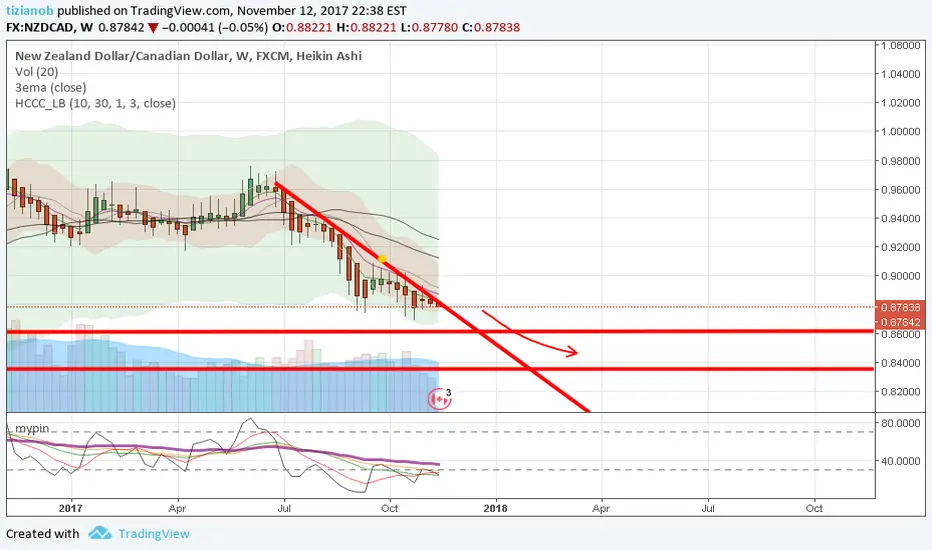
NZDCAD ShortSeems like NZDCAD is gearing up for a short based on this trend. If it breaks this line expect more bullish but I'm expecting it to drop during this US Session today.
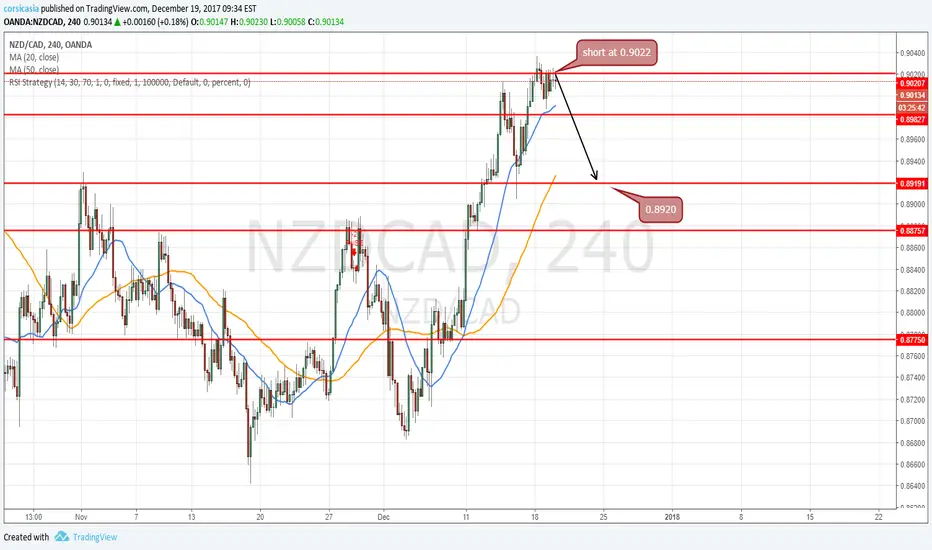
short at 0.9021 for target 0.8920i short bzd cad because i found cad very undervalued
also NZD milk price was down of more 3% since last and new Giv and member on monetary policy is still not clear for futur.
short at 0.9021
target 0.8920
Gain 101 pips
come with 2x 1lot will cut the first at +30-40 pips and make a Sl on a 2nd at +15 for securite 45-55 pips if my plan fail
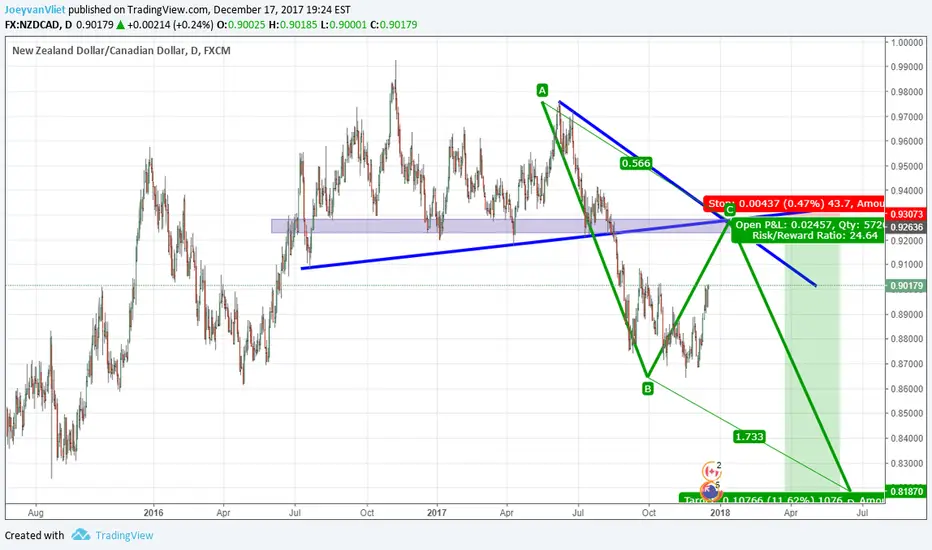
NZD/CAD: shorting it Hi guys,
I am seeing lots of rejections on this pair and I m looking to sell it.
My target is KS level as shown in my chart at around 0.89700.
Feel free to like/comment my ideas.
Cheers
Jesse
NZD/CAD 1H Chart: Channel up prevailsA descending channel has confined NZD/CAD since late August. The latest test of its bottom boundary occurred on November 17 when the New Zealand Dollar reversed to the upside and formed a channel up. In line with this pattern, the pair should still appreciate up to the 0.89 area where the upper boundaries of this pattern and the senior one are located.
However, the Kiwi faces a significant resistance cluster set by the weekly and monthly PPs and the 200-hour SMA in the 0.8780/0.8800 territory. As suggested by technical indicators, this might mark a point of reversal.
In this case, the Kiwi is likely to breach the channel up and continue trading in a newly-formed one-day channel down towards the bottom boundary of the senior pattern.
The nearest support of significance is the 55-hour SMA at 0.8720; the weekly and monthly S1s are likewise located nearby circa 0.8670.

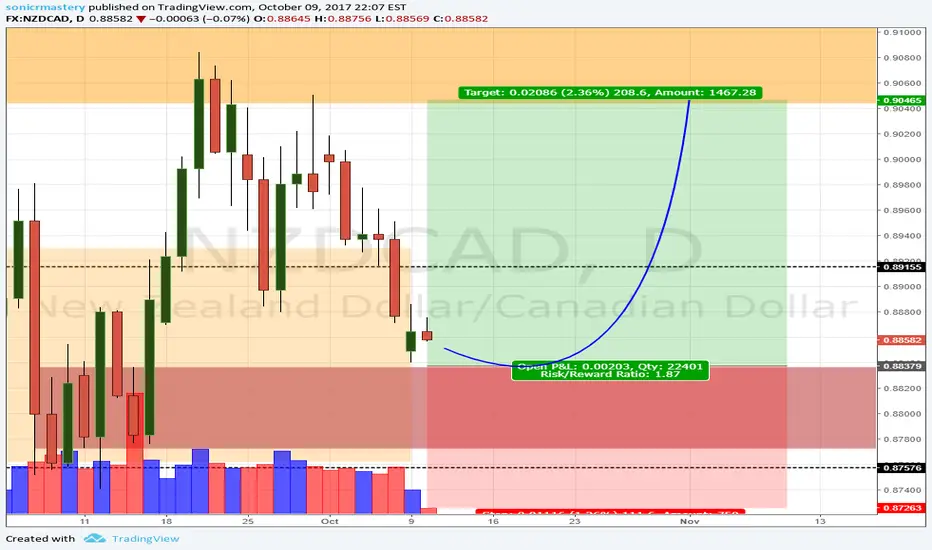
NZD/CAD Daily Update (10/10/17)Price is approaching a critical support zone - 0.88
I am looking for a possible long trade and swing it back to the resistance level.
Disclaimer :
This analysis does not include personal feeling/opinion, and pure base on technical analysis
Trading foreign currencies can be a challenging and potentially profitable opportunity for investors. However, before deciding to participate in the Forex market, you should carefully consider your investment objectives, level of experience, and risk appetite. Most importantly, do not invest money you cannot afford to lose.
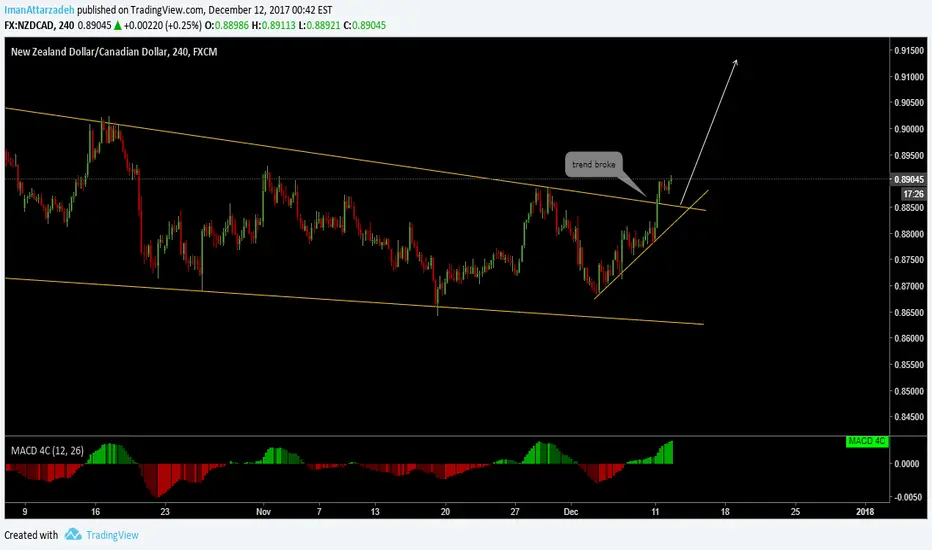
NZD/CAD Pending buy order for some nice pips! Hey guys,
the pair has broke a strong trend line to the upside.
Looking to buy this pair as soon as the pullback on H1 is over.
Target is next fib level as shown in my chart.
Cheers
Jesse
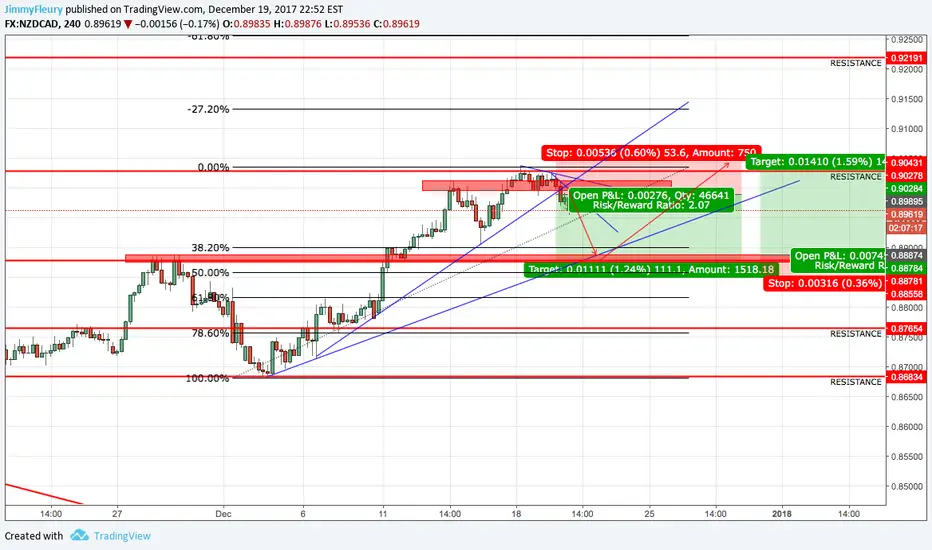
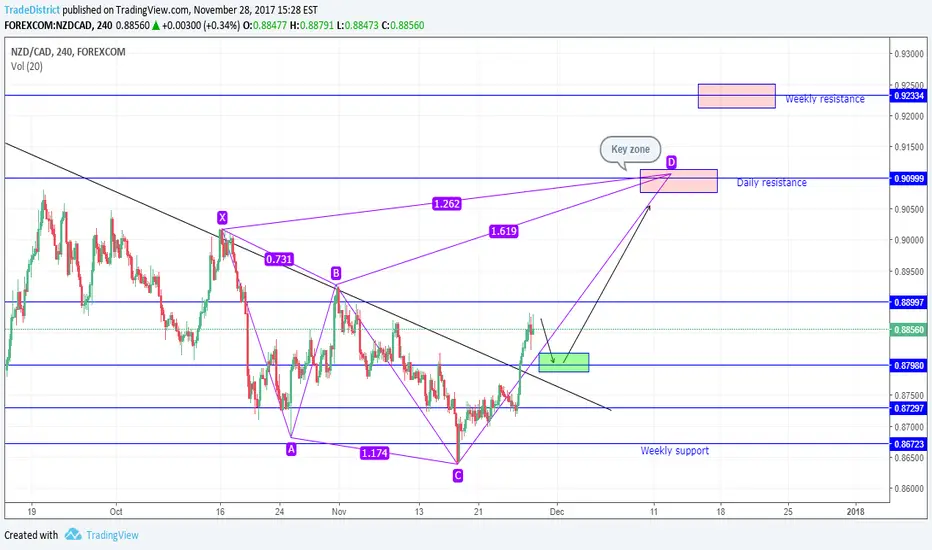
NZDCAD armonic shark pattern @ 0.9105 or 0.9230After a new bullish trend stars, I think that still going up at least to 0.9105 completing the shark pattern. First we got to wait for the pullback to the green zone fot take a long trade. There is a key zone at 0.9105/10 where is the daily resistance. if price brekeout thar zone, we can go to 0.9230 for complete a larger shark pattern.
I hope that you can take this trade.
For more information, and exactly entries, yo can follow our telegram channel. @TDFreeChannel
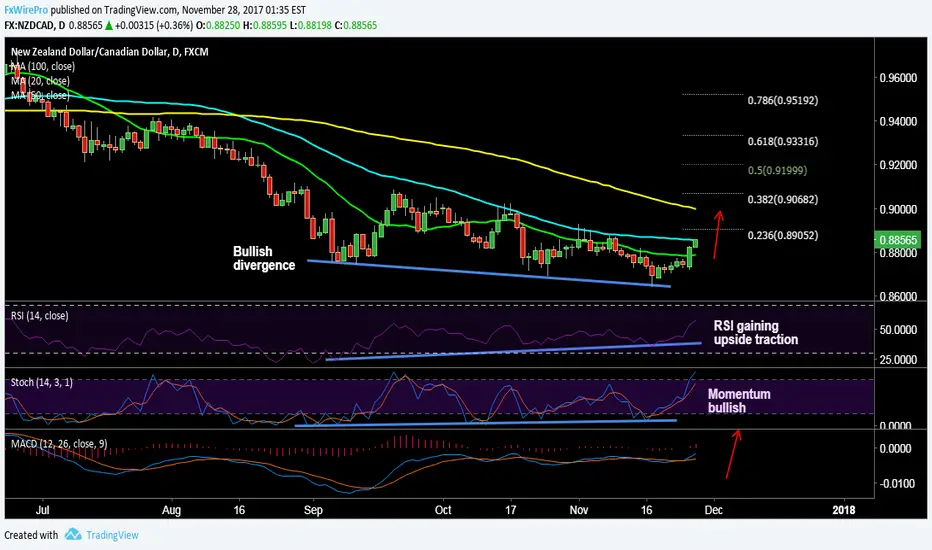
NZD/CAD long setup- NZD/CAD has shown a decisive break above 20-DMA, currently hovers around 50-DMA at 0.8855
- RSI biased higher, gaining upside traction at 56 levels
- Stochs are biased higher, momentum studies are bullish
- We see bullish divergence from price action on RSI and Stochs
Support levels - 0.8787 (20-DMA), 0.8785 (5-DMA), 0.8740 (Sept 12 low)
Resistance levels - 0.8905 (23.6% fib retrace of 0.87581 to 0.86417 fall), 0.8929 (Nov 1 high), 0.90 (100-DMA)
Good to go long on breakout above 50-DMA at 0.8855, SL: 0.8785, TP: 0.89/ 0.8930/ 0.90.
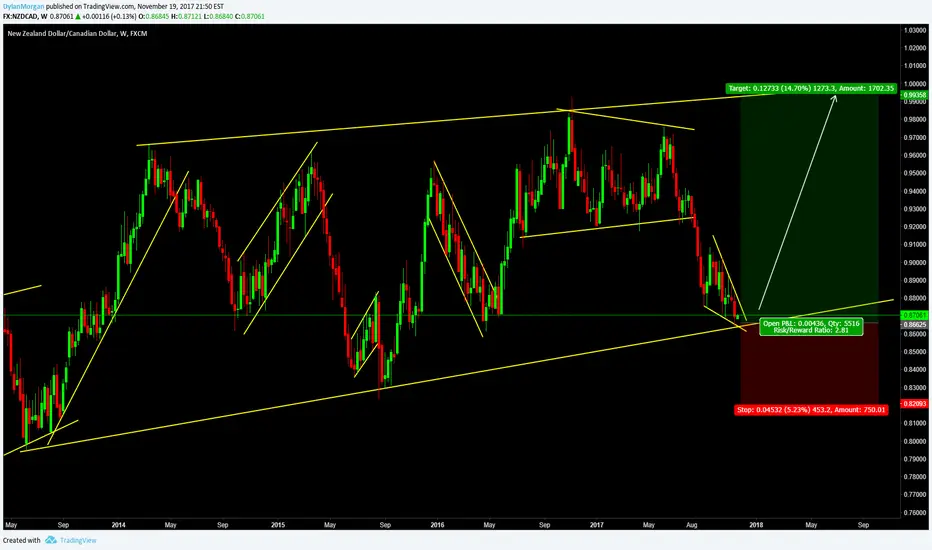
NZDCAD Weekly: Bullish BiasPrice has found itself at the bottom of the bigger pattern and I am expecting a breakup out of the falling wedge. Look to go long soon. Good luck
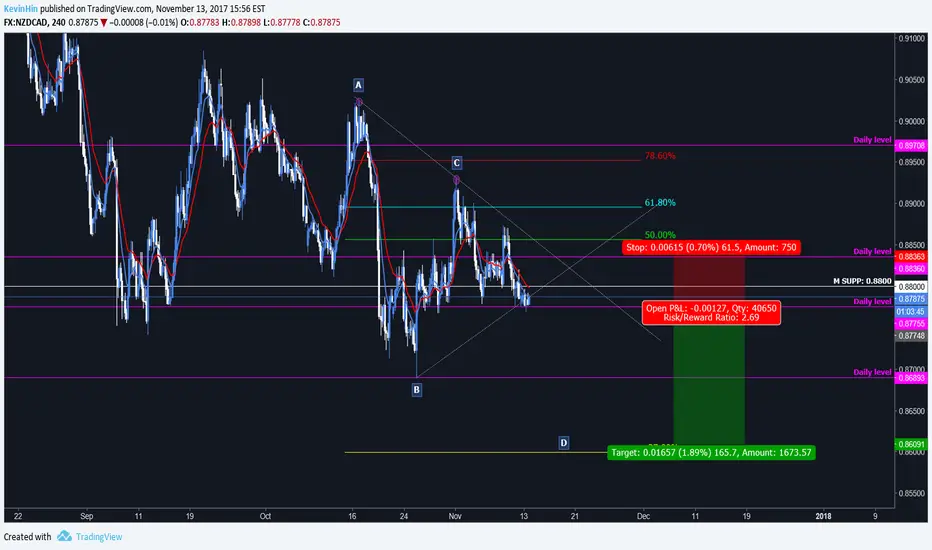
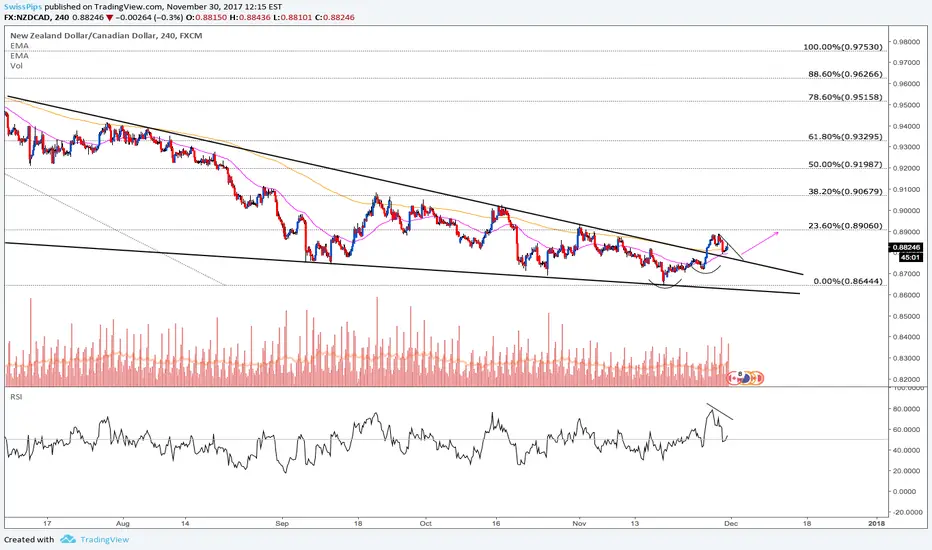
NZD/CAD 1H Chart: Kiwi tests medium-term patternThe pattern that has dominated the NZD/CAD currency pair for the last three months is a descending triangle. The rate was respecting the boundaries of this pattern for some time.
However, this situation changed early in November when bulls failed to reach the upper boundary of this medium-term pattern. From this point forward, the pair has been stranded in a descending channel.
Meanwhile, the Kiwi is testing the lower triangle boundary circa 0.87. It is likely that this level surrenders and allows for further decline down to the monthly S1 and the weekly S3 at 0.8660.
The pair’s subsequent movement is expected to be north, as the rate should approach the upper line of either channel or triangle. Conversely, in case the 0.8660 mark is breached, the next support is the distant weekly S4 at 0.8593.

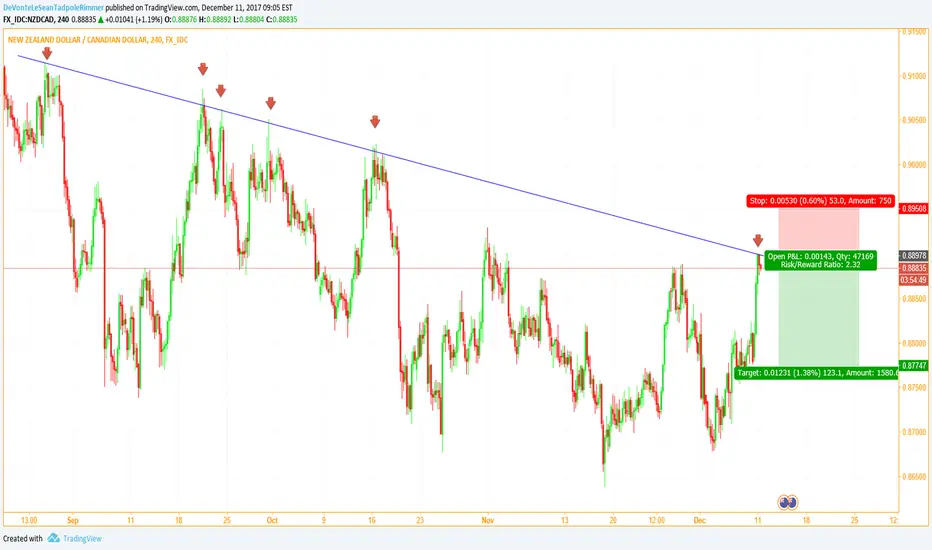
Seeking lower pricesA strong bearish market pressure insist on the cross
The graphical chart confirm the presence of bearish trendline that drive the pressure since many weeks
this analysis are based on market pressure. For free market pressure of all crosses visit my twitter profile
NZD/CAD Short- Monthly M.A. down
- Weekly M.A. down - Wicks spiking through 8 EMA
- Daily M.A. down, strong Daily close below 0.8775 preferred.
H4 : Price broke through our C.T.L. but is not able to go through 0.8775 yet. Would like to see a strong bearish close (daily preferred) below.