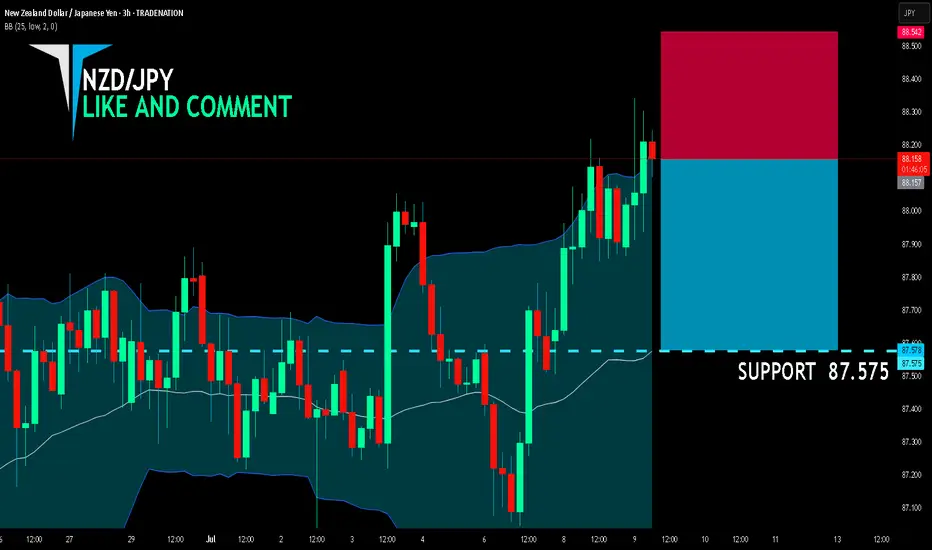
NZD/JPY BEARS ARE STRONG HERE|SHORT
NZD/JPY SIGNAL
Trade Direction: short
Entry Level: 88.157
Target Level: 87.575
Stop Loss: 88.542
RISK PROFILE
Risk level: medium
Suggested risk: 1%
Timeframe: 3h
Disclosure: I am part of Trade Nation's Influencer program and receive a monthly fee for using their TradingView charts in my analysis.
✅LIKE AND COMMENT MY IDEAS✅
NZD (New Zealand Dollar)
Bearish drop?The Kiwi (NZD/USD) has rejected off the pivot and could drop to the 1st support.
Pivot: 0.6038
1st Support: 0.5938
1st Resistance: 0.6079
Risk Warning:
Trading Forex and CFDs carries a high level of risk to your capital and you should only trade with money you can afford to lose. Trading Forex and CFDs may not be suitable for all investors, so please ensure that you fully understand the risks involved and seek independent advice if necessary.
Disclaimer:
The above opinions given constitute general market commentary, and do not constitute the opinion or advice of IC Markets or any form of personal or investment advice.
Any opinions, news, research, analyses, prices, other information, or links to third-party sites contained on this website are provided on an "as-is" basis, are intended only to be informative, is not an advice nor a recommendation, nor research, or a record of our trading prices, or an offer of, or solicitation for a transaction in any financial instrument and thus should not be treated as such. The information provided does not involve any specific investment objectives, financial situation and needs of any specific person who may receive it. Please be aware, that past performance is not a reliable indicator of future performance and/or results. Past Performance or Forward-looking scenarios based upon the reasonable beliefs of the third-party provider are not a guarantee of future performance. Actual results may differ materially from those anticipated in forward-looking or past performance statements. IC Markets makes no representation or warranty and assumes no liability as to the accuracy or completeness of the information provided, nor any loss arising from any investment based on a recommendation, forecast or any information supplied by any third-party.
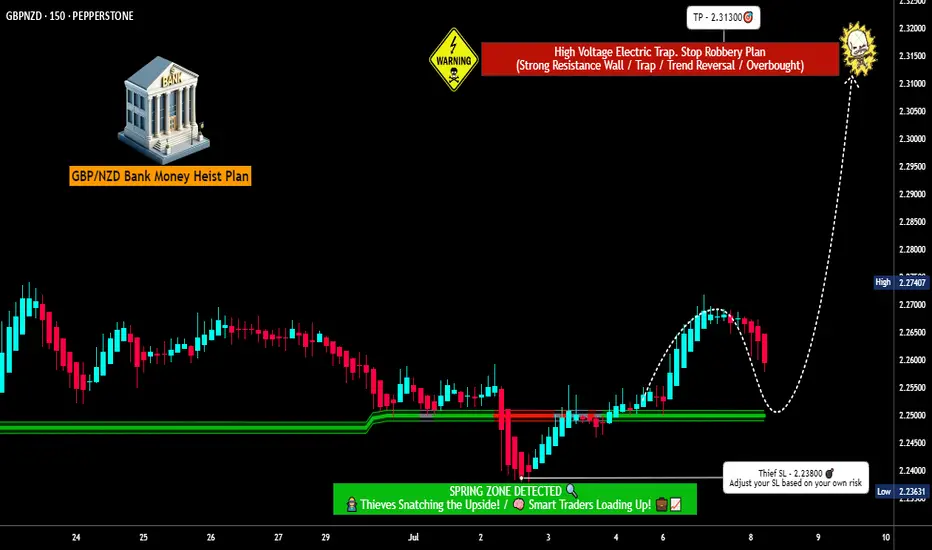
GBP/NZD Vault Breach?! Ready for a Clean Bullish Heist?🔓💷 GBP/NZD — The Sterling Vault Heist Plan 🐱💻💰💹
🌟Hi! Hola! Ola! Bonjour! Hallo! Marhaba!🌟
To all the Money Makers, Market Magicians, and Chart Whisperers — it's time for another precision strike in the forex jungle! 🤑📊⚔️
🚨 Operation: GBP/NZD – Sterling vs Kiwi Bank Play 🚨
We're eyeing a bullish breakout based on solid thief-style technicals and stealthy fundamentals. The play: Long entry with high conviction — the vault is cracked open, now it's about how smooth the job gets executed! 🏦💸
🎯 Setup Breakdown:
🎯Entry Zone:
The loot is there for the taking! Ideal entries near recent 15min or 30min lows/swing points — look for a pullback entry to join the bullish breakout crew.
🟢 The market shows strength, momentum, and intention.
🛑Stop Loss (Thief Shield):
Placed tactically near the 2H swing low (around 2.23800).
⚖️ Adjust based on your lot sizing, trade volume, and risk appetite — the escape route is always planned.
💰Target Area (The Vault Door):
📌 Eyeing 2.28500 as the final vault exit — but feel free to grab your profits early if the heat rises. 🔥
Smart robbers know when to vanish.
🧠 Scalper's Note:
Ride only on the bullish side.
💼 Got big pockets? Enter now.
💡 Running light? Wait for the retest and team up with swing players for the score.
Use Trailing SL to guard your gold — protect what you steal!
📚 Market Intel:
This bullishness is no accident — backed by:
📰 Macros | 💹 COT Data | 📊 Sentiment | 🔎 Intermarket Analysis
The vault doesn’t open every day — this move is calculated.
⚠️Heads Up:
News volatility can trigger alarms 🚨
❌ Avoid fresh entries during major releases
✅ Use trailing SLs to manage live positions
Stay sharp. React fast. Think like a thief. 🧠
💥 If you vibe with the Thief Trading Style, smash that ❤️Boost Button❤️ and support the squad!
We move smart, strike clean, and profit consistently. This is Forex Heisting, redefined.
Stay tuned — the next master plan is loading... 🧨🔐💷📈
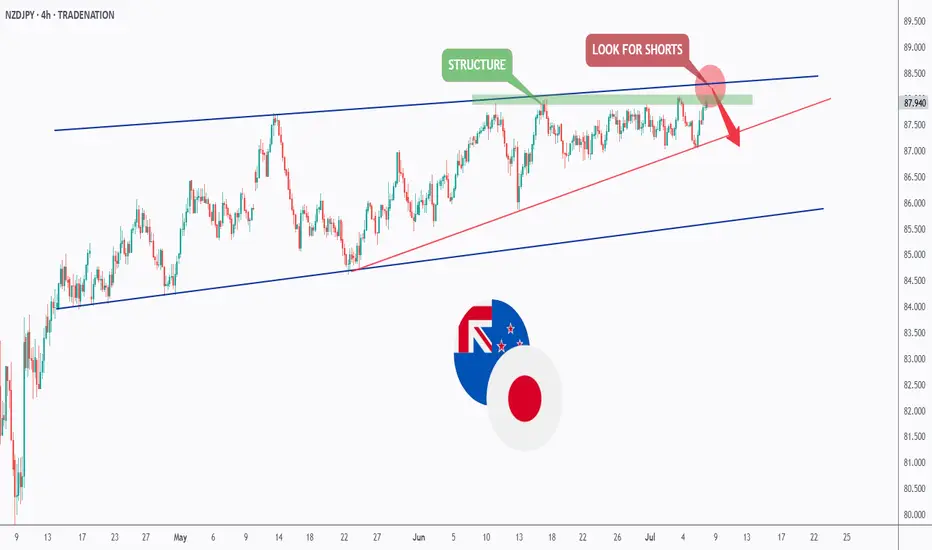
NZDJPY - bulls are exhausted! Hello TradingView Family / Fellow Traders. This is Richard, also known as theSignalyst.
📈NZDJPY has been overall bullish trading within the rising flat channel marked in blue and it is currently retesting the upper bound of it.
Moreover, the green zone is a strong structure.
🏹 Thus, the highlighted red circle is a strong area to look for sell setups as it is the intersection of the upper blue trendline and green structure.
📚 As per my trading style:
As #NZDJPY is hovering around the red circle zone, I will be looking for bearish reversal setups (like a double top pattern, trendline break , and so on...)
📚 Always follow your trading plan regarding entry, risk management, and trade management.
Good luck!
All Strategies Are Good; If Managed Properly!
~Rich
Disclosure: I am part of Trade Nation's Influencer program and receive a monthly fee for using their TradingView charts in my analysis.
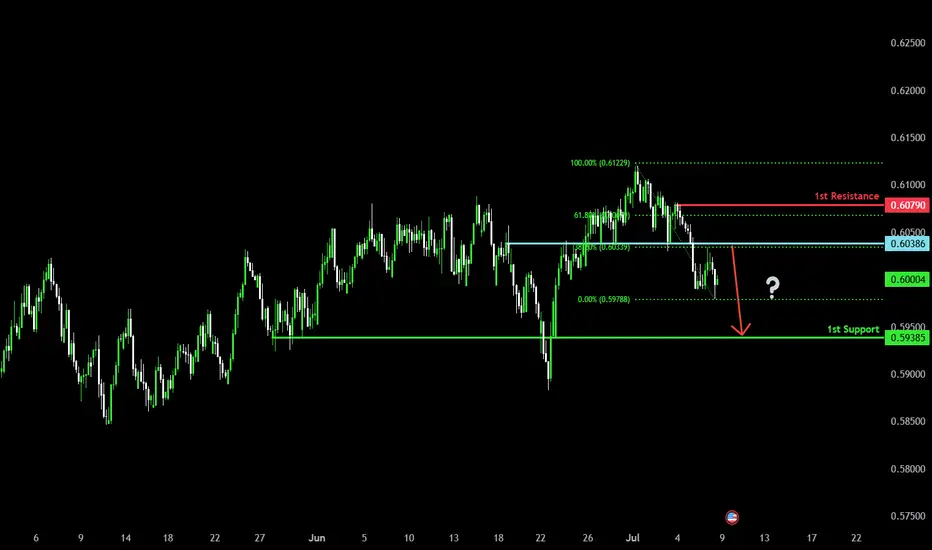
Bearish reversal for the Kiwi?The price has rejected off the pivot, which acts as an overlap resistance that lines up with the 38.2% Fibonacci retracement and could drop to the 1st support.
Pivot: 0.6038
1st Support: 0.5938
1st Resistance: 0.6079
Risk Warning:
Trading Forex and CFDs carries a high level of risk to your capital and you should only trade with money you can afford to lose. Trading Forex and CFDs may not be suitable for all investors, so please ensure that you fully understand the risks involved and seek independent advice if necessary.
Disclaimer:
The above opinions given constitute general market commentary, and do not constitute the opinion or advice of IC Markets or any form of personal or investment advice.
Any opinions, news, research, analyses, prices, other information, or links to third-party sites contained on this website are provided on an "as-is" basis, are intended only to be informative, is not an advice nor a recommendation, nor research, or a record of our trading prices, or an offer of, or solicitation for a transaction in any financial instrument and thus should not be treated as such. The information provided does not involve any specific investment objectives, financial situation and needs of any specific person who may receive it. Please be aware, that past performance is not a reliable indicator of future performance and/or results. Past Performance or Forward-looking scenarios based upon the reasonable beliefs of the third-party provider are not a guarantee of future performance. Actual results may differ materially from those anticipated in forward-looking or past performance statements. IC Markets makes no representation or warranty and assumes no liability as to the accuracy or completeness of the information provided, nor any loss arising from any investment based on a recommendation, forecast or any information supplied by any third-party.
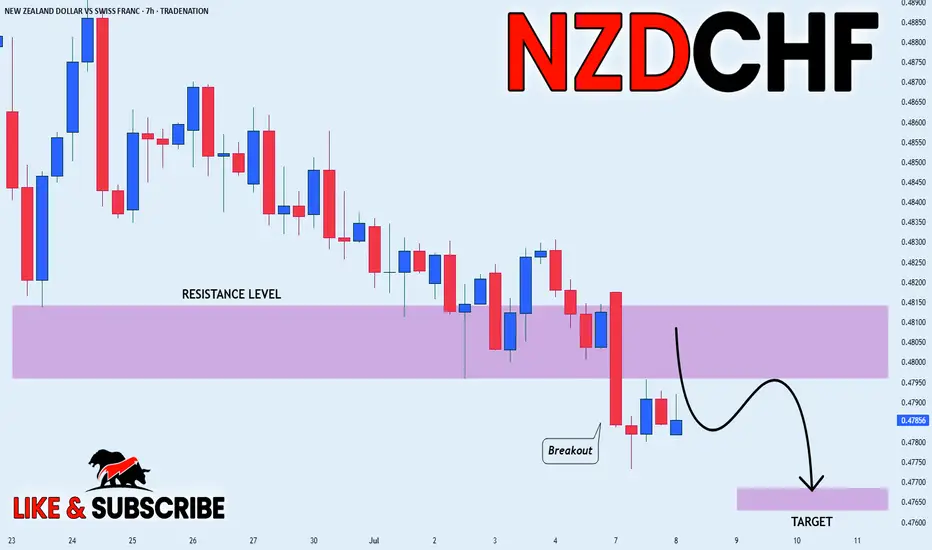
NZD_CHF BEARISH BREAKOUT|SHORT|
✅NZD_CHF keeps falling in
A strong downtrend and the pair
Made a bearish breakout and a
Retest of the key horizontal level
Of 0.4810 which is now a resistance
And the pair is already making a
Bearish pullback so we are
Bearish biased and we will be
Expecting a further bearish move down
SHORT🔥
✅Like and subscribe to never miss a new idea!✅
Disclosure: I am part of Trade Nation's Influencer program and receive a monthly fee for using their TradingView charts in my analysis.
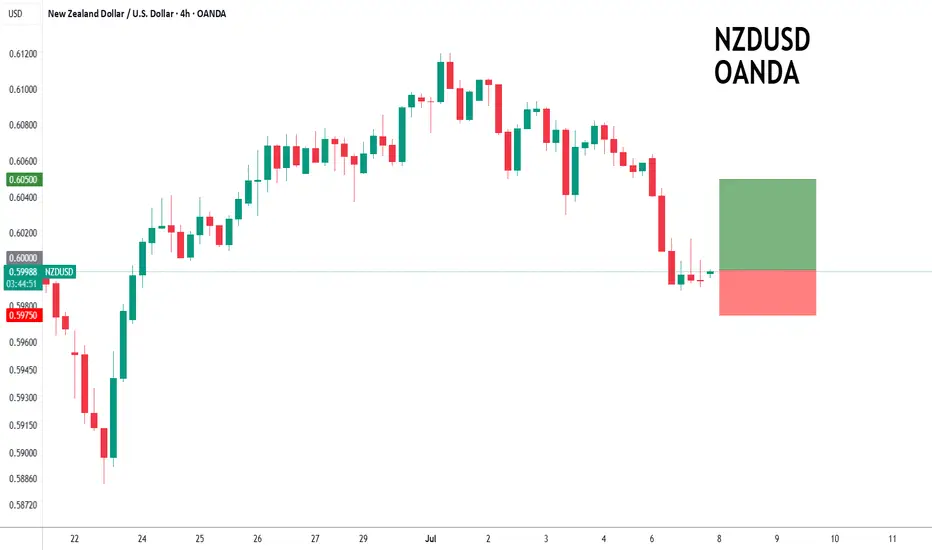
NZDUSD to find buyers at the current market price?NZDUSD - 24h expiry
The correction lower is assessed as being complete.
We expect a reversal in this move.
Risk/Reward would be poor to call a buy from current levels.
A move through 0.6025 will confirm the bullish momentum.
The measured move target is 0.6075.
We look to Buy at 0.6000 (stop at 0.5975)
Our profit targets will be 0.6050 and 0.6075
Resistance: 0.6025 / 0.6050 / 0.6075
Support: 0.6010 / 0.6000 / 0.5975
Risk Disclaimer
The trade ideas beyond this page are for informational purposes only and do not constitute investment advice or a solicitation to trade. This information is provided by Signal Centre, a third-party unaffiliated with OANDA, and is intended for general circulation only. OANDA does not guarantee the accuracy of this information and assumes no responsibilities for the information provided by the third party. The information does not take into account the specific investment objectives, financial situation, or particular needs of any particular person. You should take into account your specific investment objectives, financial situation, and particular needs before making a commitment to trade, including seeking advice from an independent financial adviser regarding the suitability of the investment, under a separate engagement, as you deem fit.
You accept that you assume all risks in independently viewing the contents and selecting a chosen strategy.
Where the research is distributed in Singapore to a person who is not an Accredited Investor, Expert Investor or an Institutional Investor, Oanda Asia Pacific Pte Ltd (“OAP“) accepts legal responsibility for the contents of the report to such persons only to the extent required by law. Singapore customers should contact OAP at 6579 8289 for matters arising from, or in connection with, the information/research distributed.
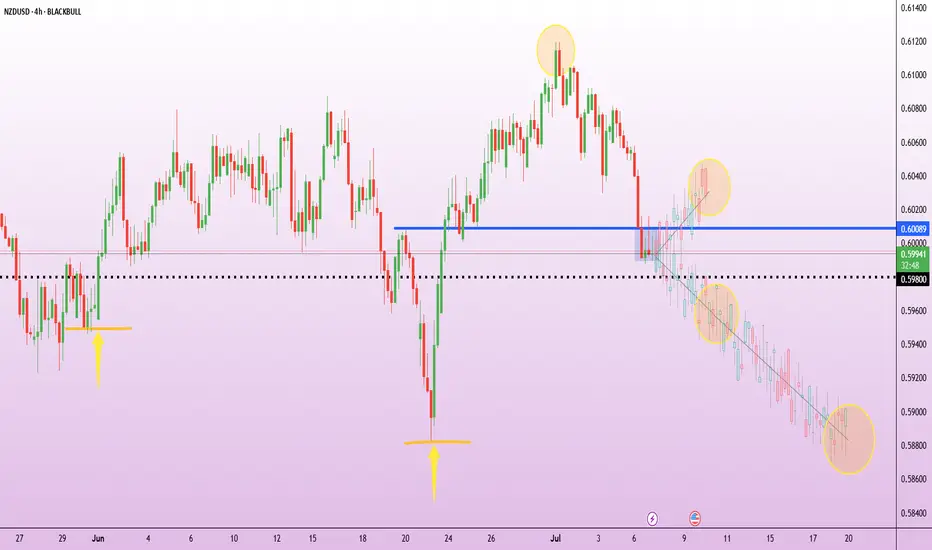
NZD/USD 2 moves away from wiping out June’s rallyThe RBNZ is widely expected to hold the Official Cash Rate at 3.25% this Wednesday.
NZIER’s Shadow Board advises against a cut, noting the economy remains weak but inflation pressures are mixed. Markets see just a 10–15% chance of a cut this week but still price for further easing by October.
NZD/USD has pulled back sharply from 0.6100, with price now possibly consolidating around 0.6000. This area coincides with a key support-turned-resistance level that capped price action in mid-June.
If the pair breaks below 0.5980, the next support sits near 0.5935 – a level that triggered a strong bounce on June 21. A break below that could open the way toward 0.5900 and 0.5860.
On the upside, if the 0.6000 handle holds, short-term resistance lies at 0.6030, with stronger pressure at 0.6065.
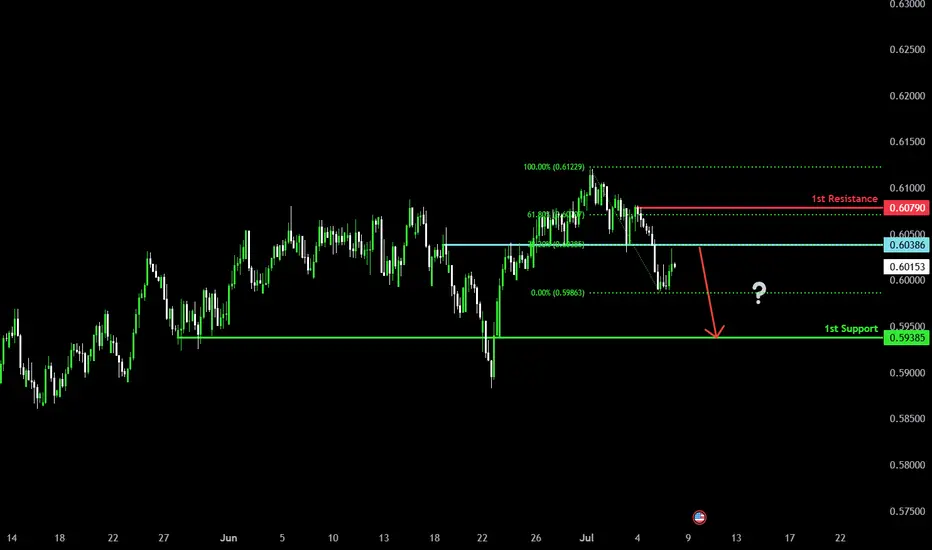
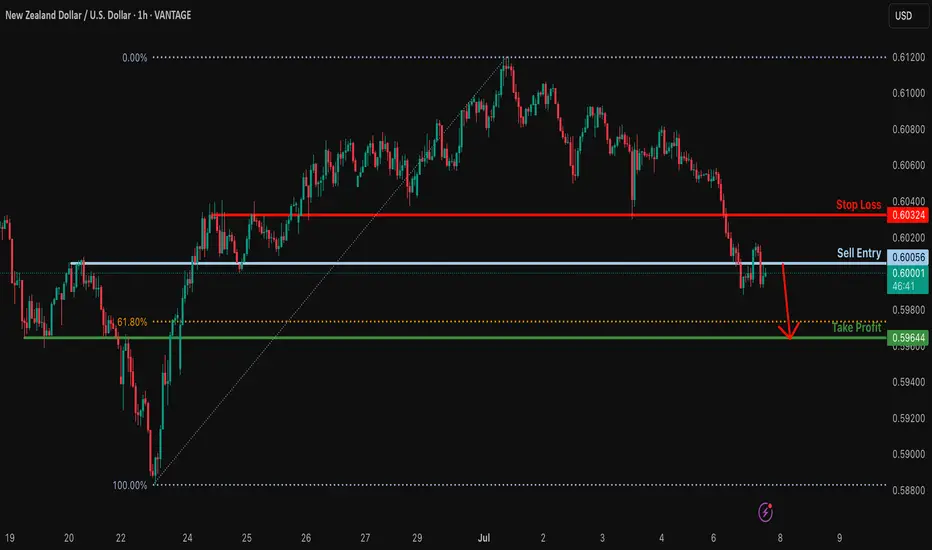
Bearish continuation?The Kiwi is reacting off the resistance level which is a pullback resistance and could drop from this level to our take profit.
Entry: 0.6005
Why we like it:
There is a pullback resistance.
Stop loss: 0.6032
Why we like it:
There is an overlap resistance.
Take profit: 0.5964
Why we like it:
There is a pullback support that is slightly below the 78.6% Fibonacci retracement.
Enjoying your TradingView experience? Review us!
Please be advised that the information presented on TradingView is provided to Vantage (‘Vantage Global Limited’, ‘we’) by a third-party provider (‘Everest Fortune Group’). Please be reminded that you are solely responsible for the trading decisions on your account. There is a very high degree of risk involved in trading. Any information and/or content is intended entirely for research, educational and informational purposes only and does not constitute investment or consultation advice or investment strategy. The information is not tailored to the investment needs of any specific person and therefore does not involve a consideration of any of the investment objectives, financial situation or needs of any viewer that may receive it. Kindly also note that past performance is not a reliable indicator of future results. Actual results may differ materially from those anticipated in forward-looking or past performance statements. We assume no liability as to the accuracy or completeness of any of the information and/or content provided herein and the Company cannot be held responsible for any omission, mistake nor for any loss or damage including without limitation to any loss of profit which may arise from reliance on any information supplied by Everest Fortune Group.
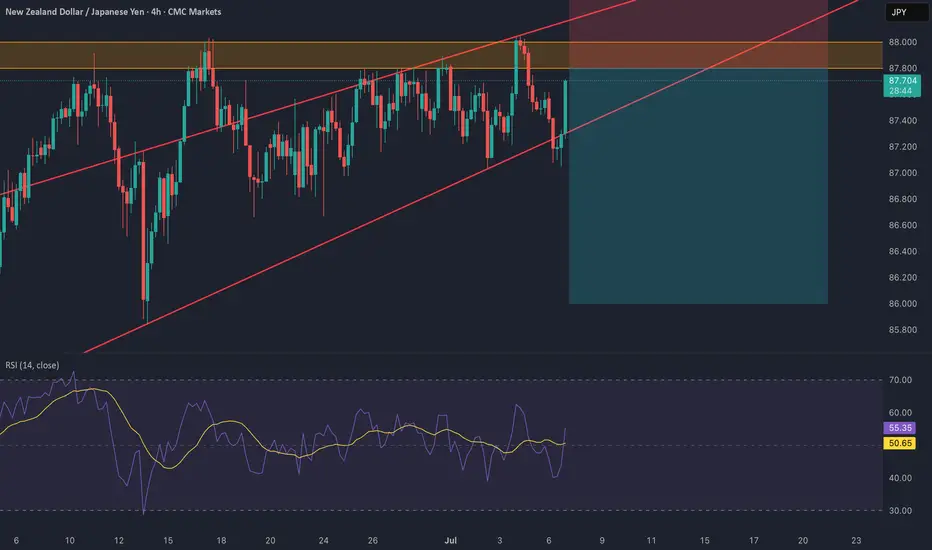
NZD/JPY: Bearish Wedge Before RBNZ CatalystThis is a high-conviction trade idea for NZD/JPY , where a perfect storm of technical and fundamental factors is aligning for a significant short opportunity. The setup is clean, the reasoning is strong, and we have a clear catalyst on the horizon. 🚀
Fundamental Analysis 🌪️
The macro picture is the primary driver here, creating a powerful bearish case.
1️⃣ Monetary Policy Divergence (🇳🇿 vs 🇯🇵): This is the core engine of the trade. The Reserve Bank of New Zealand (RBNZ) is dovish, signaling rate cuts amid a fragile domestic economy. In stark contrast, the Bank of Japan (BoJ) is hawkish, having started a historic policy normalization to combat persistent inflation. This fundamental clash is strongly bearish for NZD/JPY.
2️⃣ Risk-Off Catalyst (🇺🇸): The market is nervous ahead of the July 9th US tariff deadline . This uncertainty is creating a classic "risk-off" environment, which typically strengthens the safe-haven JPY and weakens risk-sensitive currencies like the NZD.
3️⃣ The RBNZ Decision (🏦): The main event on July 9. The market expects a "dovish hold," meaning even if rates are unchanged, the forward guidance will likely be very cautious, highlighting economic risks and signaling future cuts. This is the catalyst that could trigger the sell-off.
Technical Analysis 📉
The 4H chart provides crystal-clear confirmation of the fundamental weakness.
1️⃣ Bearish Rising Wedge: Price is being squeezed into a classic bearish reversal pattern. This shows that buying pressure is exhausted, and the market is preparing for a move to the downside.
2️⃣ Key Resistance Zone: The wedge is pushing directly into a heavy supply zone between 87.80 and 88.00 . This area has acted as a firm brick wall 🧱, rejecting multiple attempts to move higher.
3️⃣ RSI Momentum: The RSI below the chart confirms the weakening momentum. It's failing to show strong bullish power, which supports the price action and signals that the uptrend is running out of steam. 💨
The Trade Plan 🎯
Based on this analysis, the plan is to enter with a limit order to get an optimal entry price on a potential final spike into resistance.
Direction: Short (Sell) 📉
Order Type: Limit Sell
Entry: 87.80 📍
Stop Loss: 88.40 🛡️
Take Profit: 86.00 💰
Risk/Reward Ratio: 1:3 ⭐⭐⭐
This setup presents a rare confluence of fundamental divergence, technical weakness, and a clear catalyst.
Trade safe and manage your risk.
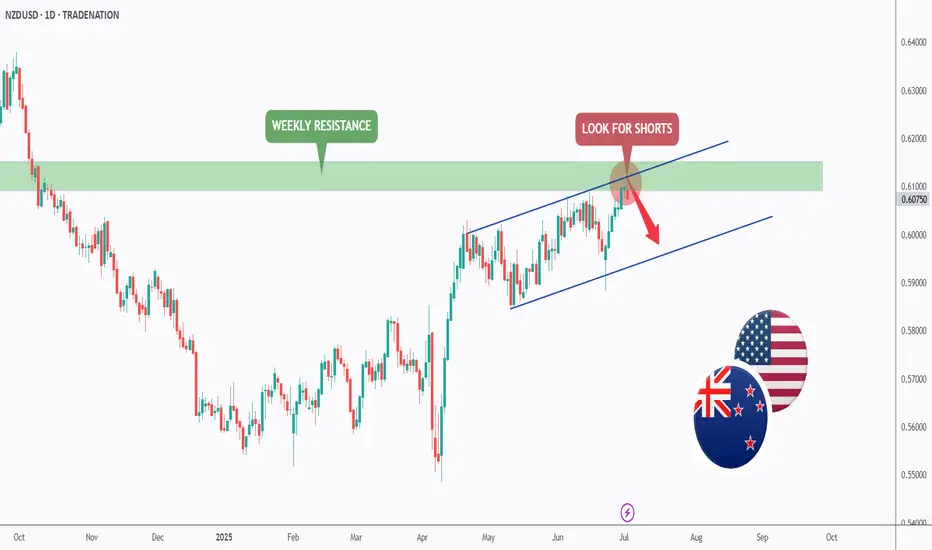
NZDUSD - The Bulls Are Exhausted! Hello TradingView Family / Fellow Traders. This is Richard, also known as theSignalyst.
📈NZDUSD has been overall bullish trading within the rising channel marked in blue and it is currently retesting the upper bound of it.
Moreover, the green zone is a strong weekly resistance.
🏹 Thus, the highlighted red circle is a strong area to look for sell setups as it is the intersection of the upper blue trendline and green resistance.
📚 As per my trading style:
As #NZDUSD is hovering around the red circle zone, I will be looking for bearish reversal setups (like a double top pattern, trendline break , and so on...)
📚 Always follow your trading plan regarding entry, risk management, and trade management.
Good luck!
All Strategies Are Good; If Managed Properly!
~Rich
Disclosure: I am part of Trade Nation's Influencer program and receive a monthly fee for using their TradingView charts in my analysis.
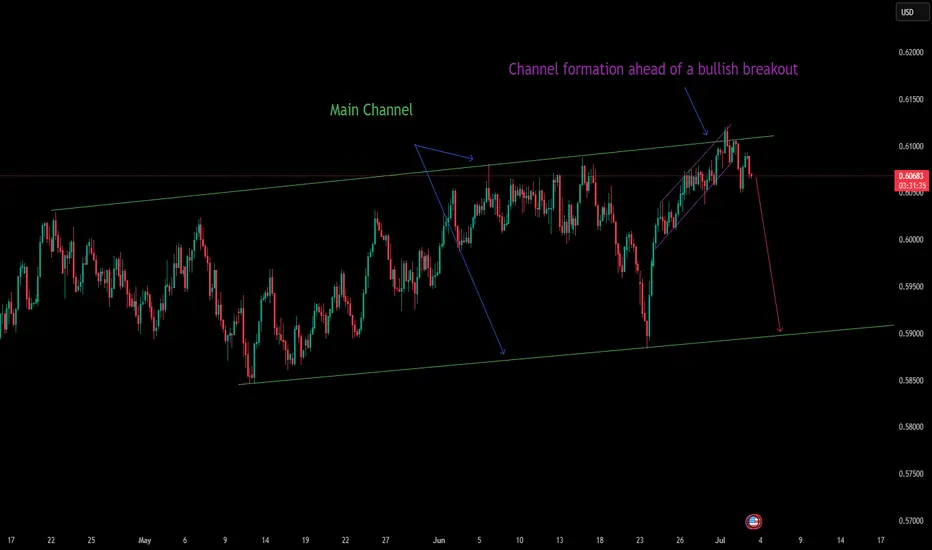
A fall is on the horizon — watch out!OANDA:NZDUSD
Channel breakout confirmed, with sellers showing interest.
The price is now ideal for shorts — I’m jumping in.
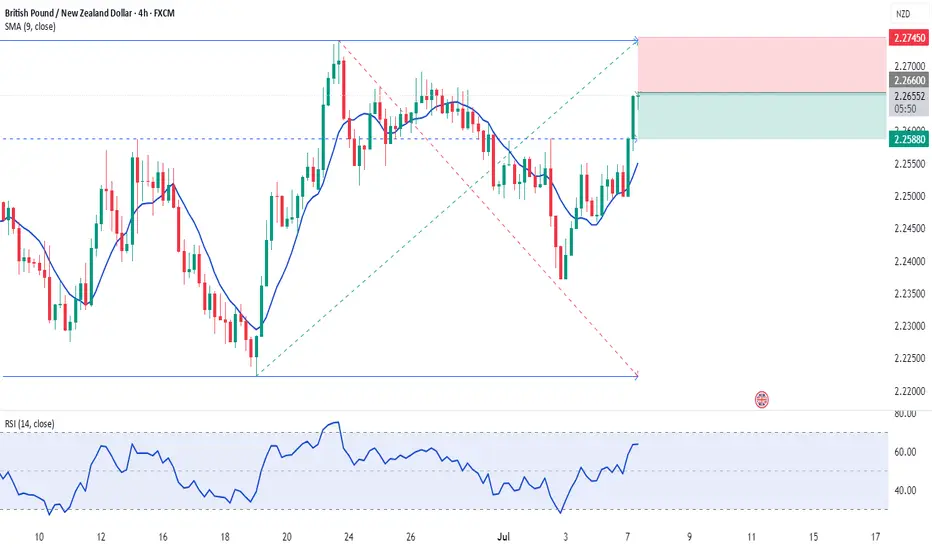
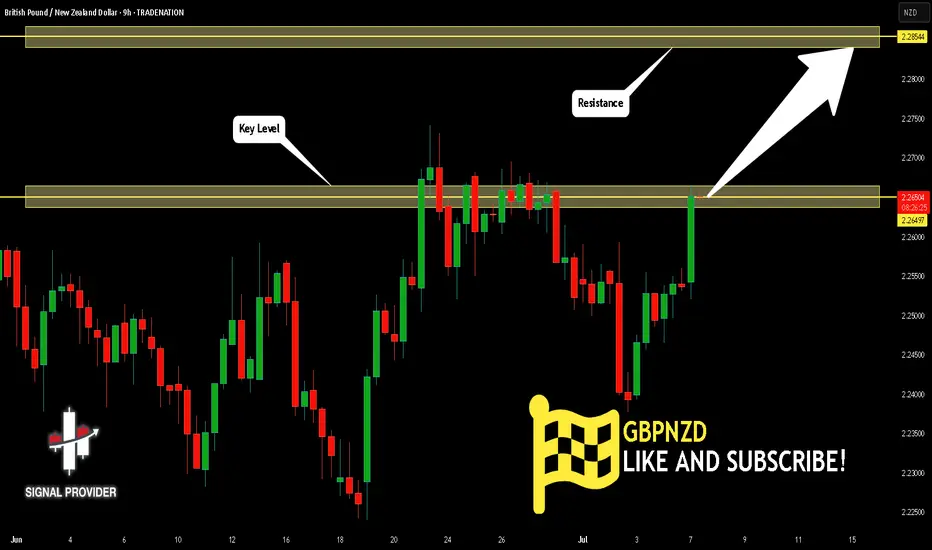
GBPNZD Will Go Up! Long!
Here is our detailed technical review for GBPNZD.
Time Frame: 9h
Current Trend: Bullish
Sentiment: Oversold (based on 7-period RSI)
Forecast: Bullish
The market is trading around a solid horizontal structure 2.264.
The above observations make me that the market will inevitably achieve 2.285 level.
P.S
Overbought describes a period of time where there has been a significant and consistent upward move in price over a period of time without much pullback.
Disclosure: I am part of Trade Nation's Influencer program and receive a monthly fee for using their TradingView charts in my analysis.
Like and subscribe and comment my ideas if you enjoy them!
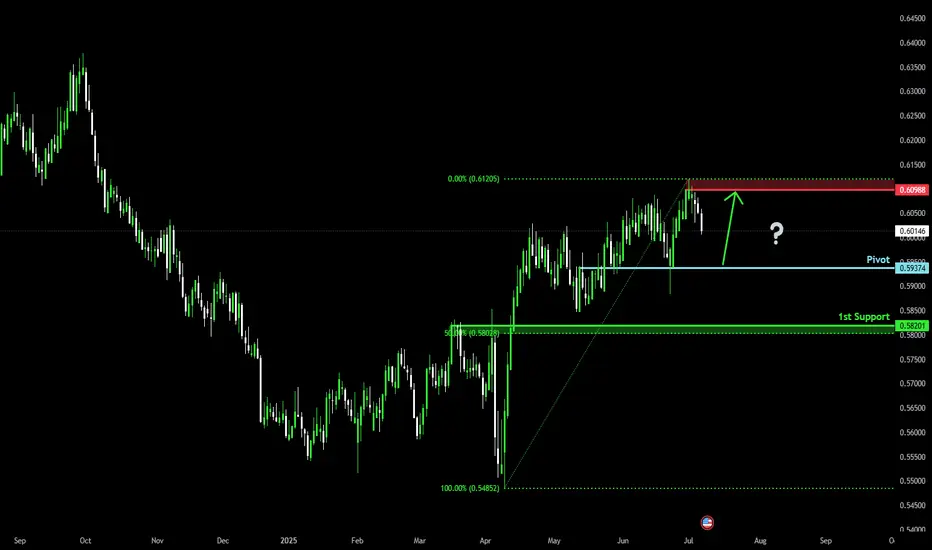
Bullish bounce?The Kiwi (NZD/USD) is falling towards the pivot and could bounce to the 1st support which has been identified as a pullback support.
Pivot: 0.5937
1st Support: 0.5820
1st Resistance: 0.6098
Risk Warning:
Trading Forex and CFDs carries a high level of risk to your capital and you should only trade with money you can afford to lose. Trading Forex and CFDs may not be suitable for all investors, so please ensure that you fully understand the risks involved and seek independent advice if necessary.
Disclaimer:
The above opinions given constitute general market commentary, and do not constitute the opinion or advice of IC Markets or any form of personal or investment advice.
Any opinions, news, research, analyses, prices, other information, or links to third-party sites contained on this website are provided on an "as-is" basis, are intended only to be informative, is not an advice nor a recommendation, nor research, or a record of our trading prices, or an offer of, or solicitation for a transaction in any financial instrument and thus should not be treated as such. The information provided does not involve any specific investment objectives, financial situation and needs of any specific person who may receive it. Please be aware, that past performance is not a reliable indicator of future performance and/or results. Past Performance or Forward-looking scenarios based upon the reasonable beliefs of the third-party provider are not a guarantee of future performance. Actual results may differ materially from those anticipated in forward-looking or past performance statements. IC Markets makes no representation or warranty and assumes no liability as to the accuracy or completeness of the information provided, nor any loss arising from any investment based on a recommendation, forecast or any information supplied by any third-party.
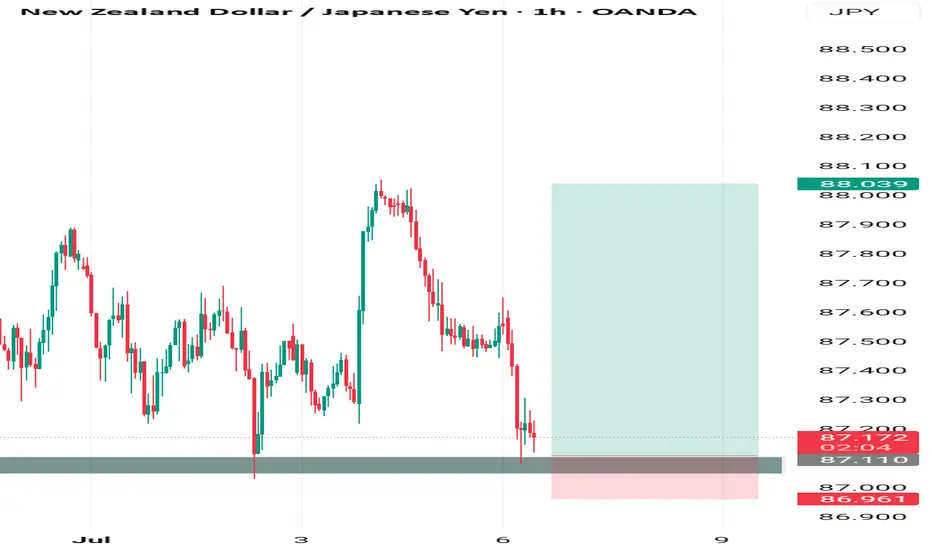
Buy NZDJPY Buy Opportunities on NZDJPY
ENTRY: 87.100
STOPLOSS: 86.900
TAKE PROFIT: 88.00
COMMENT YOUR OPINION
For fund management contact me on X @shajudeakinoba1
GBPUSD UPDATE (NICE CHART)Hello friends
Given the failure of the pain and the strong growth of the price, you can see that the price is in correction, which is a good opportunity for safe purchases at the indicated support points, of course with capital and risk management...
*Trade safely with us*

NZDJPY Potential UpsidesHey Traders, in the coming week we are monitoring NZDJPY for a buying opportunity around 87.200 zone, NZDJPY is trading in an uptrend and currently is in a correction phase in which it is approaching the trend at 87.200 support and resistance area.
Trade safe, Joe.
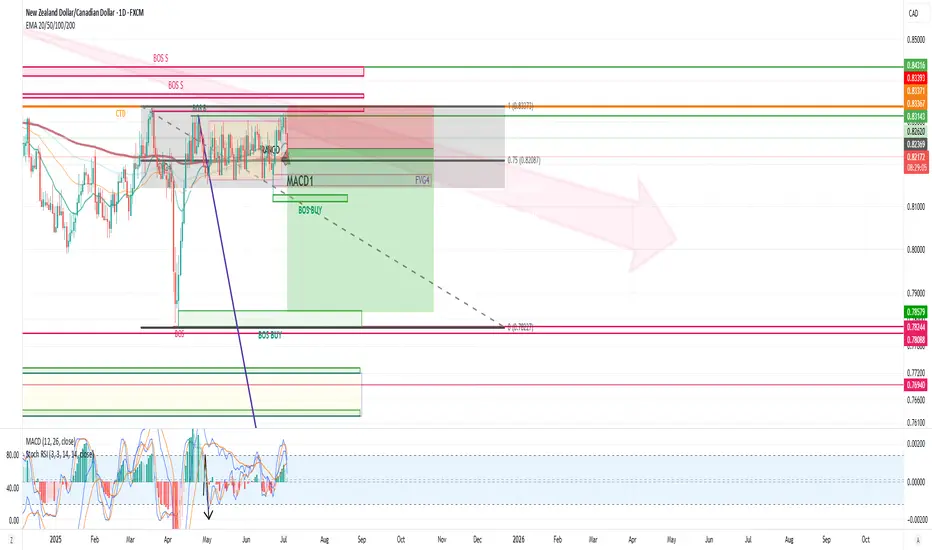
NZDCAD: High-Conviction Long - Fundamental Strength & TechnicalThis analysis identifies an extremely high-conviction long opportunity in the NZDCAD currency pair 📈🇨🇦🇳🇿. Our conviction is primarily driven by a significant divergence in monetary policy outlooks and economic fundamentals between New Zealand and Canada. New Zealand's economic resilience, underpinned by robust dairy prices and a less dovish central bank stance, contrasts sharply with Canada's decelerating growth, rising unemployment, and a central bank poised for further rate cuts amidst trade policy uncertainties. Technically, NZDCAD appears poised for an upward move from key support levels, supported by bullish momentum indicators on the 4-hour chart. This is a medium-term trade expected to play out over days to weeks. 🗓️
I. Fundamental Rationale: Diverging Economic Trajectories 📊🌍
The core of this trade lies in the starkly different economic paths New Zealand and Canada are currently on, creating a compelling fundamental case for NZD appreciation against CAD:
Monetary Policy Divergence:
New Zealand (NZD): The Reserve Bank of New Zealand (RBNZ) maintained its Official Cash Rate (OCR) at 3.25% in June 2025. Analysts anticipate a hold at the upcoming July 9 meeting, balancing growth concerns with an "uncomfortably high near-term inflation outlook". This signals a less aggressive easing path. 🏦🇳🇿
Canada (CAD): In contrast, the Bank of Canada (BoC) held its policy rate steady at 2.75% in June 2025, after nine consecutive 0.25% cuts since June 2024. Market expectations for the upcoming July 30, 2025 meeting indicate a 33% chance of a further 25 basis point cut, with economists anticipating gradual cuts to 2.25% by mid-2025. This clear easing bias is driven by consistently below-target inflation (1.73% in May 2025). 📉🇨🇦
Impact: This creates a clear and widening interest rate differential fundamentally favoring the NZD. 💰
Inflation Outlook:
New Zealand: Annual inflation accelerated to 2.5% in Q1 2025, exceeding market expectations and marking the highest rate since June 2024. This reinforces the RBNZ's cautious stance. ⬆️
Canada: Canada's CPI registered 1.73% in May 2025, notably below the BoC's 2.0% target, providing ample justification for further monetary easing. ⬇️
Economic Performance & Labor Market:
New Zealand: GDP is projected to grow by 1.9% in 2025. The unemployment rate remained unchanged at 5.1% in March 2025, with average hourly earnings increasing by 4.5% annually. 💼✨
Canada: Real GDP contracted by 0.1% in April 2025, with a flash estimate pointing to another 0.1% decline in May, implying an annualized loss of 0.3% in Q2 2025. The unemployment rate rose to 7.0% in May 2025, its highest since September 2016 (excluding pandemic years). 📉🏭
Impact: New Zealand demonstrates greater economic resilience and a more stable labor market. 💪
Commodity & Trade Dynamics:
New Zealand: Benefits significantly from surging dairy prices, its top export commodity, which saw a substantial 10% increase in Q1 2025, with Fonterra forecasting record milk prices and production volumes. This contributed to a robust monthly trade surplus of $1.2 billion in May 2025. 🥛🧀💰
Canada: While the CAD maintains a strong positive correlation with oil prices, energy exports decreased by 5.6% in May, with crude oil exports falling 4.0%. Furthermore, Canadian exports to the US have declined for four consecutive months due to ongoing US tariffs. 🛢️📉
Impact: Strong commodity tailwinds and a healthy trade surplus for NZD, versus tariff-induced headwinds and declining energy exports for CAD. 🌬️
Yield Differential: The New Zealand 10-year government bond yield (4.57% as of June 30, 2025) is notably higher than Canada's (3.38% as of July 3, 2025). This provides a positive carry for holding NZD over CAD. 📊
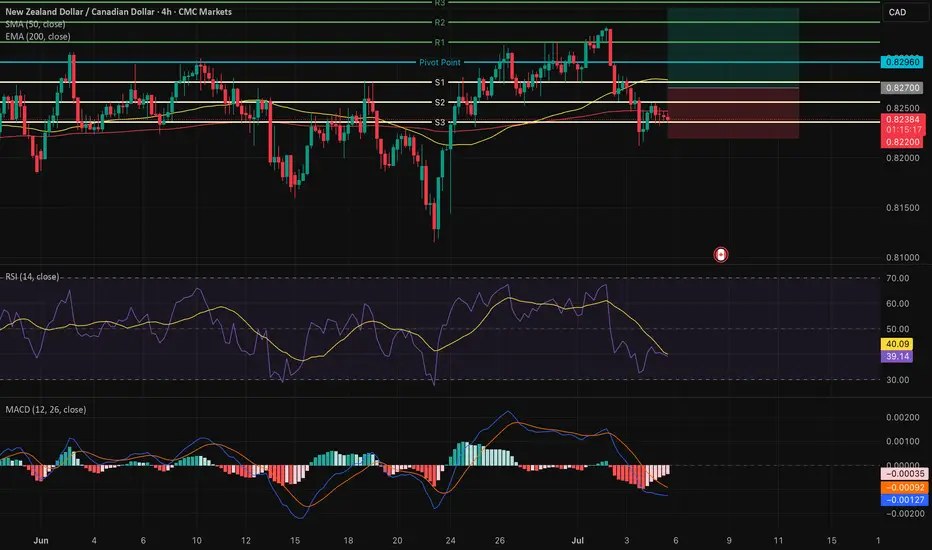
II. Technical Rationale: Chart Insights (4-Hour Timeframe) 📈🔍
The technical picture on the 4-hour chart supports a bullish reversal from current levels, complementing the fundamental outlook:
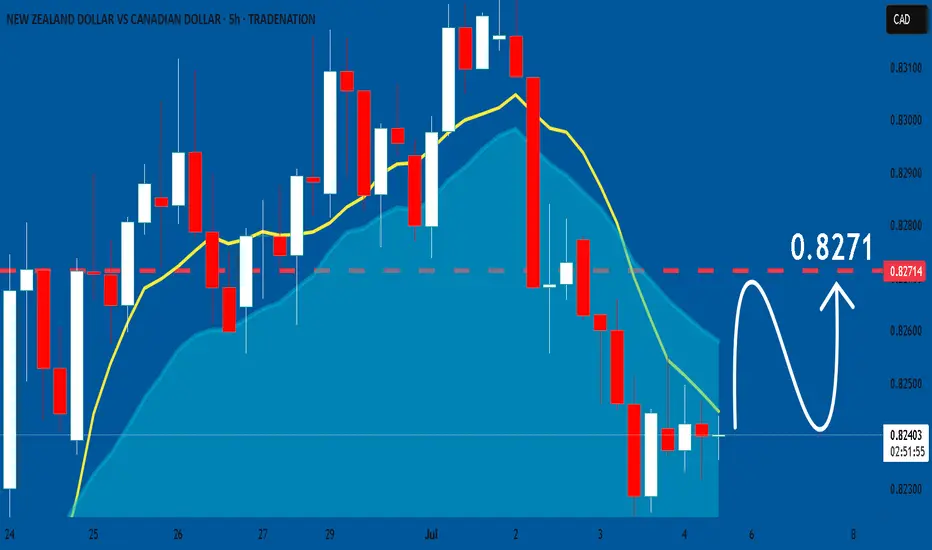
Current Price Action & Long-Term Trend: NZDCAD is currently approximately 0.8277 (as of July 1, 2025). While short-term analyses may show a "sharp bearish trend," the pair is described as "trading in an uptrend and currently is in a correction phase" as it approaches a key support area. The 1-month change for NZDCAD is +0.13%, and year-to-date is +2.45%, indicating a longer-term bullish bias despite recent fluctuations. This corrective dip presents a favorable entry point. 📉➡️📈
Key Support & Resistance Levels:
Entry Point (0.8270) is strategically chosen near the immediate support cluster, specifically around the Pivot Point 1st Support of 0.8276 and an identified buying opportunity zone around 0.82700. ✅
Take Profit (TP) of 0.8350 is positioned just below the Pivot Point 3rd Level Resistance of 0.8356. 🎯
Stop Loss (SL) of 0.8220) is carefully placed below the key support levels of 0.8240 (Pivot Point 3rd Support) and 0.8236 (Pivot Point 3rd Support). A sustained break below this level would invalidate the bullish thesis. 🛑
Momentum Indicators:
RSI (14): The 14-day RSI for NZDCAD is around 41.78 to 54.33, suggesting a neutral to slightly bullish sentiment, with room for upward movement. 📊
MACD (12, 26, 9): A "bullish divergence" has been identified on the hourly timeframe, often signaling a return of buying interest. The MACD line is also observed to be slightly above its signal line, hinting at a potential bullish crossover. ⬆️
Moving Averages: The 50-day Simple Moving Average (SMA) is positioned slightly above the 200-day Exponential Moving Average (EMA). This configuration suggests a potential bullish crossover of longer-term moving averages, generally considered a positive long-term signal. 📈
III. Trade Setup: 📋✨
Currency Pair: NZDCAD 🇳🇿🇨🇦
Direction: Long (Buy) ⬆️
Entry Point: 0.8270
Take Profit (TP): 0.8350
Stop Loss (SL): 0.8220
Calculated Risk (in pips): 50 pips
Calculated Reward (in pips): 80 pips
Risk-Reward Ratio: Approximately 1.6:1 (A favorable ratio for a high-probability setup!) ✅
Key Considerations: Always adhere to strict risk management principles, risking no more than 1-2% of your total trading capital on this single trade. Be mindful of potential volatility around upcoming high-impact economic events in July, particularly the RBNZ and Bank of Canada interest rate decisions, and inflation data. 🗓️🔔
NZDCAD: Market of Buyers
Our strategy, polished by years of trial and error has helped us identify what seems to be a great trading opportunity and we are here to share it with you as the time is ripe for us to buy NZDCAD.
Disclosure: I am part of Trade Nation's Influencer program and receive a monthly fee for using their TradingView charts in my analysis.
❤️ Please, support our work with like & comment! ❤️
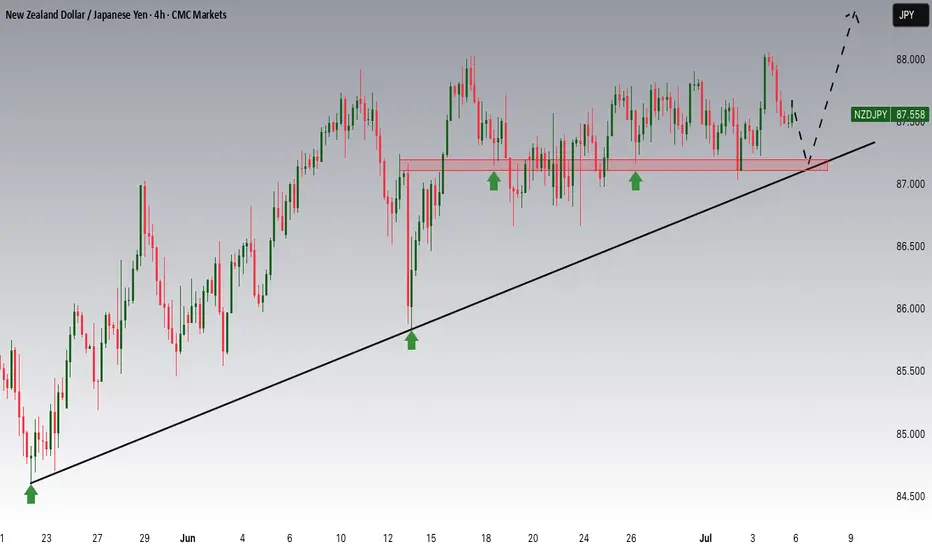
NZDJPY is in an ascending triangle?Looking at the technical picture, FX_IDC:NZDJPY is in an ascending triangle formation. According to the TA rules, such patterns tend to break to the upside, but a confirmation break is still needed. Let's dig in.
MARKETSCOM:NZDJPY
Let us know what you think in the comments below.
Thank you.
77.3% of retail investor accounts lose money when trading CFDs with this provider. You should consider whether you understand how CFDs work and whether you can afford to take the high risk of losing your money. Past performance is not necessarily indicative of future results. The value of investments may fall as well as rise and the investor may not get back the amount initially invested. This content is not intended for nor applicable to residents of the UK. Cryptocurrency CFDs and spread bets are restricted in the UK for all retail clients.

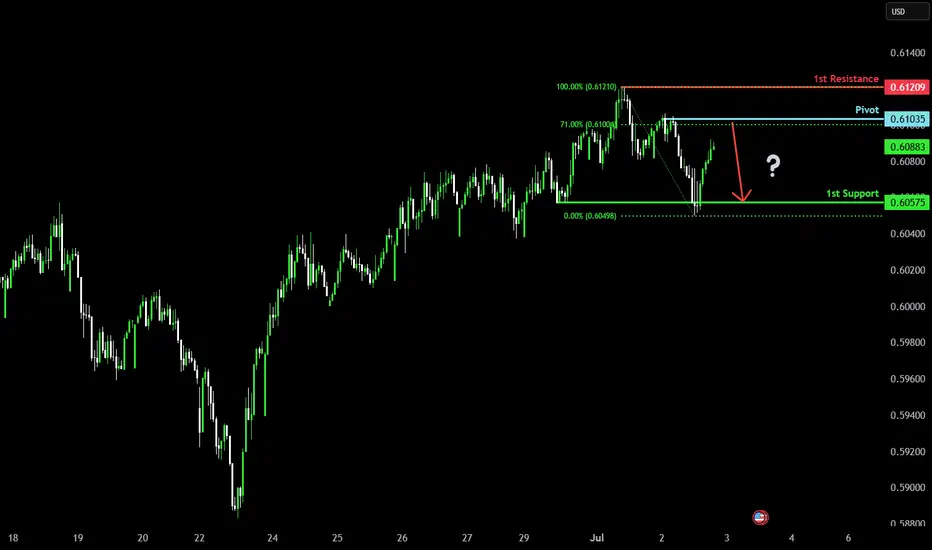
Heading into pullback resistance?The Kiwi (NZD/USD) is rising towards the pivot which is a pullback resistance and could reverse to the 1st support.
Pivot: 0.6103
1st Support: 0.6057
1st Resistance: 0.6120
Risk Warning:
Trading Forex and CFDs carries a high level of risk to your capital and you should only trade with money you can afford to lose. Trading Forex and CFDs may not be suitable for all investors, so please ensure that you fully understand the risks involved and seek independent advice if necessary.
Disclaimer:
The above opinions given constitute general market commentary, and do not constitute the opinion or advice of IC Markets or any form of personal or investment advice.
Any opinions, news, research, analyses, prices, other information, or links to third-party sites contained on this website are provided on an "as-is" basis, are intended only to be informative, is not an advice nor a recommendation, nor research, or a record of our trading prices, or an offer of, or solicitation for a transaction in any financial instrument and thus should not be treated as such. The information provided does not involve any specific investment objectives, financial situation and needs of any specific person who may receive it. Please be aware, that past performance is not a reliable indicator of future performance and/or results. Past Performance or Forward-looking scenarios based upon the reasonable beliefs of the third-party provider are not a guarantee of future performance. Actual results may differ materially from those anticipated in forward-looking or past performance statements. IC Markets makes no representation or warranty and assumes no liability as to the accuracy or completeness of the information provided, nor any loss arising from any investment based on a recommendation, forecast or any information supplied by any third-party.