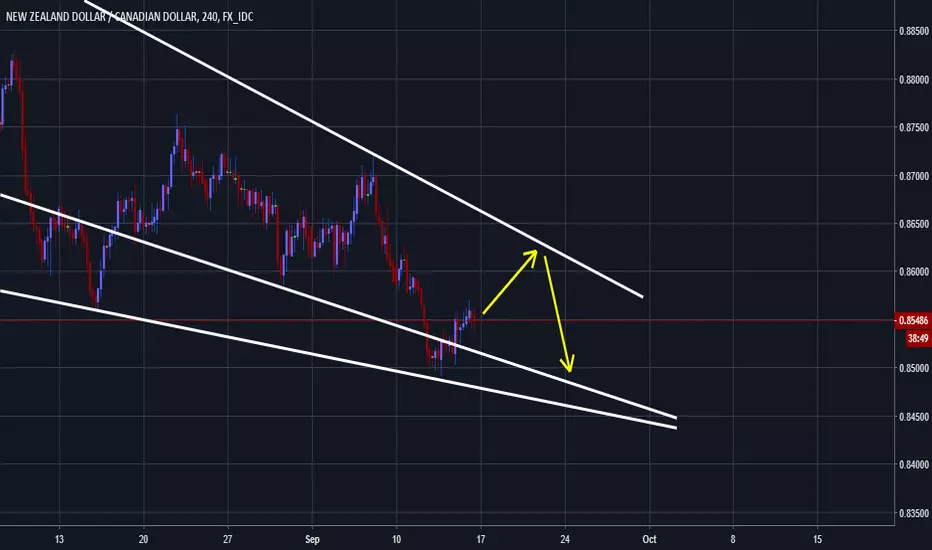
nzdcadok folks since we get precise that nice move down as on previous chart, now im expecting so see some more deeper correction before rushing down again. its early to say whats gonna be but here on this chart im showing my expectations for running flat and expanding. for those who understand patterns there is a gartley taken from the top and butterfly taken from A of the correction. show some love for more updates!
NZDCADIDEA

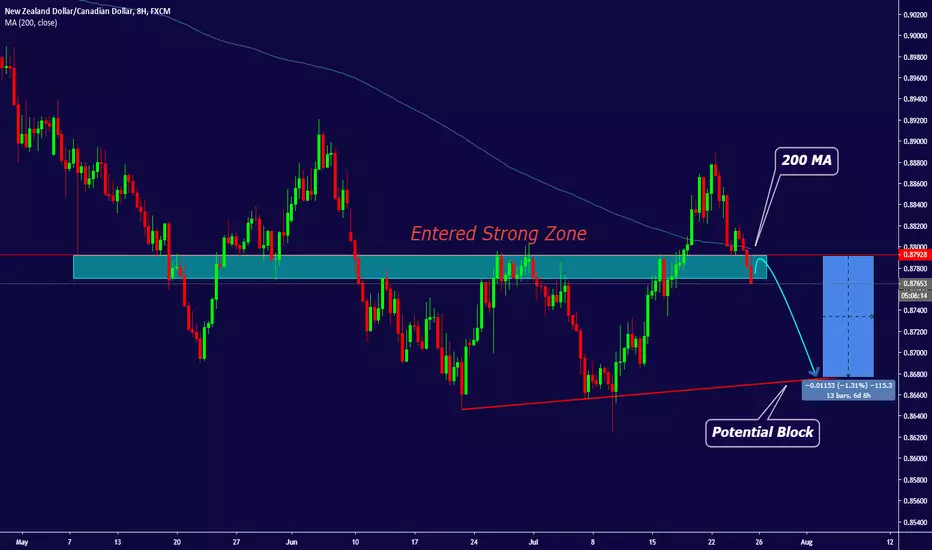
NZDCAD Potential S&D Zone Break with 200 MA BlockGive an inspirational like :)
ArrowPips: Under 200 MA, there is a short potential for NZDCAD.

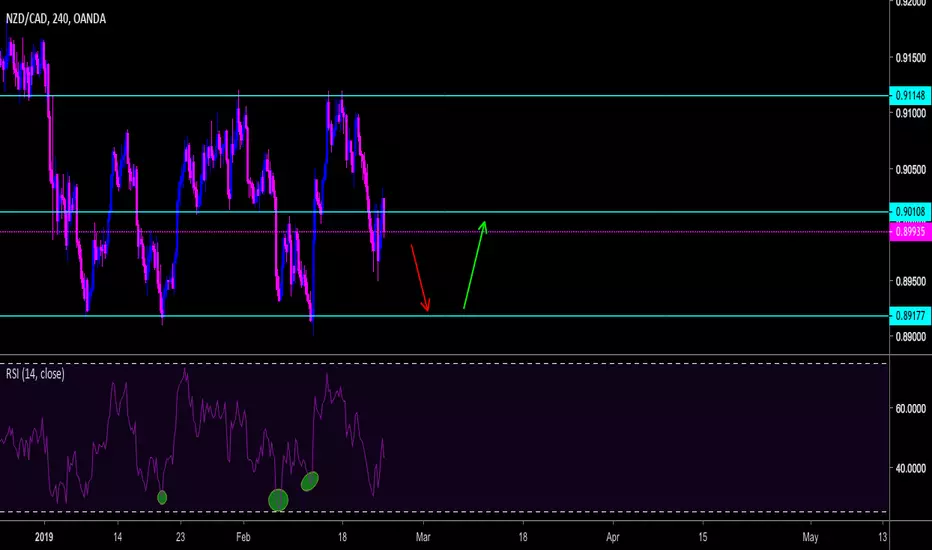
NZDCAD en Largo
Posible formación de patrón armónico
A la baja para posible llegar al nivel 61.8% y luego ir en compra
MACD en nivel inferior para cambio de dirección a tendencia alcista
RSI y STOCH en nivel de sobre venta

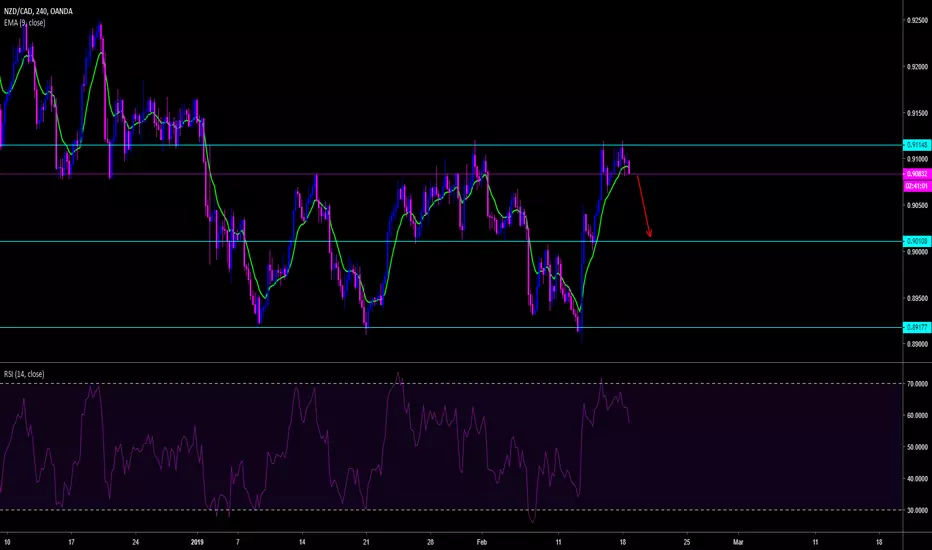
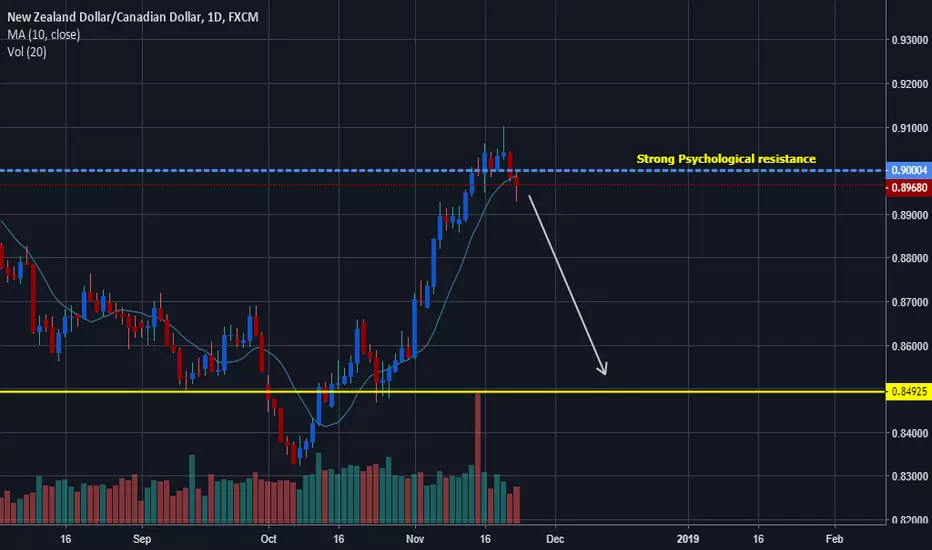
NZDCAD 1Dnzdcad is already break trendline. so, wait for moment it's break the resistance area
if nzdcad break the resist area you should take a long position.

NZD/CAD (RETEST PREVIOUS SUPPORT) H4NZD/CAD, my thoughts are to see a retest to the previous support zone, see the RSI oversold before I seek to get into this trade. Only looking to see these confirmations & if I like what I see I'm in!
Thanks for checking out my idea, let me know your thoughts.

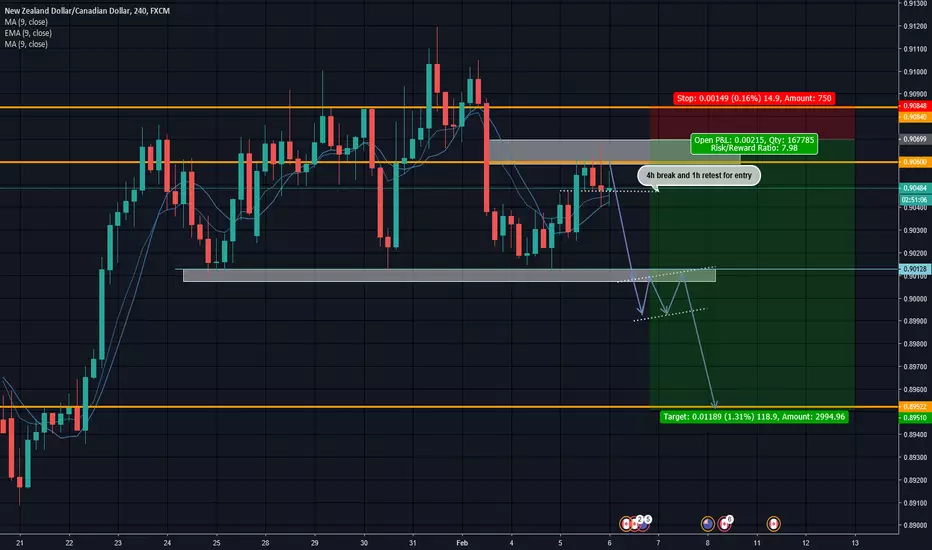
NZD CAD SHORT! GREAT SET UP NZD CAD, presenting us a great opportunity for a short.
A clear 4h break of 0.90476 and a retest on 1h would be a great entry for this pair. For a nice 120 pips!
I will updating you guys.
All of the best
TRADING PROTECTION

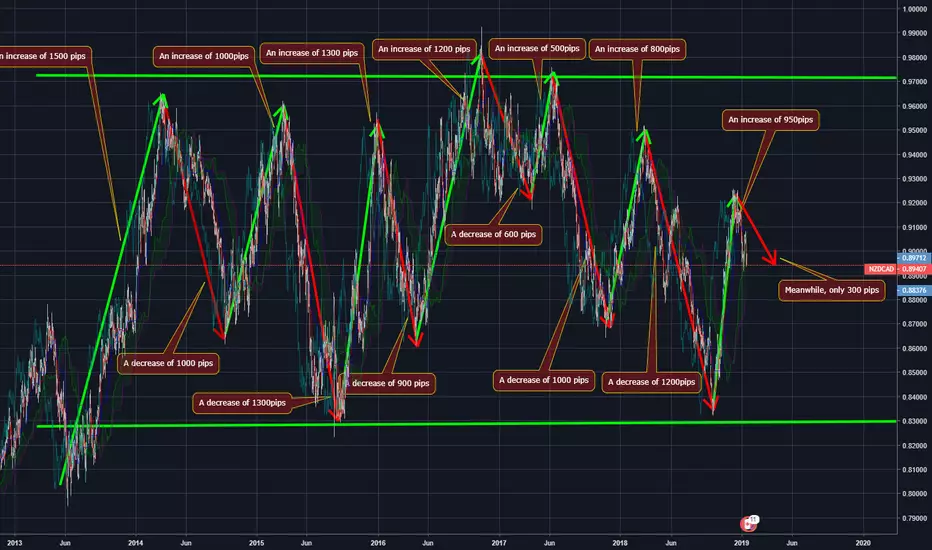
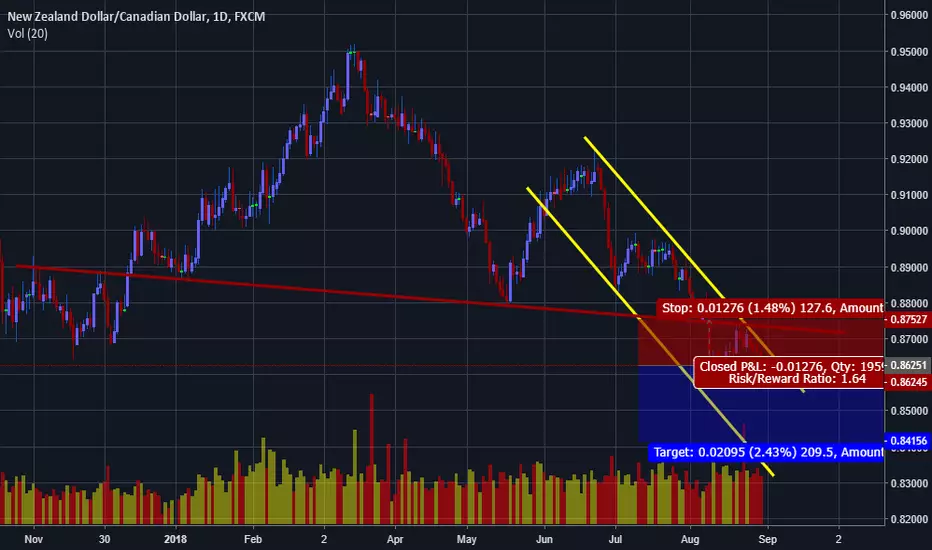
NZDCAD Technical Analysis D1+ SignalAs you can see in the graph above after each increase the price fell by an average of 1000 pips, At the moment we are about a drop of only 300 pips that means we have about 700 pips of price fall
Our signal: NZDCAD
Entry Price: 0.8932
Stop loss: 0.9150
Take Profit: 0.8300
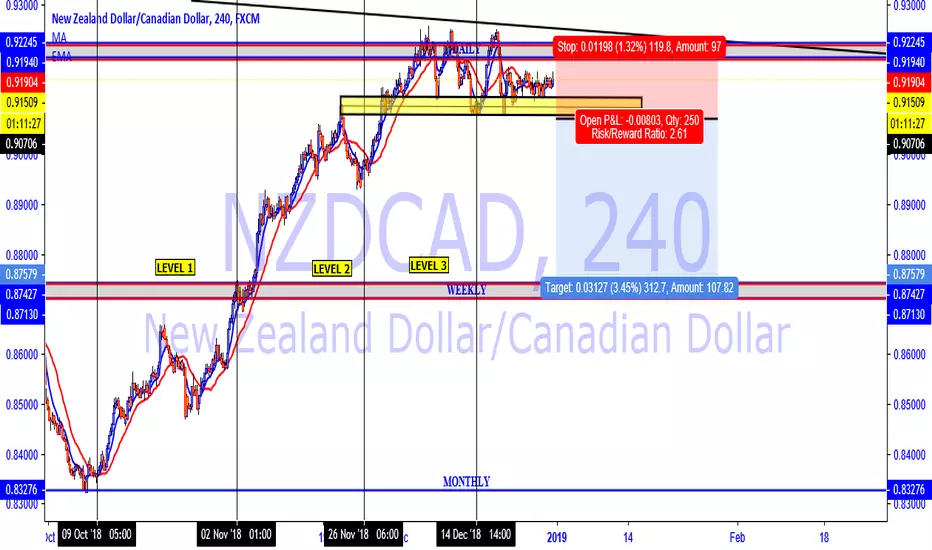
NZDCADPerfect 3 level rise, all timeframes from top down analysis shows this pair about to drop. right now its in consolidation, overall on this pair i like the sell on it.
NZDCAD Watch Out For Bollinger Band Spike And Support BreakHi traders,
I am hoping to see a clean Bollinger Band spike for a reversal to the downside. If it does not happen, then I will anticipate a trade once the support below breaks. Let's see how the chart develops. We will very likely see an RSI Divergence as well.
(This is not a trade recommendation!)

Short Term NZDCAD Long SetupThis research is for informational purposes and should not be construed as personal advice. Trading any financial market involves risk. Trading on leverage involves risk of losses greater than deposits.
Please comment below and Like if you agree with my analysis.
