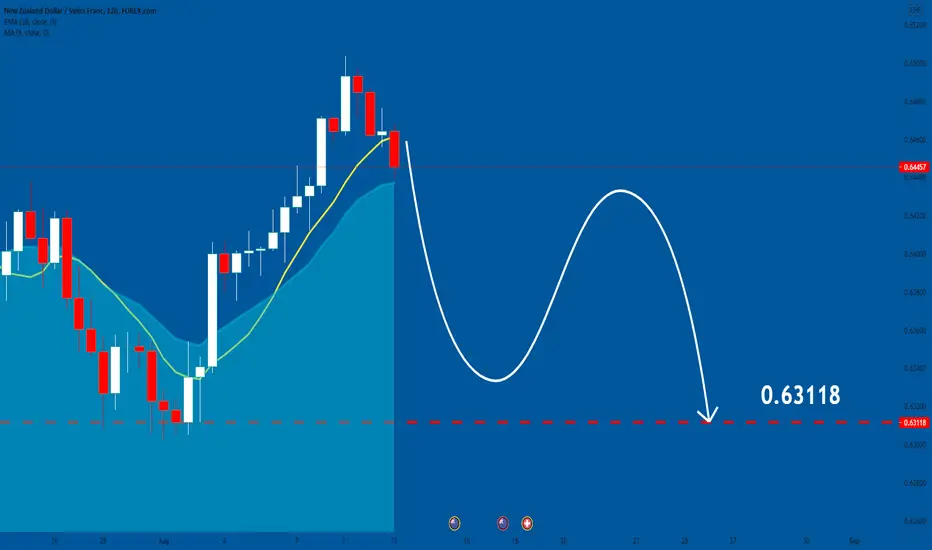
NZDCHF: Bears Will Push Lower
Hey traders,
Here is our forecast on NZDCHF.
The level where the price is trading right now is peculiar
and the price will most likely bounce from that.
Please, support our analysis with like and comment!
❤️ Please, support our work with like & comment! ❤️
Nzdchf-short
NZD/CHF BEARS ARE STRONG HERE|SHORT
Hello, Friends!
NZD/CHF appeared on my radar today
With the recent news and corresponding price action
Making me bearish on the pair
Therefore, a move down is to be expected
SELL!
✅LIKE AND COMMENT MY IDEAS✅
NZD/CHF SENDS CLEAR BEARISH SIGNALS|SHORT
Hello, Friends!
NZD/CHF appeared on my radar today
With the recent news and corresponding price action
Making me bearish on the pair
Therefore, a move down is to be expected
SELL!
✅LIKE AND COMMENT MY IDEAS✅
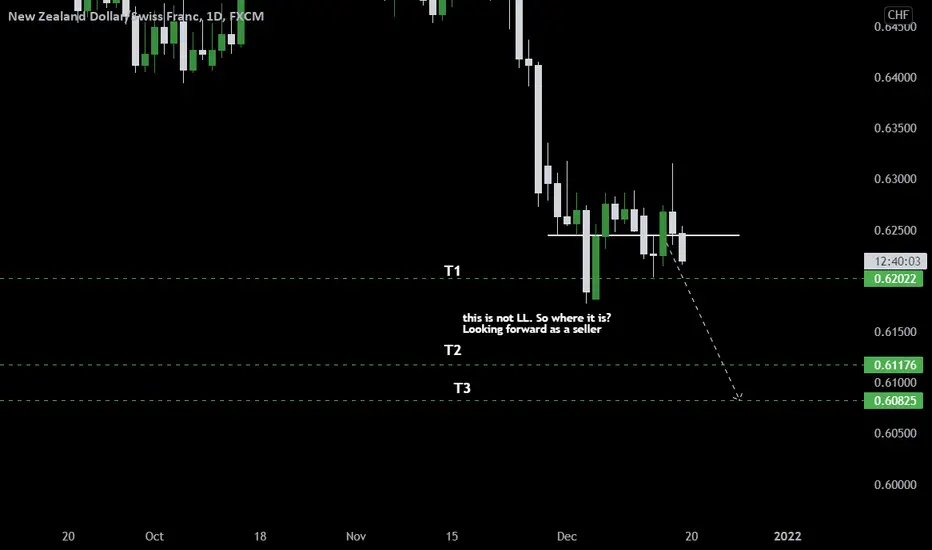
Where is Lower Low? Let's see if data can give us what we wantDo you think buyers have control, or sellers are still taking place at nzdchf?
We are looking this trade as a strong sell
Daily overall market sell
NZD correlation
trending sell
H4 buyers failure
D1 Lower Low failure
Continuation trending idea
Happy to share with you all
Cheers
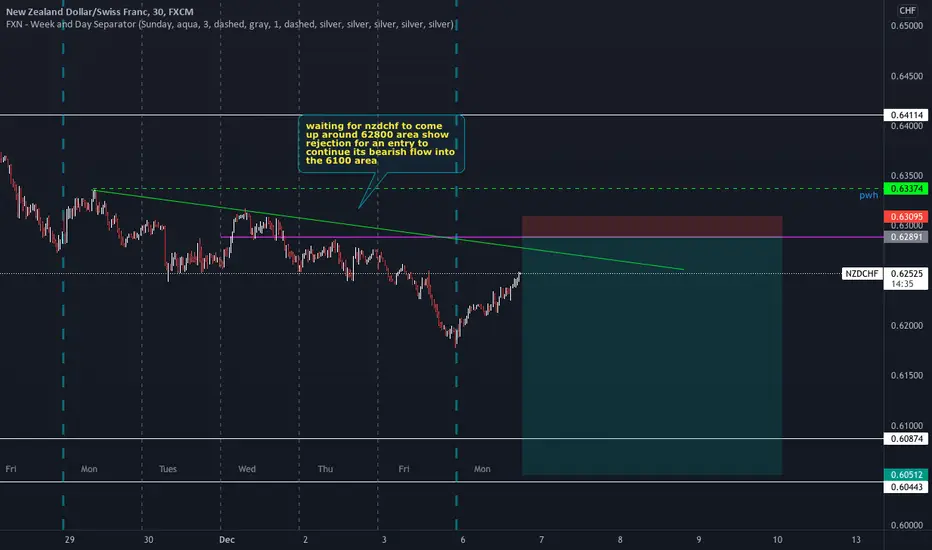
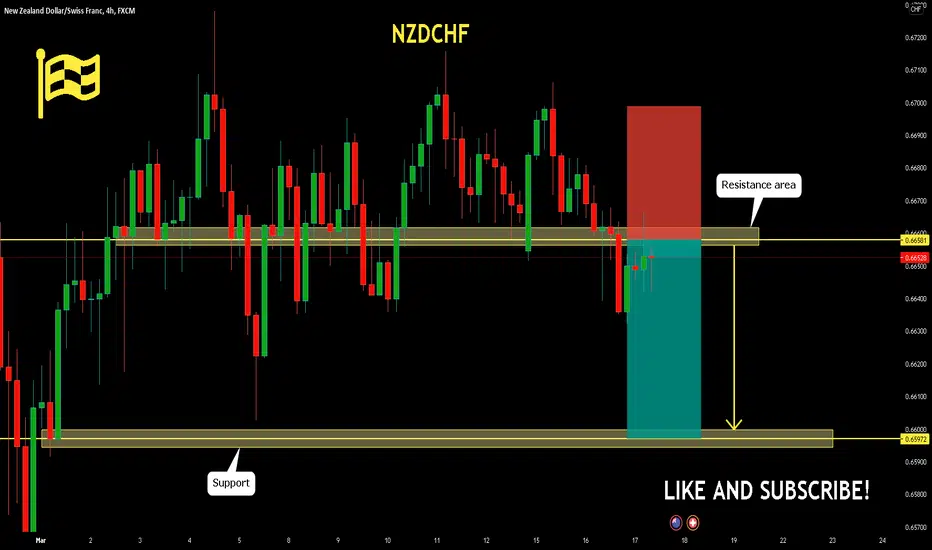
nzdchf setupwaiting for nzdchf to come up around 62800 area show rejection and continue its bearish flow into the 6100 area
NZDCHF: Price Action & Swing Analysis
Here is our technical view for NZDCHF.
Our analysis is based on purely technical outlook.
According to our drawing NZDCHF is trading within a supply zone.
Based on our view the price will dump.
Please, support our analysis with like and comment!
❤️ Please, support our work with like & comment! ❤️
NZDCHF Will Move Lower! Short!
Hello,Friends!
Based on the technical analysis
And the recent minor fundamental news
NZDCHF looks bearish to me overall.
I think that market-makers will be pushing the pair down
That is why we are going short!
Like and subscribe and comment my ideas if you enjoy them!
NZDCHF: Bearish Forecast & Outlook
Here is our today's forecast on NZDCHF.
Our analysis is based on purely technical outlook.
According to our chart NZDCHF is coiling on resistance.
Based on our stand point the price will dump.
Like, comment and subscribe to our TradingView Page.
❤️ Please, support our work with like & comment! ❤️
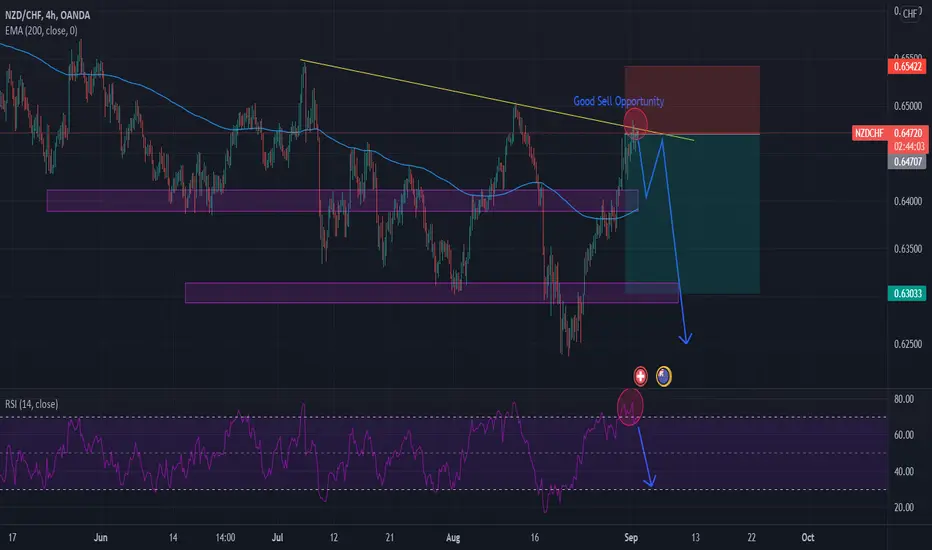
NZD/CHF Sell Opportunity RSI shows overbought on 4 hour timeframe. Possible 100+ pip move. Covid19 not looking as good in New Zealand.
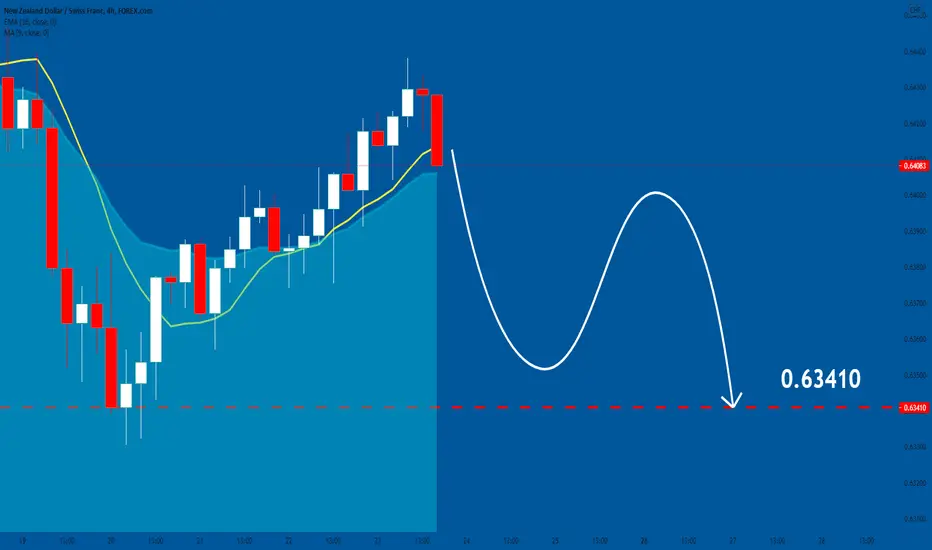
NZDCHF: Will Start Falling
Hey traders,
Here is our analysis on NZDCHF.
The level where the price is trading right now is decent
and the price will most likely retrace from that.
Please, support our analysis with like and comment!
❤️ Please, support our work with like & comment! ❤️
NZD/CHF LIKELY TO FALL !! #SHORTNZD/CHF Likely to fall
Note: Do your own research before any trading action.
Short zone: 0.63855 - 0.63755
SL : 0.64256 - 0.64356
1st Target: 0.62561 - 0.62461

Short on NZDCHFShort on NZDCHF, with a downtrend very respected, a RSI divergence and a overbought NZDCHF.

NZDCHF: Bearish Forecast & Outlook
Hey traders,
Here is our technical analysis on NZDCHF.
The level where the price is trading right now is peculiar
and the price will most likely retrace from that.
Please, leave a comment and support us with like.
❤️ Please, support our work with like & comment! ❤️
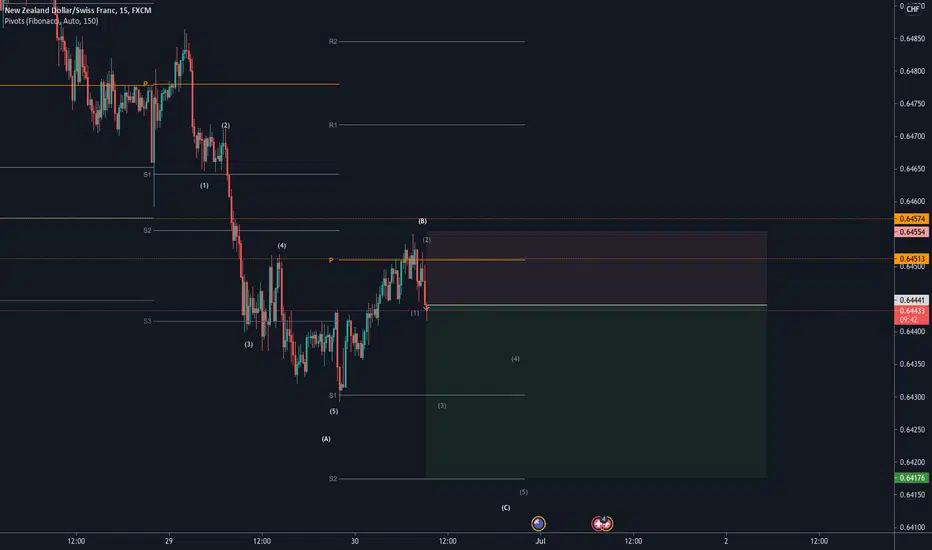
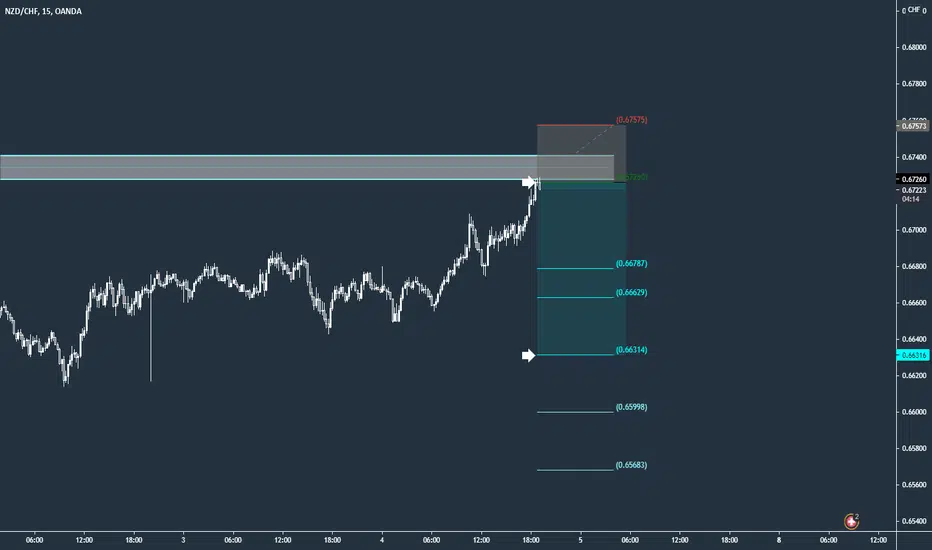
NZDCHF - Elliott Wave5 clear waves yesterday and 61% retracement on today's 15min timeframe for confirmation Trying to get in earlier on the break to put my stop at S2. As I'm getting stopped out carrying good trades into the next day.
NZDCHF: Market Sentiment & Forecast
Hey traders,
Here is our analysis on NZDCHF.
The level where the price is trading right now is major
and the price will most likely bounce from that.
Please, leave a comment and support us with like.
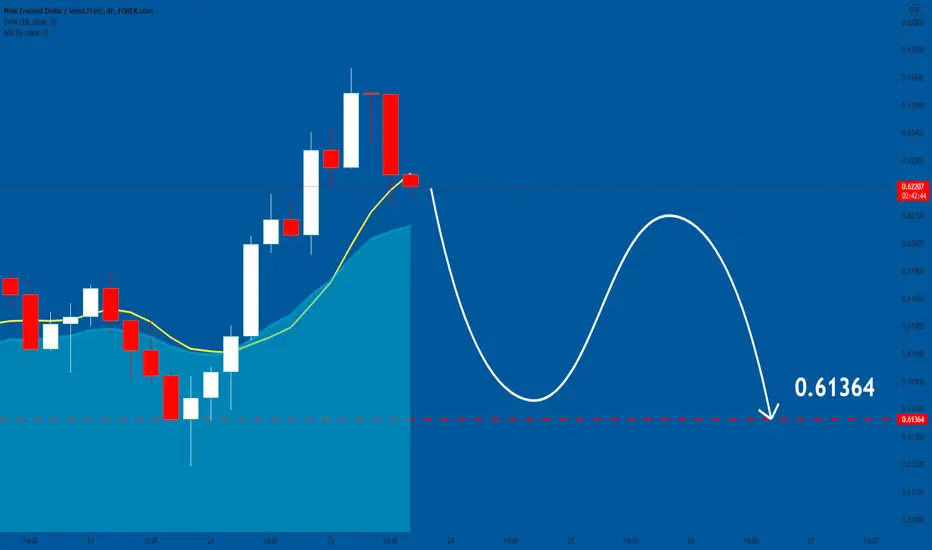
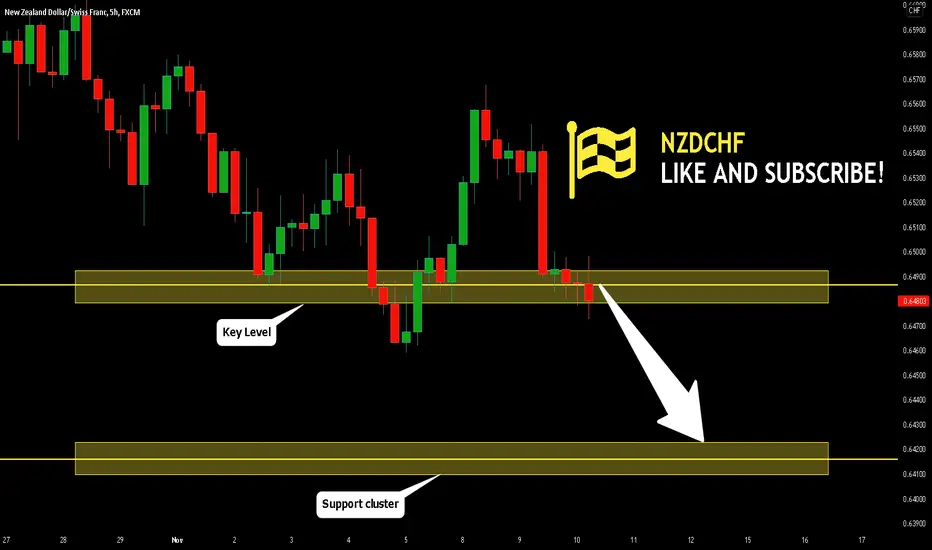
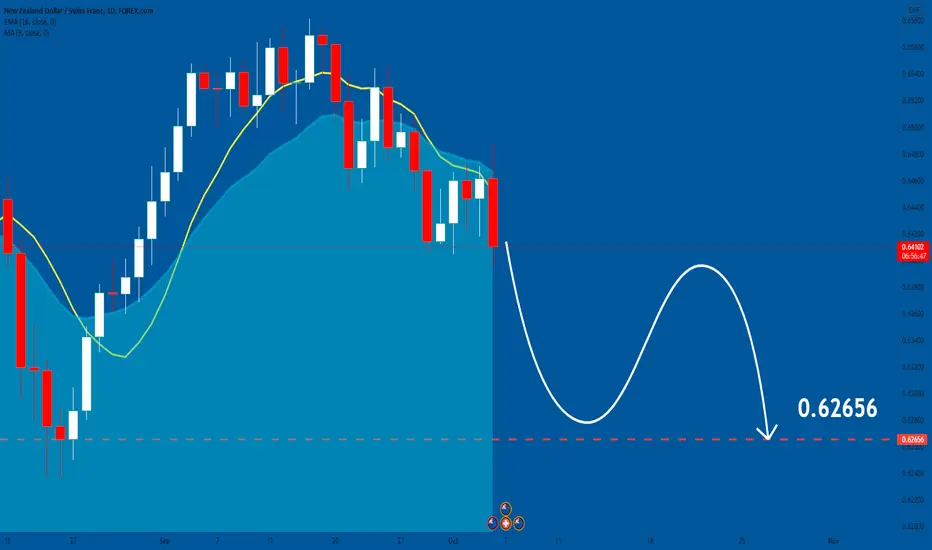
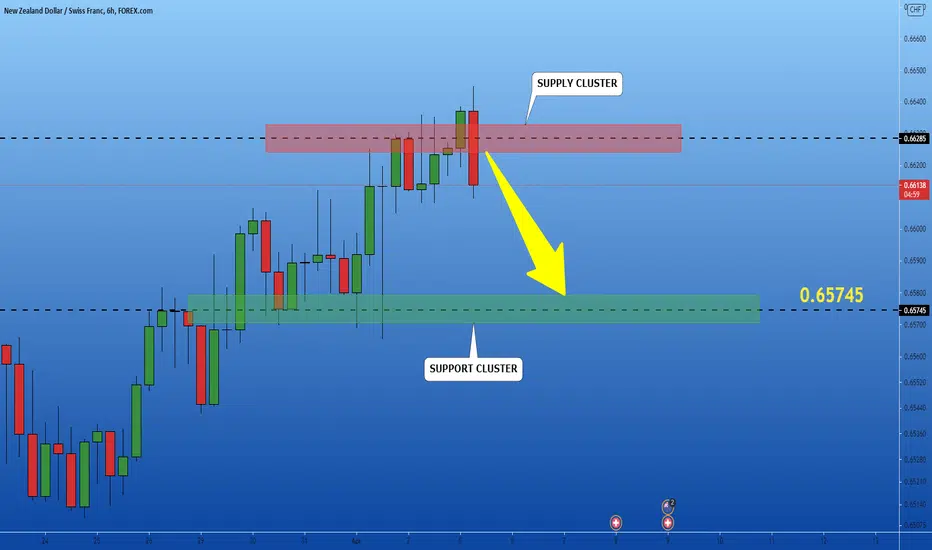
NZDCHF: Will Keep Falling! Target for Buyers is:
Here is our today's forecast for NZDCHF.
Our analysis is based on current fundamental situation.
According to our drawing NZDCHF is coiling on supply cluster.
Based on our analysis the market will start falling
to the next structure support.
Like, comment and subscribe to our TradingView Page.

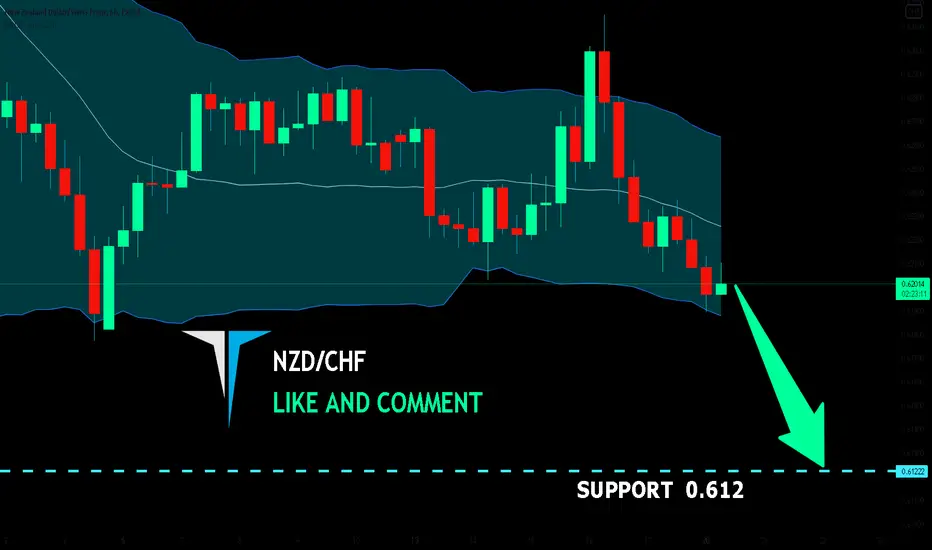
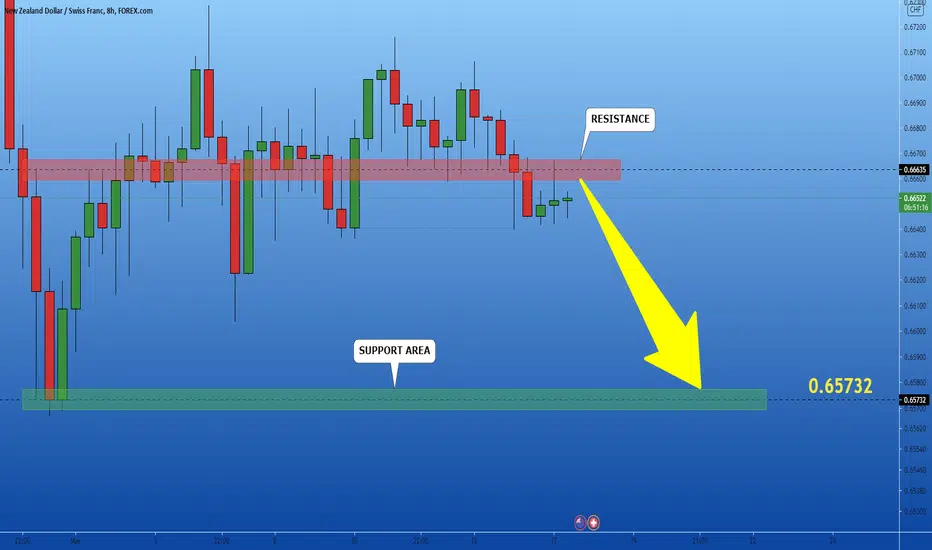
NZDCHF: Expecting Bearish Continuation
Here is our today's forecast on NZDCHF.
Our analysis is based on current market fundamental sentiment.
According to our chart NZDCHF reached a strong resistance.
Based on our stand point the price will drop.
Like, comment and subscribe to our TradingView Page.
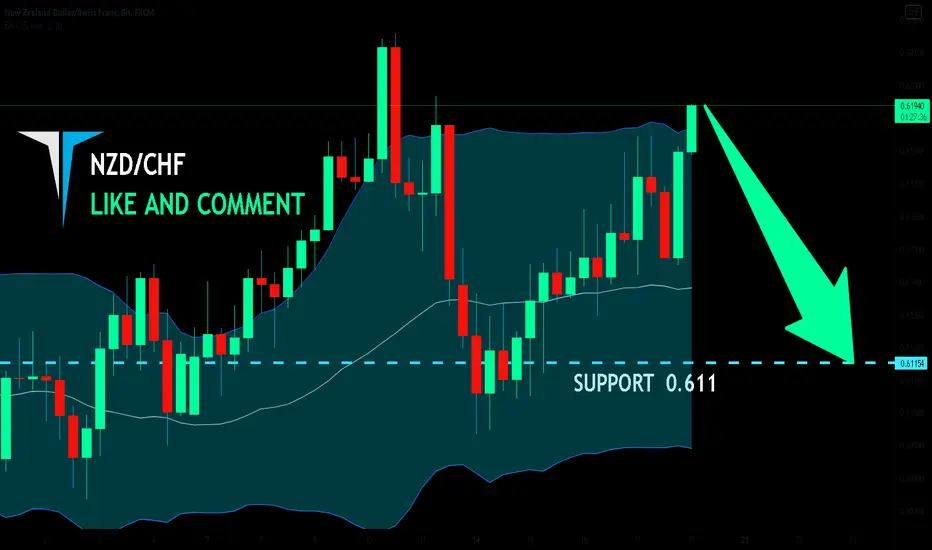
NZDCHF is bearish! SELL
Hello,Friends!
NZDCHF is bearish right now and I think the market conditions are right
for the move down
Therefore, i think it is sensible to go short
Like and subscribe and comment my ideas if you like them!
NZDCHF_ShortNZDCHF has been retracing back to the previous high. We are expecting the pair to drop significantly from this level that could potentially make a decent return on investment.
Currently we have a high probability reversal candle forming on M15 that is supported by the technicals.
Risk vs Reward: 3:1
Good luck!
*Updates to follow!
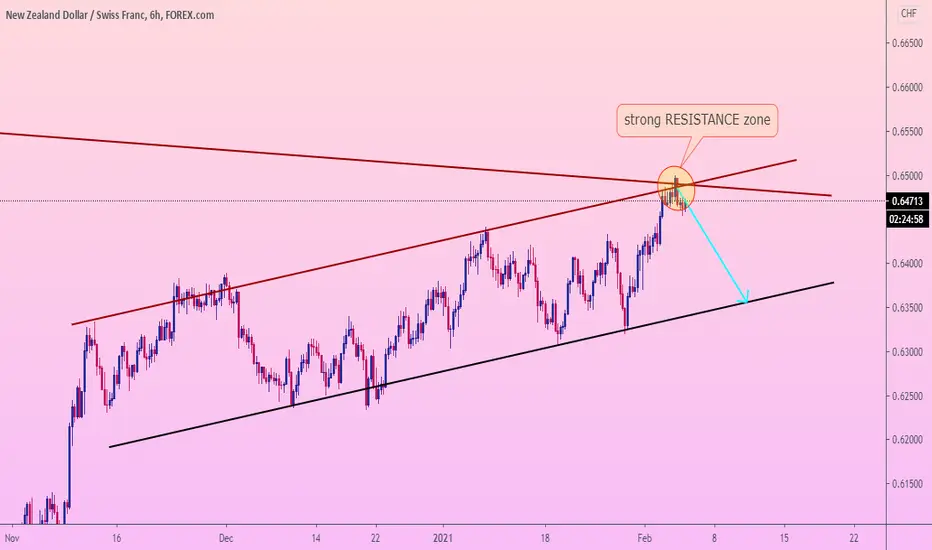
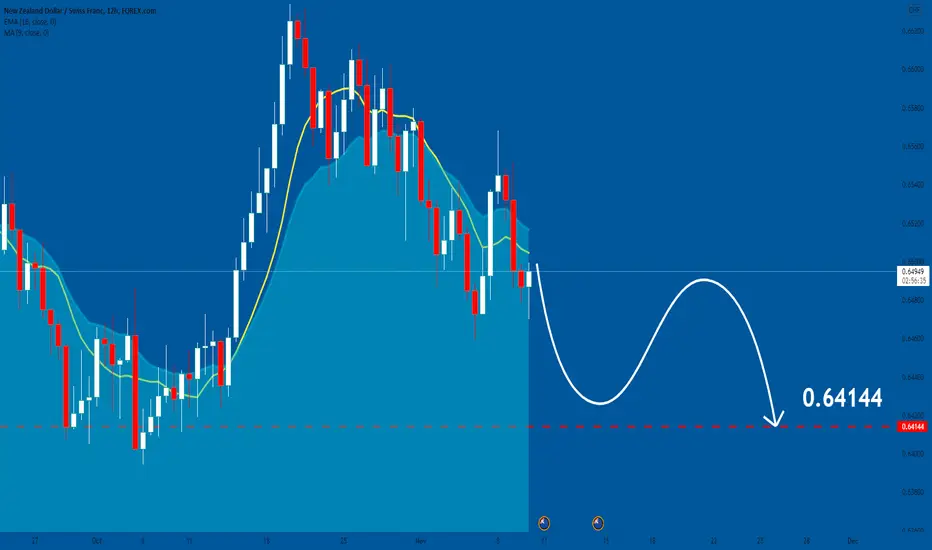
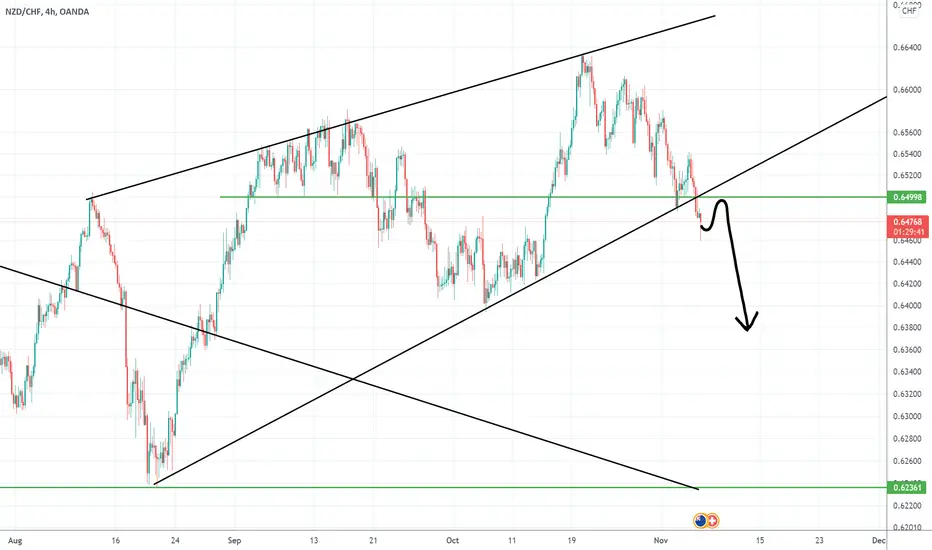
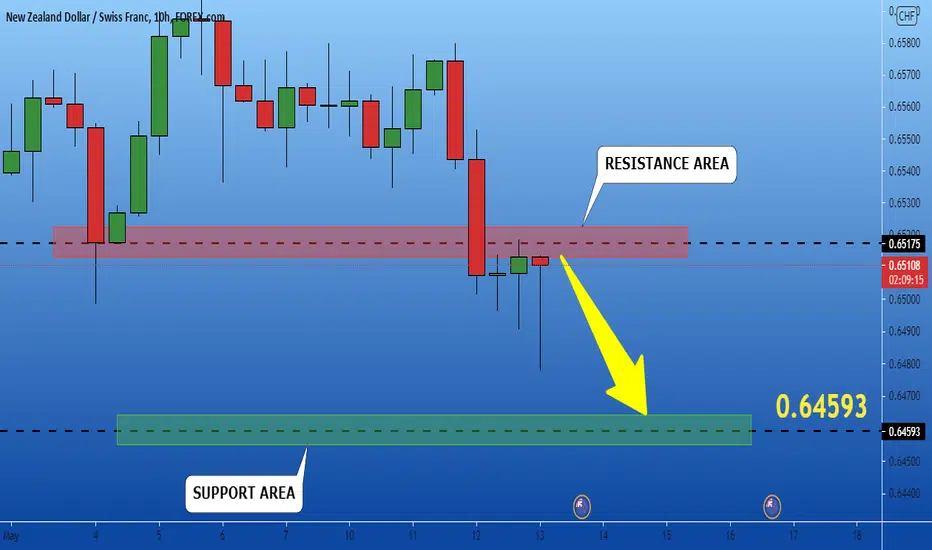
NZDCHF came to strong RESISTANCE zone. Next - FALLAfter last November the price touched the 0.633 resistance line and bounced from it to the 0.623 support line, the price began to move in an upward channel. The channel continues between these two lines.
However, during the growth, the price came to the strong resistance zone at the 0.648 point. This zone formed at the intersection of two lines. The first is the trend line. the second is a strong resistance line formed on the chart in July 2017 and combining the price highs.
The last time the price touched this line was in 2019, after which it collapsed and moved under it for almost two years. Therefore, now that the price has come to the line again, I expect that it will not be able to break it. On the chart, we can already see how the price bounced off the zone and showed a slight downward movement.
I expect it to fall further and come to the 0.635 support line.
Traders, if you liked this idea or if you have your own opinion about it, write in the comments. I will be glad 👩💻