NZD/JPY: Bearish Breakdown from Ascending ChannelNZD/JPY has decisively broken below its ascending channel, signaling a shift from bullish structure to bearish momentum. This move aligns with fundamental headwinds for NZD and the potential for JPY strength amid intervention risks and global risk-off sentiment.
Technical Analysis (4H Chart)
Pattern: Breakout from ascending channel support confirms a bearish reversal.
Current Level: 87.12, trading below the broken trendline with strong selling pressure.
Key Support Levels:
86.00 – first bearish target and immediate support zone.
84.60 – extended bearish target if momentum continues.
Resistance Levels:
88.04 – previous support turned resistance.
89.06 – upper boundary and invalidation zone for bearish bias.
Projection: Price is expected to retest 86.00, and if broken, further decline toward 84.60 is likely.
Fundamental Analysis
Bias: Bearish.
Key Fundamentals:
NZD: Pressured by global tariffs and risk-off sentiment.
JPY: Supported by potential FX intervention from Japan’s Ministry of Finance and safe-haven demand.
US Data Impact: Weak NFP boosted Fed cut bets, but risk-off flows strengthen JPY against risk currencies like NZD.
Risks:
China stimulus or a risk-on shift could lift NZD.
Lack of BOJ action may weaken JPY temporarily.
Key Events:
RBNZ policy outlook.
BOJ comments or intervention signals.
US CPI influencing global risk sentiment.
Leader/Lagger Dynamics
NZD/JPY is a lagger, reacting to risk sentiment and JPY moves, with JPY strength leading the pair lower.
Summary: Bias and Watchpoints
NZD/JPY is bearish, with a clear technical break from its ascending channel. The pair targets 86.00 initially and 84.60 on extended downside. Key watchpoints include BOJ FX policy, RBNZ stance, and global risk sentiment, especially if markets move deeper into risk-off mode.
NZDJPY

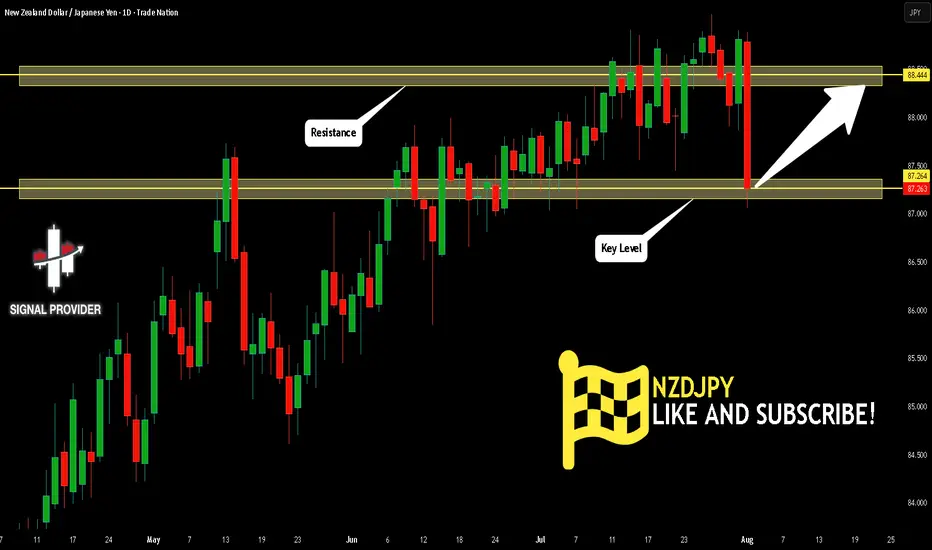
NZDJPY Will Go Up! Buy!
Here is our detailed technical review for NZDJPY.
Time Frame: 1D
Current Trend: Bullish
Sentiment: Oversold (based on 7-period RSI)
Forecast: Bullish
The market is testing a major horizontal structure 87.264.
Taking into consideration the structure & trend analysis, I believe that the market will reach 88.444 level soon.
P.S
Overbought describes a period of time where there has been a significant and consistent upward move in price over a period of time without much pullback.
Disclosure: I am part of Trade Nation's Influencer program and receive a monthly fee for using their TradingView charts in my analysis.
Like and subscribe and comment my ideas if you enjoy them!
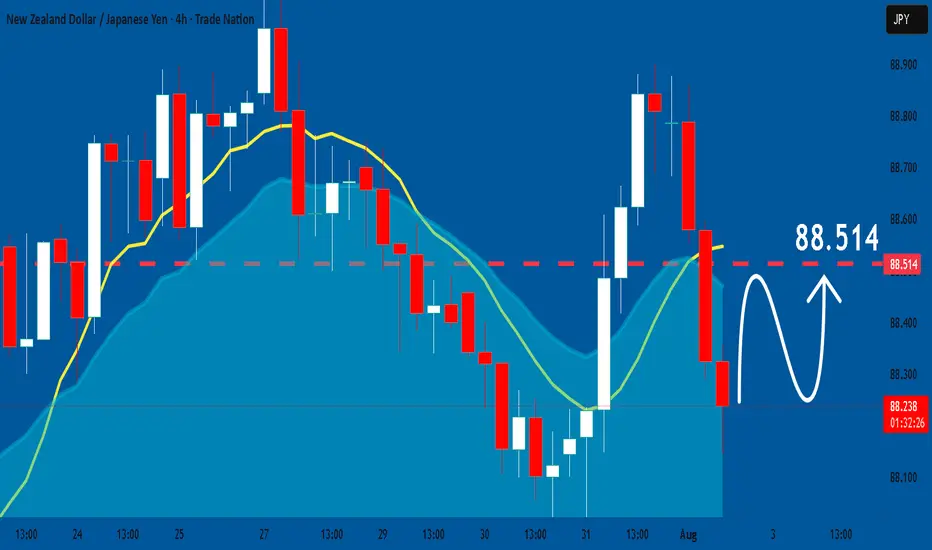
NZDJPY: Bullish Continuation
The recent price action on the NZDJPY pair was keeping me on the fence, however, my bias is slowly but surely changing into the bullish one and I think we will see the price go up.
Disclosure: I am part of Trade Nation's Influencer program and receive a monthly fee for using their TradingView charts in my analysis.
❤️ Please, support our work with like & comment! ❤️
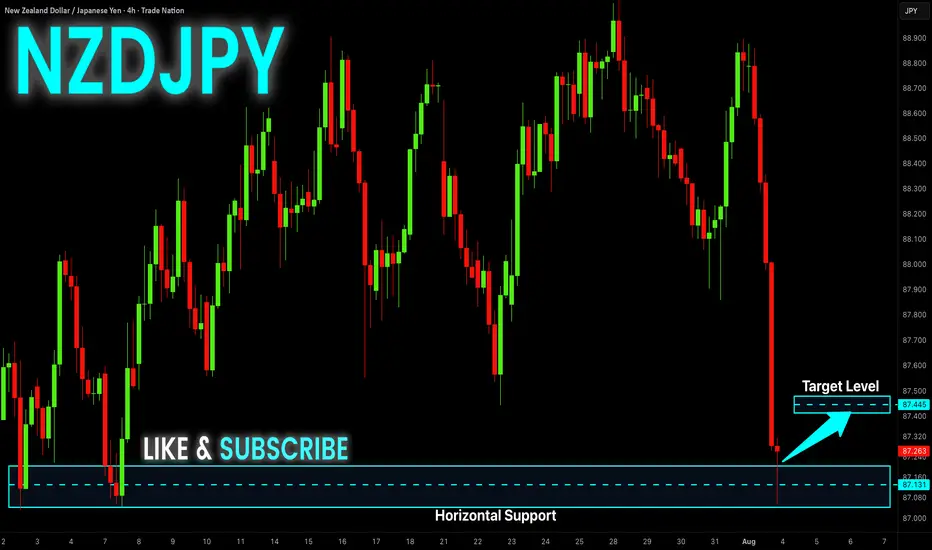
NZD-JPY Local Long! Buy!
Hello,Traders!
NZD-JPY is retsting a
Strong horizontal support
Level around 87.044 and
As the pair is locally
Oversold we will be expecting
A local rebound and a move
Up on Monday!
Buy!
Comment and subscribe to help us grow!
Check out other forecasts below too!
Disclosure: I am part of Trade Nation's Influencer program and receive a monthly fee for using their TradingView charts in my analysis.
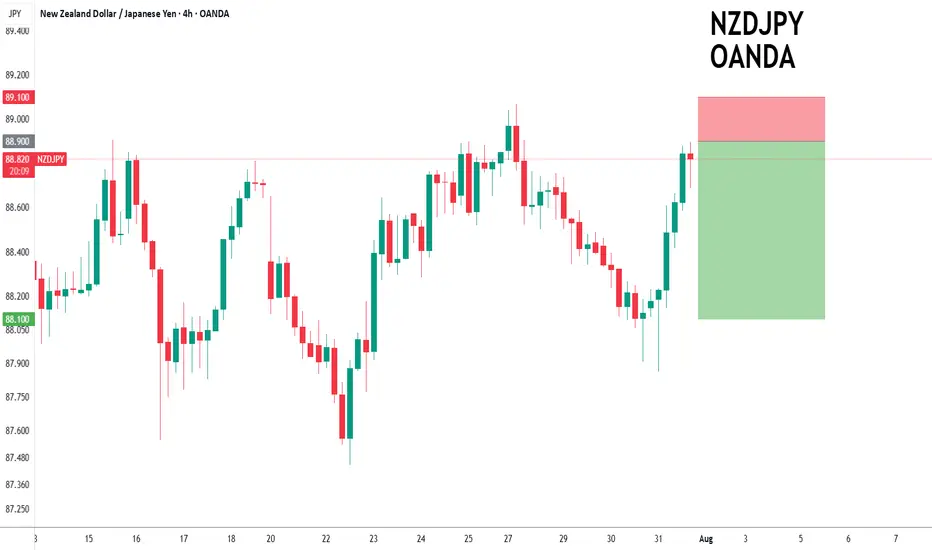
NZDJPY to find sellers at market price?NZDJPY - 24h expiry
Trading has been mixed and volatile.
Price action looks to be forming a top.
We look for a temporary move higher.
Preferred trade is to sell into rallies.
Bespoke resistance is located at 88.90.
We look to Sell at 88.90 (stop at 89.10)
Our profit targets will be 88.10 and 87.90
Resistance: 89.00 / 89.20 / 89.50
Support: 88.40 / 88.10 / 87.90
Risk Disclaimer
The trade ideas beyond this page are for informational purposes only and do not constitute investment advice or a solicitation to trade. This information is provided by Signal Centre, a third-party unaffiliated with OANDA, and is intended for general circulation only. OANDA does not guarantee the accuracy of this information and assumes no responsibilities for the information provided by the third party. The information does not take into account the specific investment objectives, financial situation, or particular needs of any particular person. You should take into account your specific investment objectives, financial situation, and particular needs before making a commitment to trade, including seeking, under a separate engagement, as you deem fit.
You accept that you assume all risks in independently viewing the contents and selecting a chosen strategy.
Where the research is distributed in Singapore to a person who is not an Accredited Investor, Expert Investor or an Institutional Investor, Oanda Asia Pacific Pte Ltd (“OAP“) accepts legal responsibility for the contents of the report to such persons only to the extent required by law. Singapore customers should contact OAP at 6579 8289 for matters arising from, or in connection with, the information/research distributed.
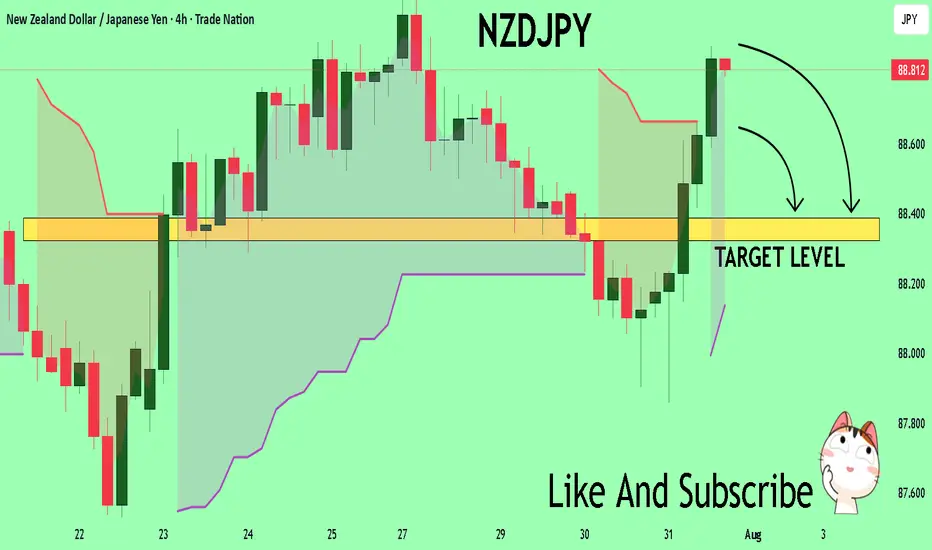
NZDJPY The Target Is DOWN! SELL!
My dear friends,
Please, find my technical outlook for NZDJPY below:
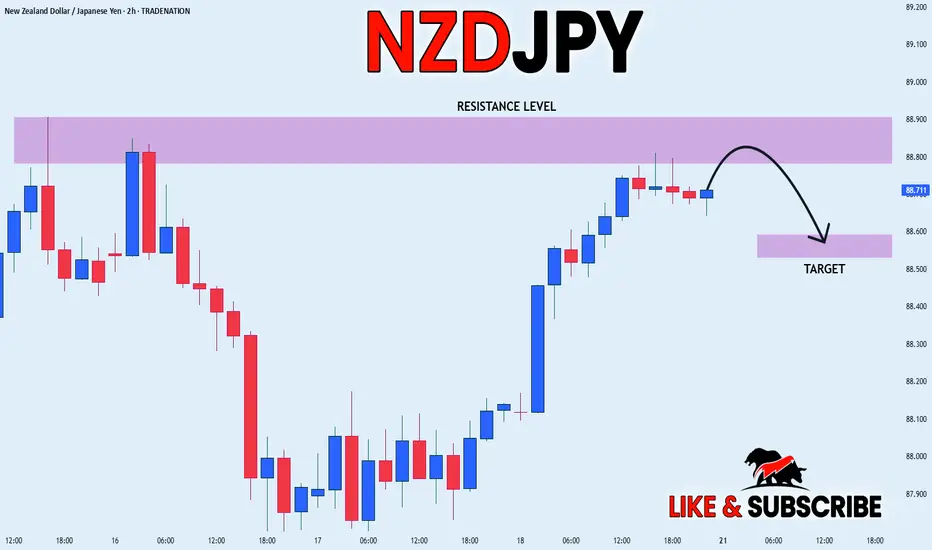
The price is coiling around a solid key level - 88.806
Bias - Bearish
Technical Indicators: Pivot Points Low anticipates a potential price reversal.
Super trend shows a clear sell, giving a perfect indicators' convergence.
Goal - 88.388
About Used Indicators:
The pivot point itself is simply the average of the high, low and closing prices from the previous trading day.
Disclosure: I am part of Trade Nation's Influencer program and receive a monthly fee for using their TradingView charts in my analysis.
———————————
WISH YOU ALL LUCK
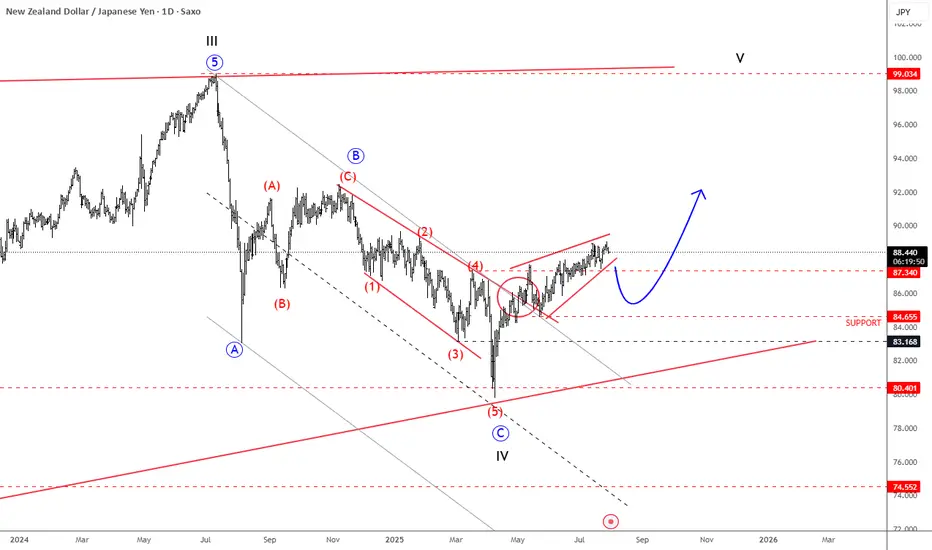
NZDJPY Is Back To Bullish ModeNZDJPY Is Back To Bullish Mode from technical and Elliott wave perspective, as we see it breaking back above trendline after a corrective decline.
NZDJPY is nicely recovering over the last few weeks after a strong rebound from 80.40 support, a key level going back to March 2023. Notice that it’s recovering after a three-wave ABC corrective decline that belongs to a higher degree wave IV correction. Current recovery looks to be in five waves, as a leading diagonal; so its a motive wave structure that already pushed above the 87.34 resistance, which is a strong bullish signal, suggesting more upside ahead. Of course, short-term pullbacks are always possible and welcome, and in that case, the 86 – 84 area could act as a nice support. But overall, we think that sooner or later the pair will target the 90 or even 92 levels, which are still possible this year. Wave V is eyeing even 100 area.
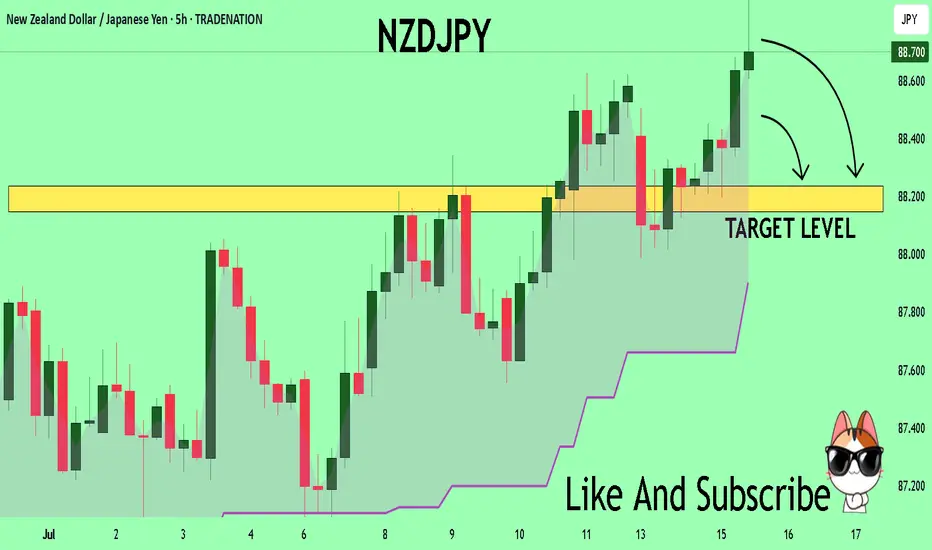
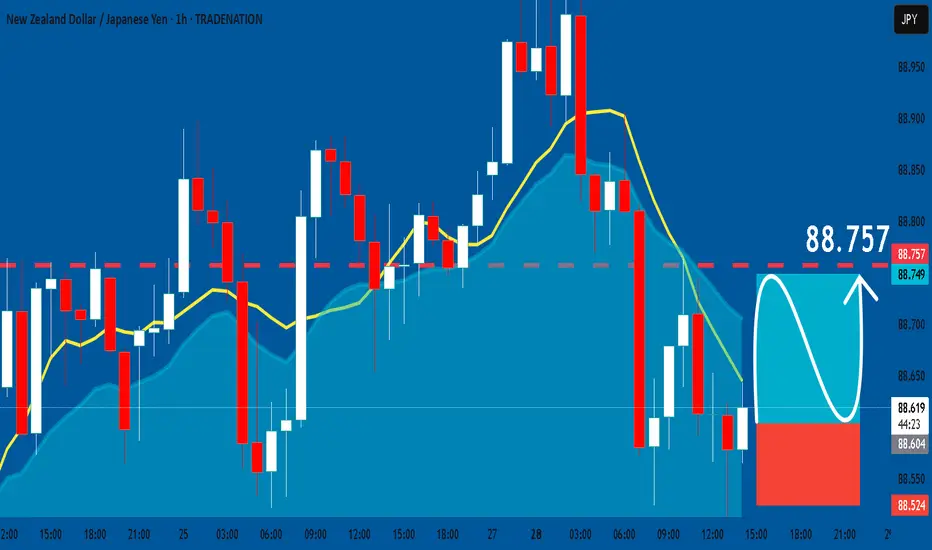
NZDJPY: Free Trading Signal
NZDJPY
- Classic bullish pattern
- Our team expects retracement
SUGGESTED TRADE:
Swing Trade
Buy NZDJPY
Entry - 88.612
Stop - 88.524
Take - 88.757
Our Risk - 1%
Start protection of your profits from lower levels
Disclosure: I am part of Trade Nation's Influencer program and receive a monthly fee for using their TradingView charts in my analysis.
❤️ Please, support our work with like & comment! ❤️
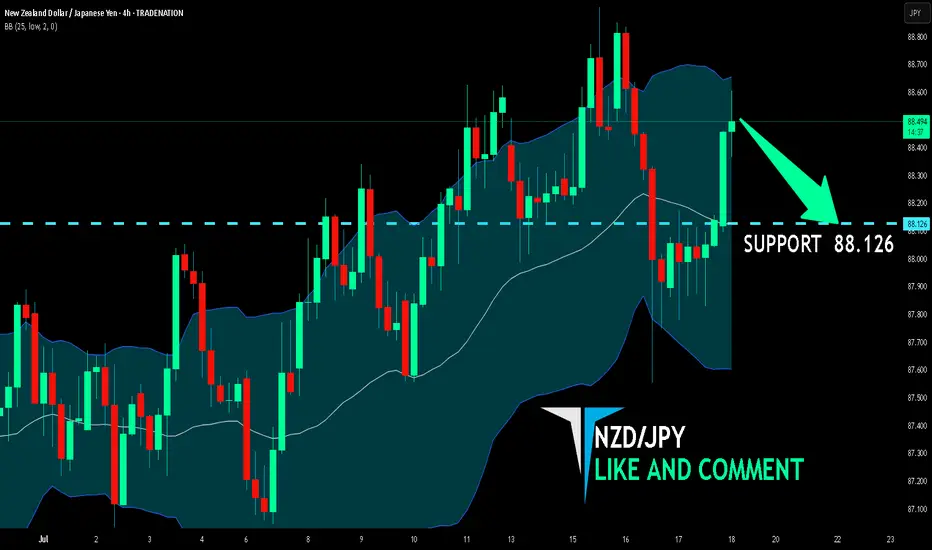
NZD/JPY BEARS ARE STRONG HERE|SHORT
Hello, Friends!
Previous week’s green candle means that for us the NZD/JPY pair is in the uptrend. And the current movement leg was also up but the resistance line will be hit soon and upper BB band proximity will signal an overbought condition so we will go for a counter-trend short trade with the target being at 88.302.
Disclosure: I am part of Trade Nation's Influencer program and receive a monthly fee for using their TradingView charts in my analysis.
✅LIKE AND COMMENT MY IDEAS✅

NZD_JPY SHORT FROM RESISTANCE|
✅NZD_JPY is going up now
But a strong resistance level is ahead at 88.900
Thus I am expecting a pullback
And a move down towards the target of 88.572
SHORT🔥
✅Like and subscribe to never miss a new idea!✅
Disclosure: I am part of Trade Nation's Influencer program and receive a monthly fee for using their TradingView charts in my analysis.
NZD-JPY Resistance Ahead! Sell!
Hello,Traders!
NZD-JPY is trading in an
Uptrend but the pair is locally
Overbought so after the pair
Hits the horizontal resistance
Level of 88.900 we will be
Expecting a local bearish
Move down
Sell!
Comment and subscribe to help us grow!
Check out other forecasts below too!
Disclosure: I am part of Trade Nation's Influencer program and receive a monthly fee for using their TradingView charts in my analysis.
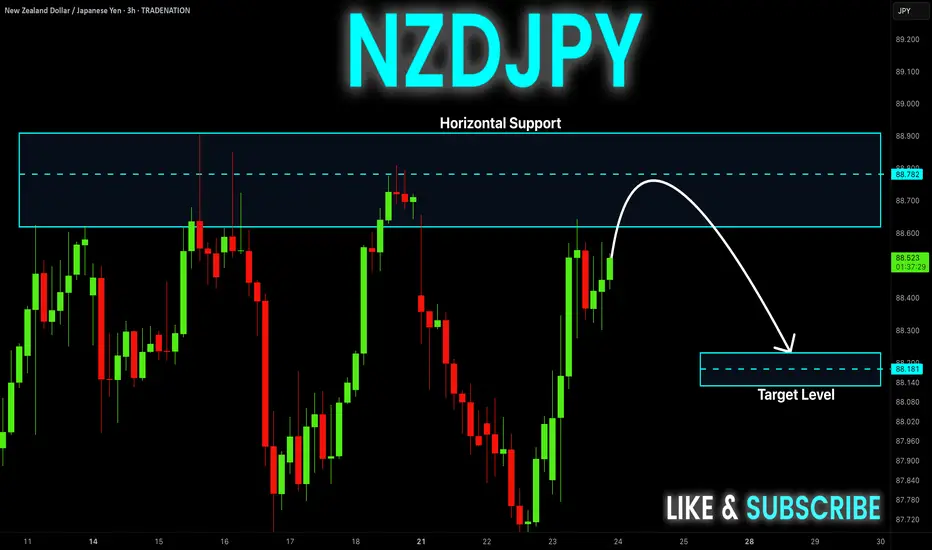
NZDJPY Set To Fall! SELL!
My dear subscribers,
My technical analysis for NZDJPY is below:
The price is coiling around a solid key level - 88.786
Bias - Bearish
Technical Indicators: Pivot Points Low anticipates a potential price reversal.
Super trend shows a clear sell, giving a perfect indicators' convergence.
Goal - 88.284
My Stop Loss - 89.075
About Used Indicators:
By the very nature of the supertrend indicator, it offers firm support and resistance levels for traders to enter and exit trades. Additionally, it also provides signals for setting stop losses
Disclosure: I am part of Trade Nation's Influencer program and receive a monthly fee for using their TradingView charts in my analysis.
———————————
WISH YOU ALL LUCK
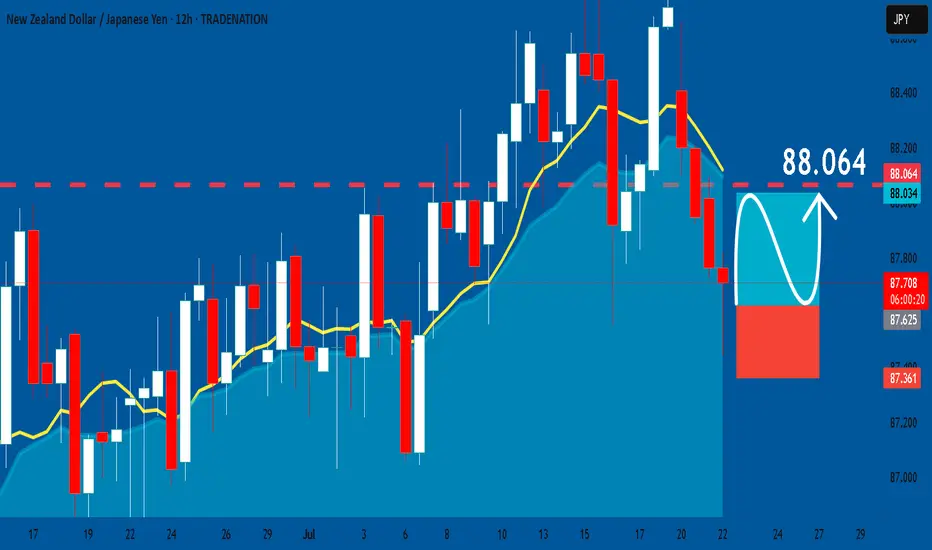
NZDJPY: Long Trade Explained
NZDJPY
- Classic bullish setup
- Our team expects bullish continuation
SUGGESTED TRADE:
Swing Trade
Long NZDJPY
Entry Point - 87.616
Stop Loss - 87.361
Take Profit - 88.064
Our Risk - 1%
Start protection of your profits from lower levels
Disclosure: I am part of Trade Nation's Influencer program and receive a monthly fee for using their TradingView charts in my analysis.
❤️ Please, support our work with like & comment! ❤️
NZD_JPY RISING SUPPORT AHEAD|LONG|
✅NZD_JPY went down from
The resistance just as I predicted
In my previous analysis but now
The pair is approaching a rising
Support line from where we will
Be expecting a local bullish rebound
LONG🚀
✅Like and subscribe to never miss a new idea!✅
Disclosure: I am part of Trade Nation's Influencer program and receive a monthly fee for using their TradingView charts in my analysis.
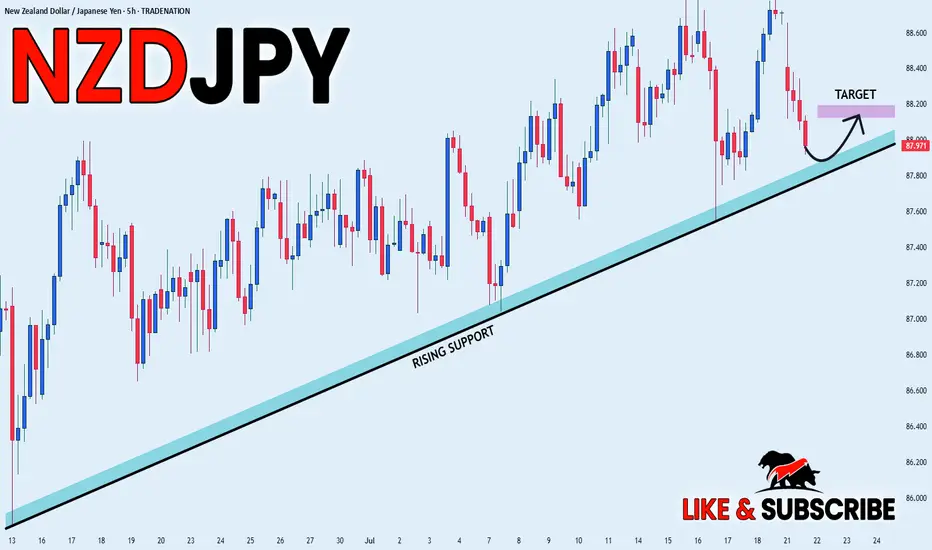
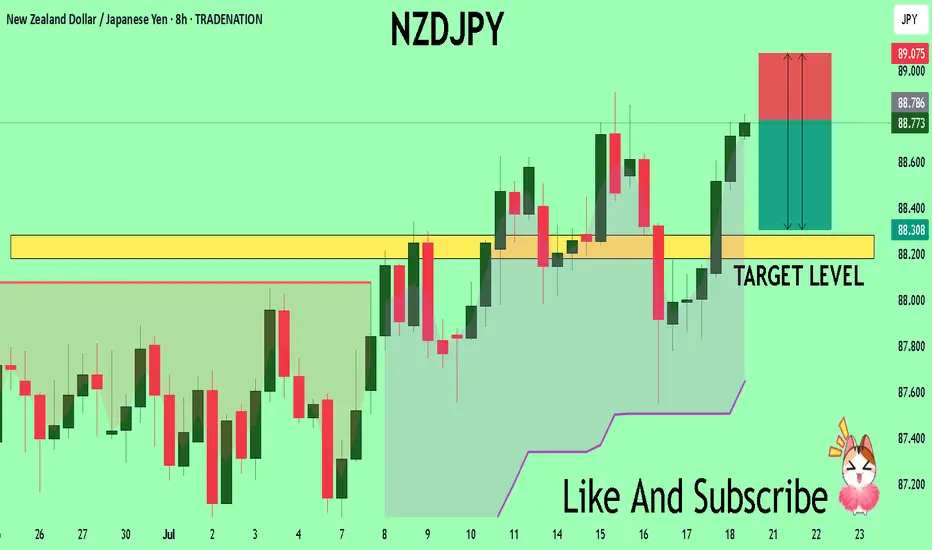
NZDJPY Set To Grow! BUY!
My dear friends,
My technical analysis for NZDJPY is below:
The market is trading on 88.079 pivot level.
Bias - Bullish
Technical Indicators: Both Super Trend & Pivot HL indicate a highly probable Bullish continuation.
Target - 88.472
Recommended Stop Loss - 87.861
About Used Indicators:
A pivot point is a technical analysis indicator, or calculations, used to determine the overall trend of the market over different time frames.
Disclosure: I am part of Trade Nation's Influencer program and receive a monthly fee for using their TradingView charts in my analysis.
———————————
WISH YOU ALL LUCK
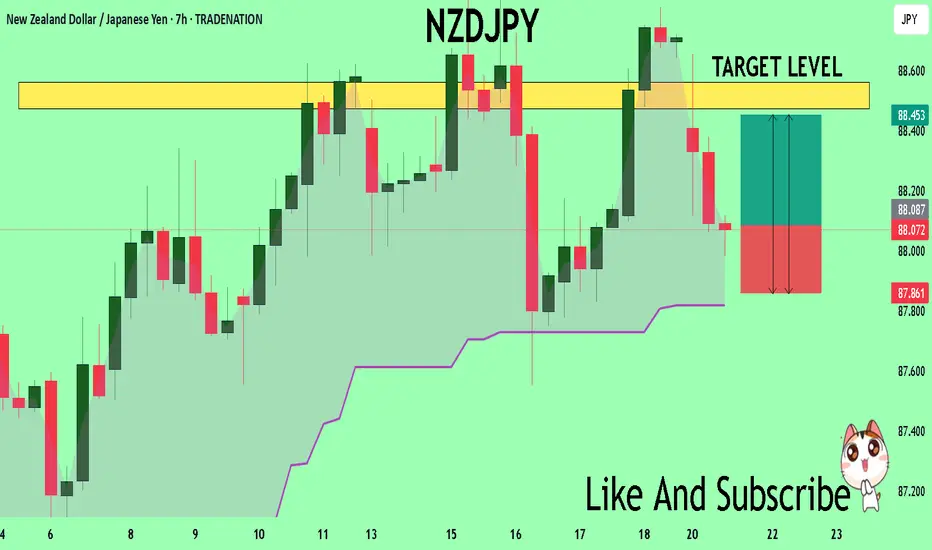
NZD/JPY BEARS ARE STRONG HERE|SHORT
Hello, Friends!
NZD/JPY pair is trading in a local uptrend which we know by looking at the previous 1W candle which is green. On the 4H timeframe the pair is going up too. The pair is overbought because the price is close to the upper band of the BB indicator. So we are looking to sell the pair with the upper BB line acting as resistance. The next target is 88.126 area.
Disclosure: I am part of Trade Nation's Influencer program and receive a monthly fee for using their TradingView charts in my analysis.
✅LIKE AND COMMENT MY IDEAS✅
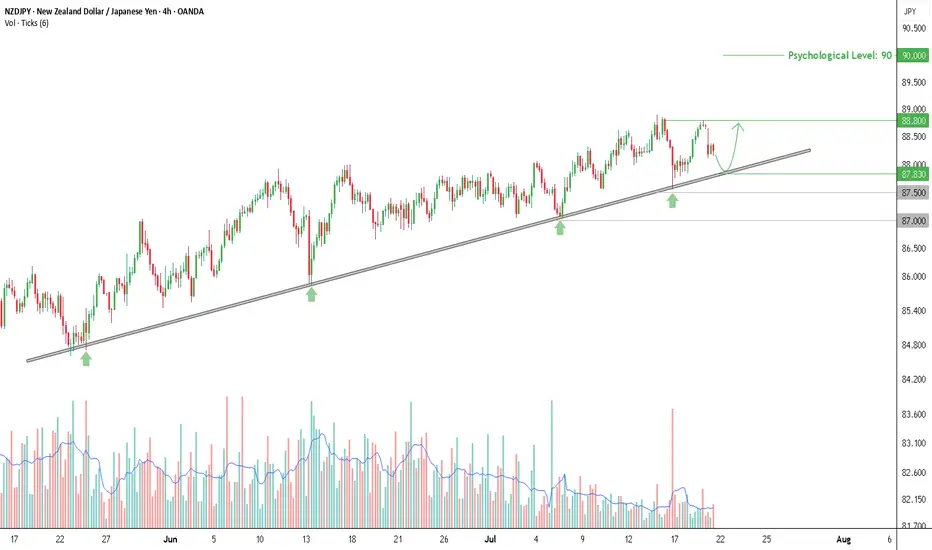
Buy Opportunity on NZDJPY, Testing Trendline with Rising VolumeThe NZDJPY chart on the 4-hour timeframe shows a consistent uptrend pattern, supported by a well-respected ascending trendline that has been tested multiple times since late May 2025. Rebounds from this trendline are marked by green arrows on the chart, indicating a strong reaction zone. Each time price touches the trendline, trading volume tends to increase—signaling active buying interest from market participants.
Currently, price is pulling back toward the trendline support area around 87.830, which could once again act as a bounce point, just like in previous sessions. As long as this trendline holds, the rebound scenario remains dominant and offers a potential opportunity for a long (buy) setup.
Entry & Take Profit
If price bounces from the trendline area, a buy entry can be considered around 87.83, with an initial take profit target at 88.80—the nearest local resistance level and previous consolidation zone.
Should the bullish momentum continue and break above 88.80, the next upside target could reach the psychological level of 90.00.
Stop Loss
As a risk boundary, a closing price below 87.50 can be used as a stop loss (SL) level, as it would indicate a potential breakdown of the higher low structure that has been forming.
If the trendline fails and price drops further, a deeper decline may extend toward the 87.00 area, which is a previously established horizontal support.
Additional Confirmation
It’s recommended to wait for bullish price action signals around the trendline area before entering a position, such as a bullish engulfing pattern, pin bar, or rejection candle. Also, monitor for a spike in volume as price approaches support, as increased volume often indicates strong buying interest.
As long as the trendline holds, the upward bounce scenario remains valid and should be considered for short- to medium-term buy strategies. The 87.83–87.90 zone is a key area to watch for the next market reaction.
Disclaimer: This analysis is part of a trading plan and does not constitute investment advice. Always use strict risk management and consider potential losses in every trade decision.
NZD/JPY: A Data-Driven Short SignalBefore I post a trade, I put it through a rigorous, multi-step analysis. Here’s exactly what I did for this NZD/JPY setup to build a data-driven case.
I Started with the 'Why': The Fundamental Story 📰
First, I identified the powerful divergence between the dovish RBNZ and the hawkish BoJ. This gave me my core bearish thesis for the pair.
I Challenged My Idea with Data: The Stress Test 🧠
A good story isn't enough. So, I ran this bearish idea through my mathematical models . My goal was to find any hidden risks and see if the hard data supported my fundamental view.
What My Analysis Revealed: A Warning and a Confirmation ⚠️
The data came back with two critical insights:
Confirmation: The models strongly validated the bearish direction with a high degree of mathematical probability.
Warning: They exposed a hidden danger—a standard entry had a very high probability of getting stopped out in the current market.
I Engineered the Solution: The Optimized Plan 🛠️
This is the most important step. I used these data insights to build a new trade plan from the ground up. The entry, stop loss, and take profit below are not guesses; they are the output of my analysis, specifically designed to navigate the risk the data uncovered.
The result is a trade with a huge 5.15-to-1 Risk-to-Reward ratio , where my fundamental view is now backed by a data-driven execution strategy. Let's get into it. 👇
The Complete Trade Plan
Strategy & Trade Parameters ✅
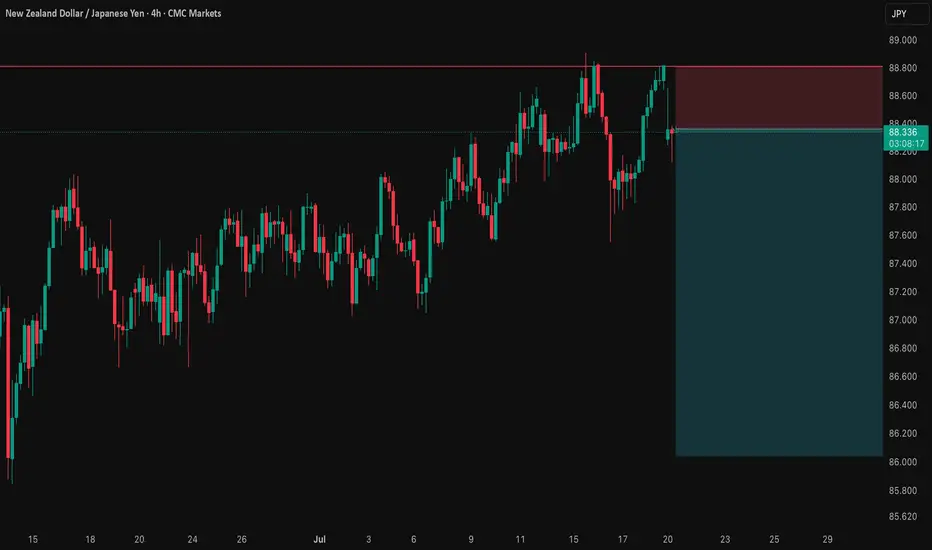
📉 Pair: NZD/JPY
👉 Direction: Short
⛔️ Entry: 88.35800
🎯 Take Profit: 86.04347
🛡️ Stop Loss: 88.80723
⚖️ Risk-Reward: 5.15
This setup represents my ideal trading approach: forming a strong fundamental thesis and then using disciplined, mathematical analysis to define the execution. The result is a plan where the direction is clear and the risk is precisely managed. Trade safe.
NZD_JPY PULLBACK EXPECTED|SHORT|
✅NZD_JPY has been growing recently
And the pair seems locally overbought
So as the pair has approached
A horizontal resistance of 88.900
Price fall is to be expected
SHORT🔥
✅Like and subscribe to never miss a new idea!✅
Disclosure: I am part of Trade Nation's Influencer program and receive a monthly fee for using their TradingView charts in my analysis.
NZD-JPY Local Short! Sell!
Hello,Traders!
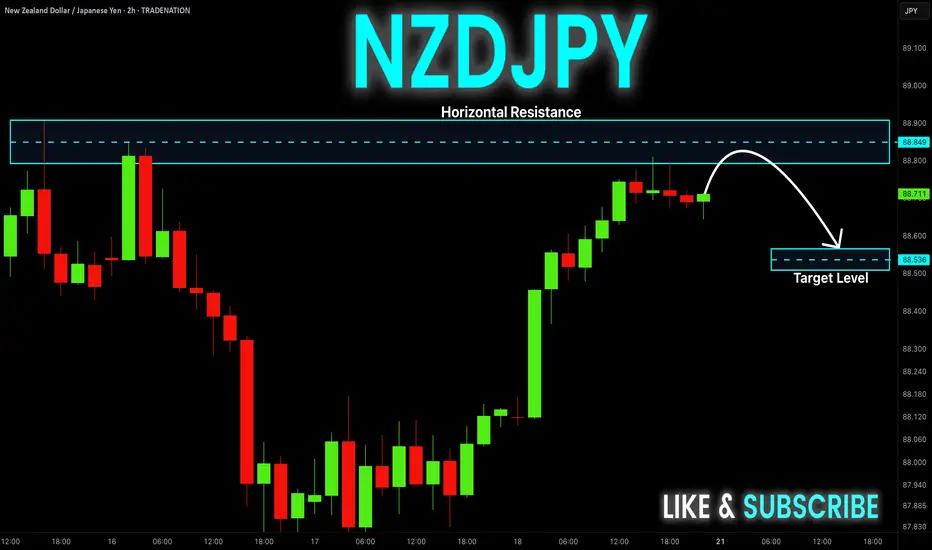
NZD-JPY has hit a horizontal
Resistance level of 88.851
And we are already seeing
A bearish reaction so we will
Be expecting a local
Bearish move down
On Monday!
Sell!
Comment and subscribe to help us grow!
Check out other forecasts below too!
Disclosure: I am part of Trade Nation's Influencer program and receive a monthly fee for using their TradingView charts in my analysis.
NZD-JPY Long From Rising Support! Buy!
Hello,Traders!
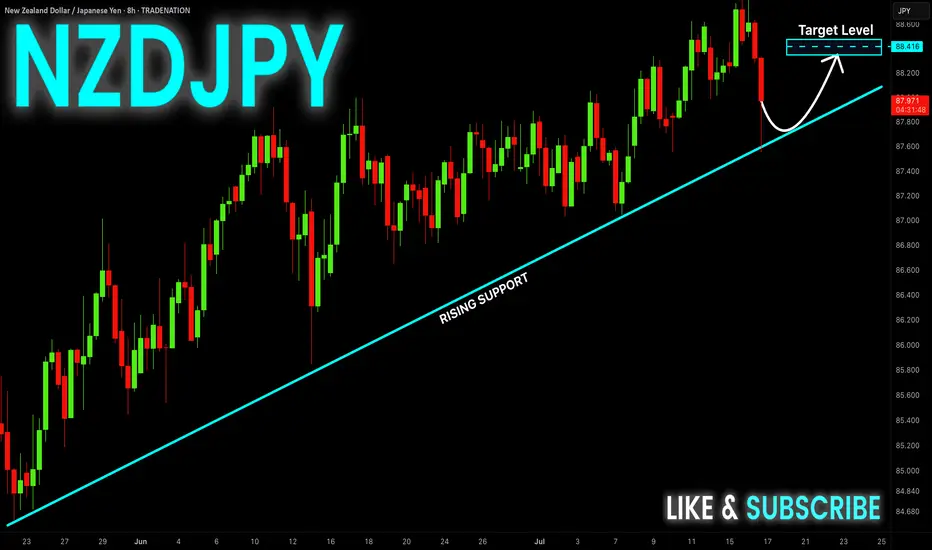
NZD-JPY keeps trading in
An uptrend along the rising
Support line and the pair made
A quick retest and we are seeing
A rejection so we are bullish
Biased and we will be expecting
A further bullish move up
Buy!
Comment and subscribe to help us grow!
Check out other forecasts below too!
Disclosure: I am part of Trade Nation's Influencer program and receive a monthly fee for using their TradingView charts in my analysis.
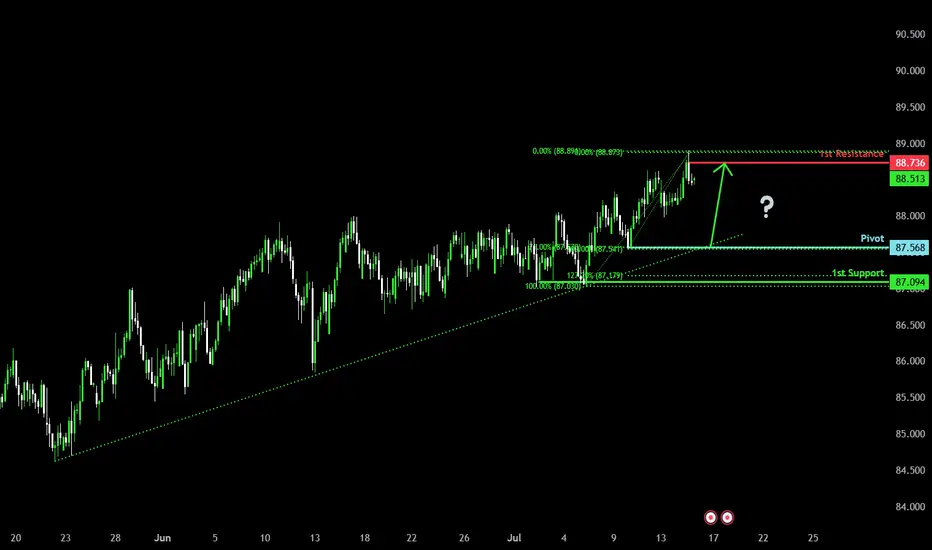
Bullish momentum to extend?NZD/JPY is falling towards the pivot and could bounce to the 1st resistance.
Pivot: 87.56
1st Support: 87.09
1st Resistance: 88.73
Risk Warning:
Trading Forex and CFDs carries a high level of risk to your capital and you should only trade with money you can afford to lose. Trading Forex and CFDs may not be suitable for all investors, so please ensure that you fully understand the risks involved and seek independent advice if necessary.
Disclaimer:
The above opinions given constitute general market commentary, and do not constitute the opinion or advice of IC Markets or any form of personal or investment advice.
Any opinions, news, research, analyses, prices, other information, or links to third-party sites contained on this website are provided on an "as-is" basis, are intended only to be informative, is not an advice nor a recommendation, nor research, or a record of our trading prices, or an offer of, or solicitation for a transaction in any financial instrument and thus should not be treated as such. The information provided does not involve any specific investment objectives, financial situation and needs of any specific person who may receive it. Please be aware, that past performance is not a reliable indicator of future performance and/or results. Past Performance or Forward-looking scenarios based upon the reasonable beliefs of the third-party provider are not a guarantee of future performance. Actual results may differ materially from those anticipated in forward-looking or past performance statements. IC Markets makes no representation or warranty and assumes no liability as to the accuracy or completeness of the information provided, nor any loss arising from any investment based on a recommendation, forecast or any information supplied by any third-party.
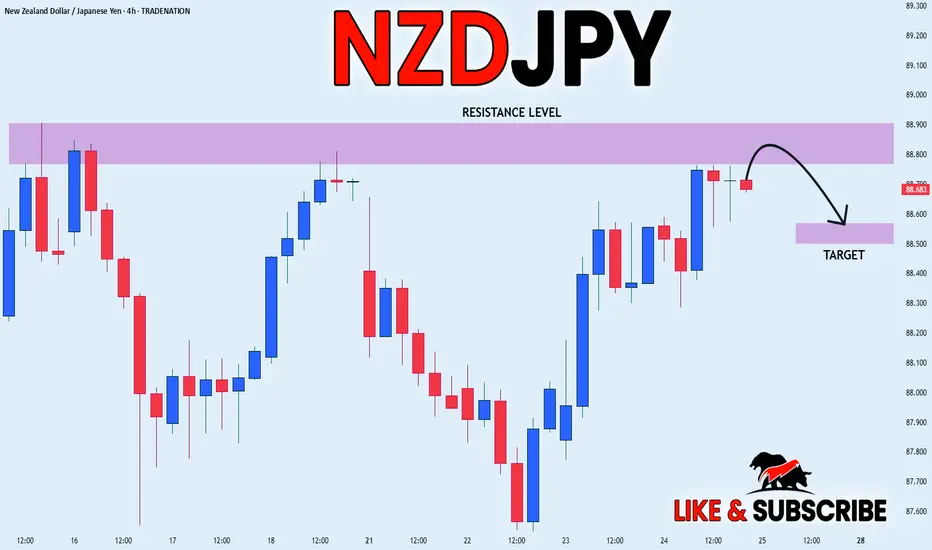
NZDJPY Technical Analysis! SELL!
My dear friends,
Please, find my technical outlook for NZDJPY below:
The instrument tests an important psychological level 88.688
Bias - Bearish
Technical Indicators: Supper Trend gives a precise Bearish signal, while Pivot Point HL predicts price changes and potential reversals in the market.
Target - 88.235
About Used Indicators:
Super-trend indicator is more useful in trending markets where there are clear uptrends and downtrends in price.
Disclosure: I am part of Trade Nation's Influencer program and receive a monthly fee for using their TradingView charts in my analysis.
———————————
WISH YOU ALL LUCK