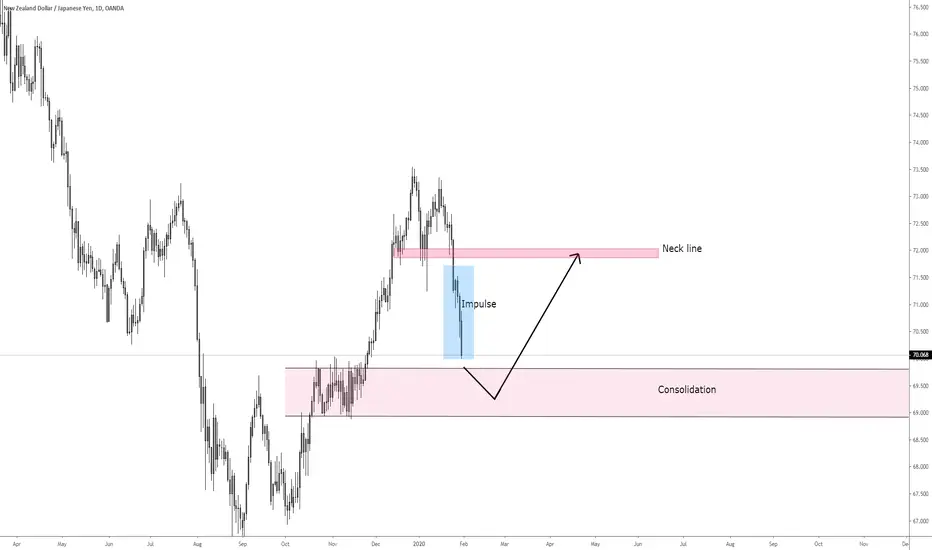
Long on NZDJPY on D1Observed an inverted H&S on the NZDJPY Pair on D1 TF, the formation of the second shoulder is completed.
Nzdjpylong

NZDJPY trade idea on H1NZDJPY soared high after the announcement of interest rate by RBNZ, currently we area seeing price form a falling wedge pattern and giving us long trade opportunities.
Plan : wait for prices to bounce off from horizontal support --> wait for the rejection candle pattern to form e.g. bullish engulfing, pinbar etc --> BUY
**Disclaimer** the content on this analysis is subject to change at any time without notice, and is provided for the sole purpose of assisting traders to make independent investment decisions.
Traders!! if you like my ideas and do take the same trade like i do, please write it in comment so we can manage the trade together.
_____________________________________________________________________________________________________________________
Thank you for your support ;)
GWBFX
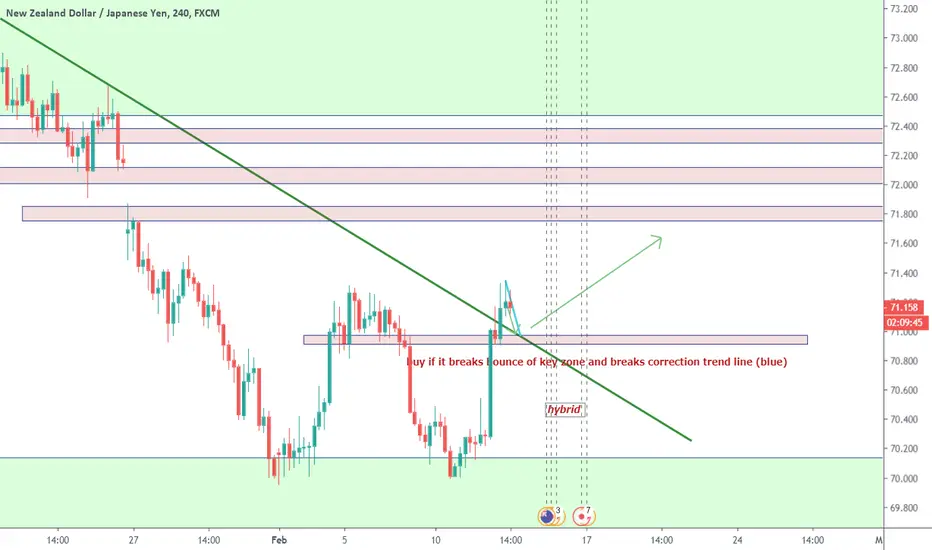
nzd jpybuy if it bounce off keyzone and breaks correction trend line. stop loss should be placed below structure OANDA:NZDJPY
NZDJPY Clean & Clear Hi Traders, here is the full Update Analysis / Breakdown for NZDJPY.
Keep this pair on your watch-list.
Conditions -
1.Wait for confirmation( Break Of Structure )
2.Use Risk Management (Risk 1% of your capital)
3.Do your Own analysis!
4.Follow for more Analysis like this !
Dont forget to give me a like & Follow
let me know in the comment section below if you have any questions.
Your Support is much appreciated!
See You in the next Video / Analysis
Global Fx Education Team

NZDJPY Analysis 02/11/2020After eyeing this pair for over a week, setups are to be taken.
Personal Trade Setup (This is not Financial Advice, simply a display of personal data)
Entry: 70.277
SL: 69.915
TP: 72.650
FOREXCOM:NZDJPY

NZD/JPY LONG SET UPTitle : NZD/JPY Buy SIGNAL
Asset : FOREX
Symbol : NZD/JPY
Type : Market buy
Time Frame : H4
Entry Price 1 : 70.012
Entry Price 2 : 69.980
Stop Loss : 69.712
Take Profit : TP 1: 70.312
TP 2: 70.512
TP3: 70.812
Status : active
NZDJPY possible double bottom formation!Plan : trendline breakout --> wait for price to bounce off from trendline or support level --> wait for the rejection candle pattern to form e.g. bullish engulfing, pinbar etc --> BUY
**Disclaimer** the content on this analysis is subject to change at any time without notice, and is provided for the sole purpose of assisting traders to make independent investment decisions.
Traders!! if you like my ideas and do take the same trade like i do, please write it in comment so we can manage the trade together.
_____________________________________________________________________________________________________________________
Thank you for your support ;)
GWBFX
Trading Pathways Analysis of NZDJPY H4 Chart
The outlined white arrow pathway is the predicted pathway that the NZDJPY will follow in the coming days or weeks. Using my unique charting methods, I have been able to arrive at HIGH PROBABILITY turning points where NZDJPY will turn.
PLEASE NOTE THE ABOVE ANALYSIS IS FOR EDUCATIONAL PURPOSES ONLY. THEY ARE NOT DIRECT INSTRUCTIONS TO TRADE AND ANY LOSS INCURRED BY FOLLOWING THIS ANALYSIS IS AT YOUR OWN RISK.
Eiseprod of Trading Pathways
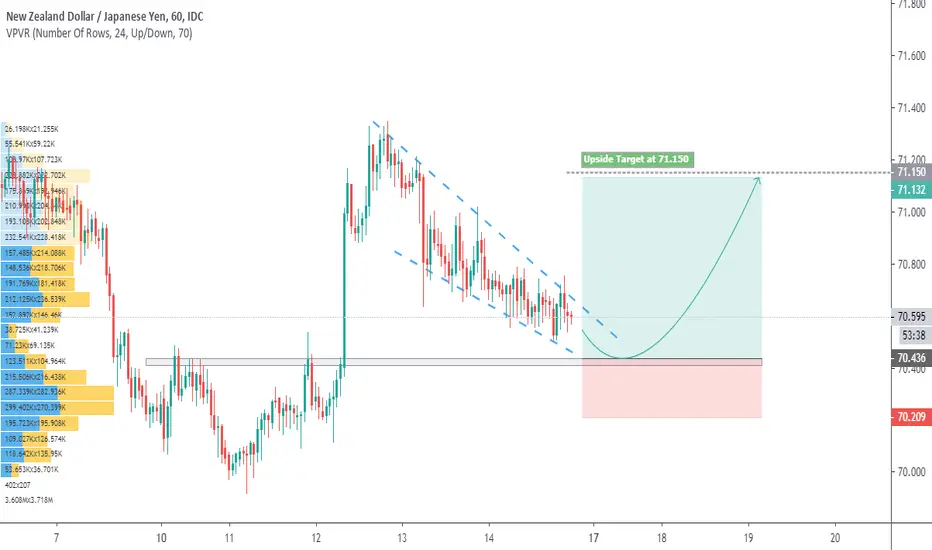
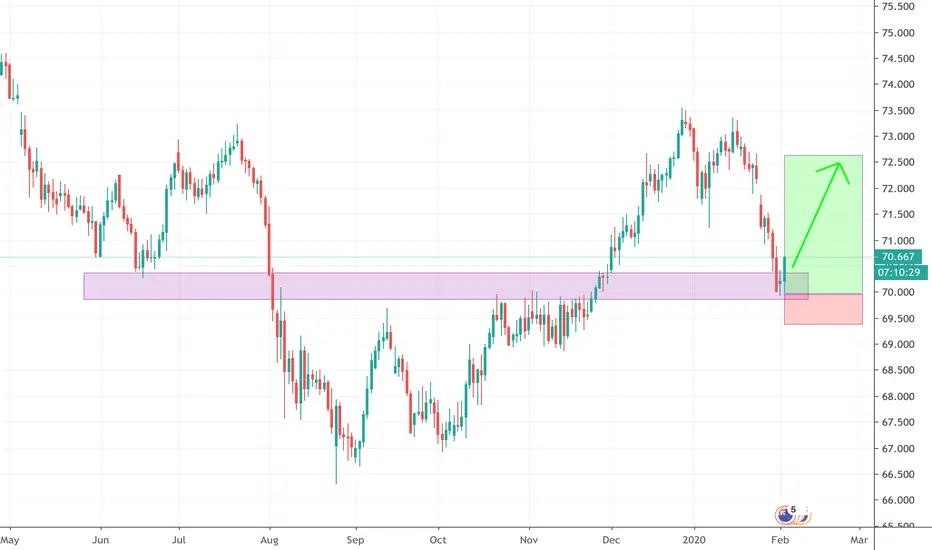
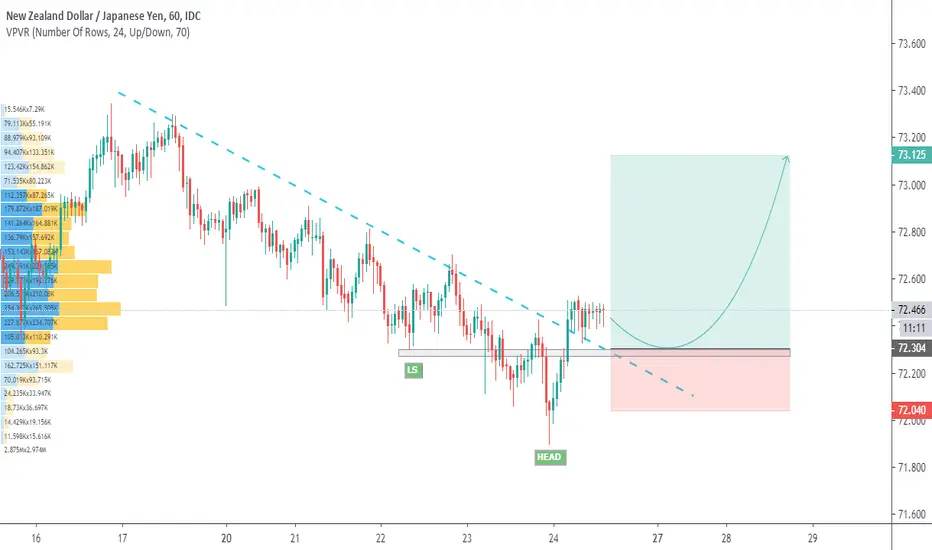
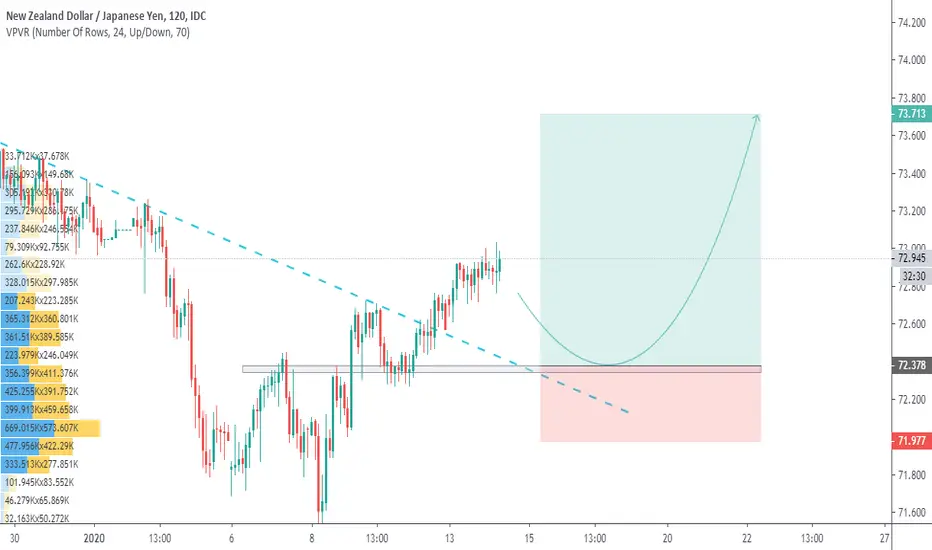
NZDJPY - Long opportunity into huge liquidity poolZooming out there's a massive accumulation area that hasn't been tested. If price bounces off the point of release (shown by the yellow line), I expect we test in the gap area (FVG).
NZD/JPY : Looking For the Drop in downsideTrade Setup for the Downside, I am expecting a drop in downside as i Forecast.
ThankYou

BULLISH PATTERNnzd/jpy breeched 71.000 level which is an important level, also this level line up with fib 0.618, price rejected this level multiple times
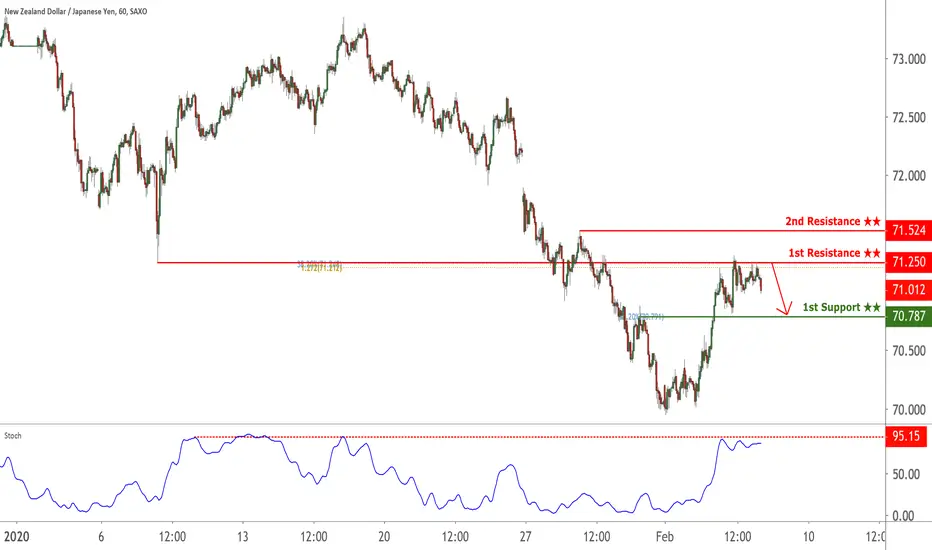
NZDJPY reversed from resistance, potential drop!
NZDJPY reversed off its resistance at 71.250 where it could potentially drop further to 70.787.
Trading CFDs on margin carries high risk.
Losses can exceed the initial investment so please ensure you fully
understand the risks.
Potential Bullish ActionThe support area has been retested and has a high probability of a bull run
*Please share your opinions in the comment section. Good luck traders 😁
NZDJPY Possible M formation completion!Hi Traders, here is the full Update Analysis / Breakdown for NZDJPY .
Keep this pair on your watch-list.
Conditions -
1.Wait for confirmation
2.Use Risk Management (Risk 1% of your capital)
3.Do your Own analysis!
4.Follow for more Analysis like this !
Dont forget to give me a like & Follow
let me know in the comment section below if you have any questions.
Your Support is much appreciated!
See You in the next Video / Analysis
Global Fx Education Team

NZDJPY Long I would like to see a enter to the consolidation zone. A fake break out to the short side then a retrace to the neck line ( long side).
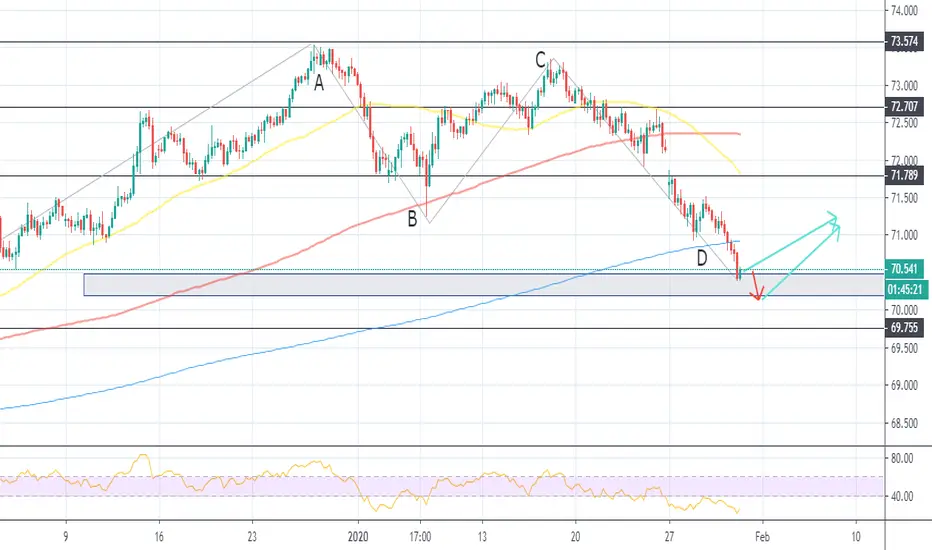
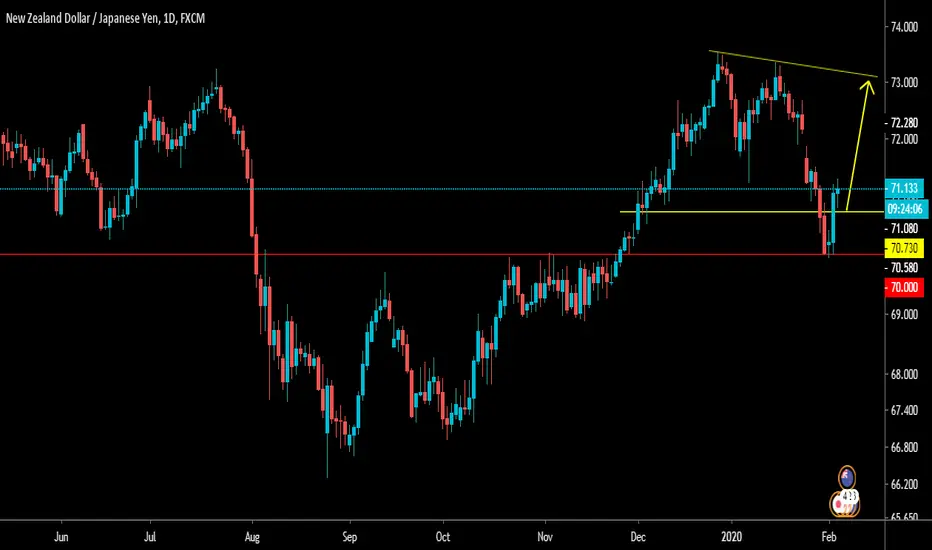
NZDJPY at critical Area, could go either way.In all my previous NZDJPY ideas, I recommended traders to sell NZDJPY. If you followed, you might have made close to 200 pips profit from those.
However, through this analysis, I want to say that NZDJPY could bounce upwards in the coming days.
Today's daily candle might show indications of a trend reversal as this candle has formed at the 100D EMA.
So, if NZDJPY closed around 71.25 today, we could very well see a trend reversal in the coming days.
That being said, if price does manage to break the 71 barrier and manages to stay below it, the next area of importance will be 70.
Ideally, I would keep an eye on today's closing price before executing any further trades.

NZDJPY buy on H1, potential inverted H&S formation!Plan : wait for prices to bounce off horizontal support --> wait for the rejection candle pattern to form e.g. bullish engulfing , pinbar etc --> BUY
**Disclaimer** the content on this analysis is subject to change at any time without notice, and is provided for the sole purpose of assisting traders to make independent investment decisions.
Traders!! if you like my ideas and do take the same trade like i do, please write it in comment so we can manage the trade together.
_____________________________________________________________________________________________________________________
Thank you for your support ;)
GWBFX
NZD/JPY : Rising Wedge Broken in downsideProbabaly that NZDJPY Will test his Prev Swing Low .
Rising Wedge Pattern broken in downsode
I hope will be drop in downside.

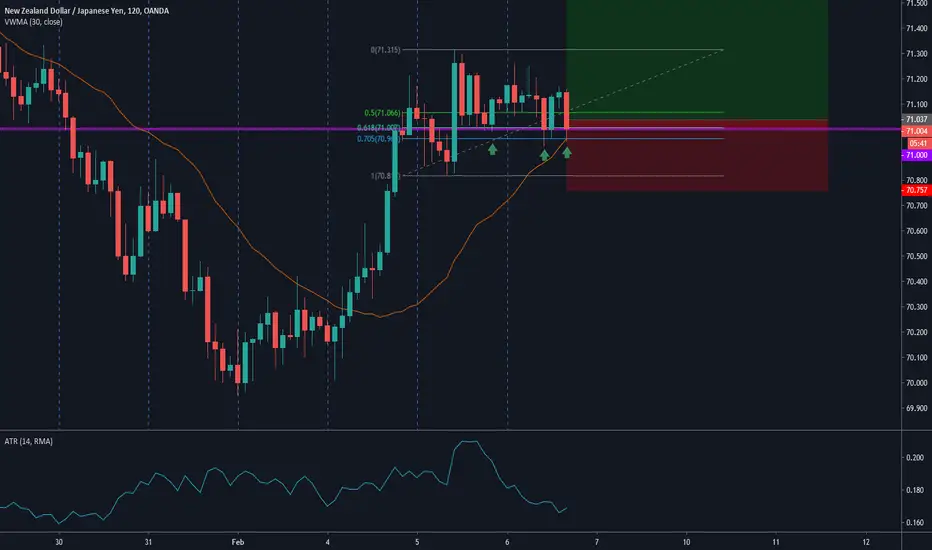
NZDJPY buy on H2Plan : wait for prices to bounce off horizontal support --> wait for the rejection candle pattern to form e.g. bullish engulfing , pinbar etc --> BUY
**Disclaimer** the content on this analysis is subject to change at any time without notice, and is provided for the sole purpose of assisting traders to make independent investment decisions.
Traders!! if you like my ideas and do take the same trade like i do, please write it in comment so we can manage the trade together.
_____________________________________________________________________________________________________________________
Thank you for your support ;)
GWBFX
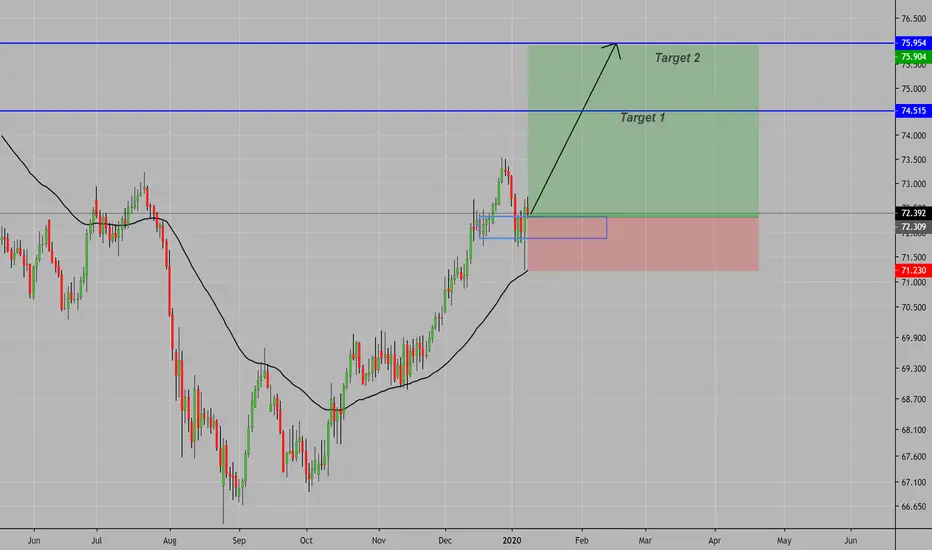
NZDJPY LongMomentum from weekly to daily confirms bullish momentum. Re-testing previous order block turned breaker. Violated previous Lower High also indicating a bullish bias. Swing with 2 targets will be trading conservatively as with all swings.