NZD/USD Rises by ~1.4% in 2 DaysNZD/USD Rises by ~1.4% in 2 Days
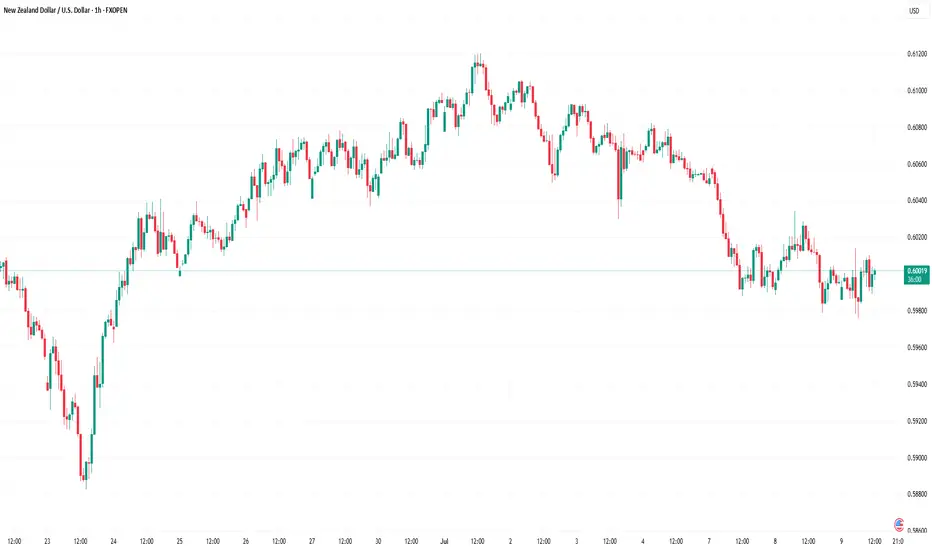
As the NZD/USD chart shows, the New Zealand dollar was trading around 0.5820 against the US dollar on Wednesday, but today it has climbed above 0.5895 – an impressive gain of approximately 1.4% in just two days.
The rise in NZD/USD is being driven both by the general weakening of the US dollar ahead of the Federal Reserve’s expected September rate cut, and by strengthening demand for the “kiwi”. As Reuters notes:
→ the New Zealand dollar is often used as a substitute for the yuan because of close trade relations with China;
→ meanwhile, the yuan is strengthening, with Chinese policymakers recommending support for the currency given its low valuation and the need to facilitate trade negotiations with the US.
Technical Analysis of the NZD/USD Chart
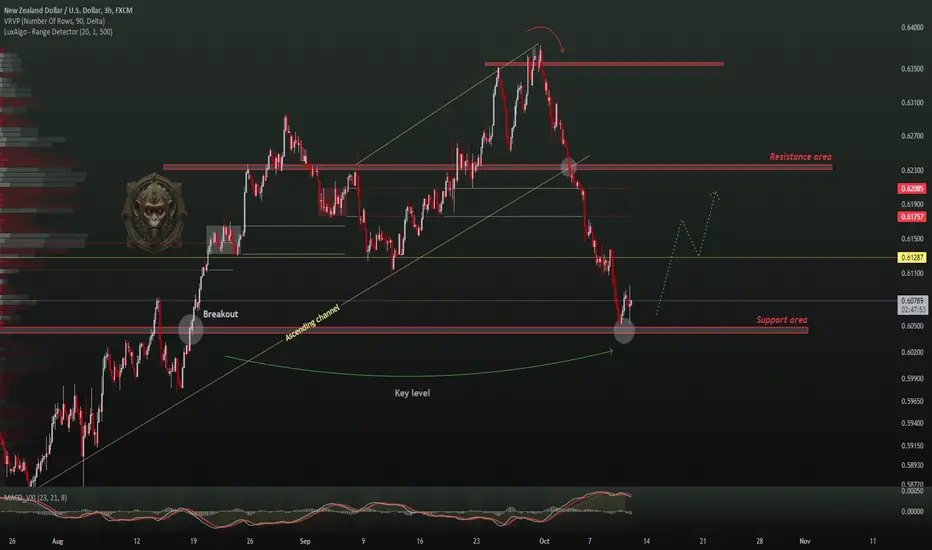
It’s worth paying attention to the unusual trading activity (marked by the arrow) and its context:
→ it was the lowest level in more than four months;
→ after a sharp decline, the price stabilised near the lower boundary of the channel;
→ trading was fairly active, and although the price was drifting lower, it failed to generate strong bearish momentum.
It is possible that so-called Smart Money was attracted by the undervalued asset, preventing further declines through buy orders and accumulating long positions. If so, from this perspective it is notable that:
→ the 0.5820 level acted as support on Wednesday – the price rebounded sharply;
→ yesterday NZD/USD moved into the upper half of the channel, breaking through the 0.5875 resistance.
This week’s price rise has formed a trajectory marked by purple lines. NZD/USD might be heading towards the upper boundary of the ascending channel, with the following resistance levels standing out along the way:
→ the former support at 0.5910;
→ the 50% Fibonacci retracement level from the A→B move.
An attempt to break through this resistance zone could result in a pullback towards the lower boundary of the purple channel.
This article represents the opinion of the Companies operating under the FXOpen brand only. It is not to be construed as an offer, solicitation, or recommendation with respect to products and services provided by the Companies operating under the FXOpen brand, nor is it to be considered financial advice.
Nzdusddaily
Market Analysis: NZD/USD Starts Recovery, Key Hurdles AheadMarket Analysis: NZD/USD Starts Recovery, Key Hurdles Ahead
NZD/USD is also rising and could aim for a move above 0.5900 in the short term.
Important Takeaways for NZD/USD Analysis Today
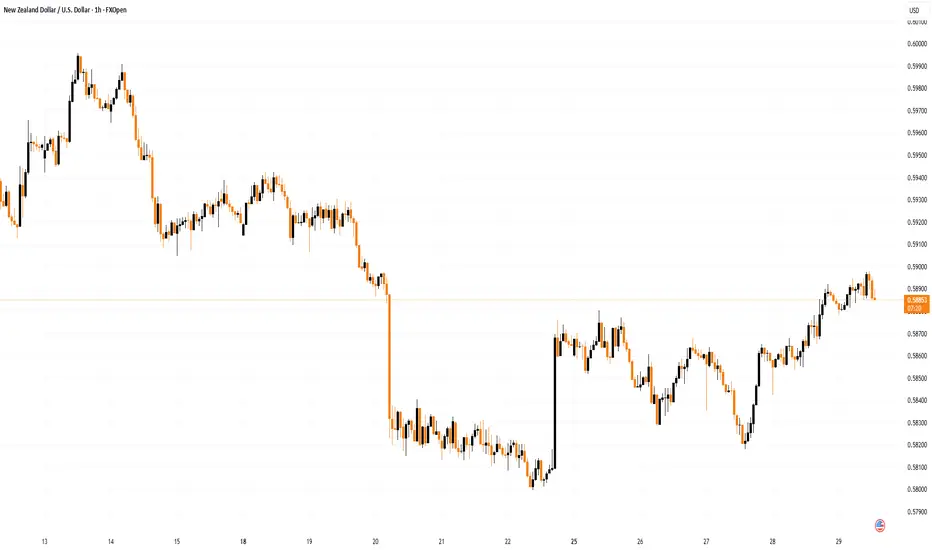
- NZD/USD is slowly moving higher above 0.5830.
- There is a major bearish trend line forming with resistance at 0.5870 on the hourly chart of NZD/USD.
NZD/USD Technical Analysis
On the hourly chart of NZD/USD, the pair followed AUD/USD. The New Zealand Dollar formed a base above the 0.5800 level and started a recovery wave against the US Dollar.
The pair climbed above the 50-hour simple moving average and 0.5830. There was a close above the 23.6% Fib retracement level of the downward move from the 0.5990 swing high to the 0.5830 low.
However, the bears are now active near the 0.5870 zone and a major bearish trend line. The NZD/USD chart suggests that the RSI is back above 60, signaling a positive bias. On the upside, the pair is facing resistance near 0.5870.
The next major hurdle for buyers could be near the 50% Fib retracement at 0.5895. A clear move above 0.5895 might even push the pair toward 0.5910. Any more gains might clear the path for a move toward the 0.5945 pivot zone in the coming sessions.
On the downside, there is support forming near the 0.5830 zone. If there is a downside break below 0.5830, the pair might slide toward 0.5800. Any more losses could lead NZD/USD into a bearish zone to 0.5740.
This article represents the opinion of the Companies operating under the FXOpen brand only. It is not to be construed as an offer, solicitation, or recommendation with respect to products and services provided by the Companies operating under the FXOpen brand, nor is it to be considered financial advice.
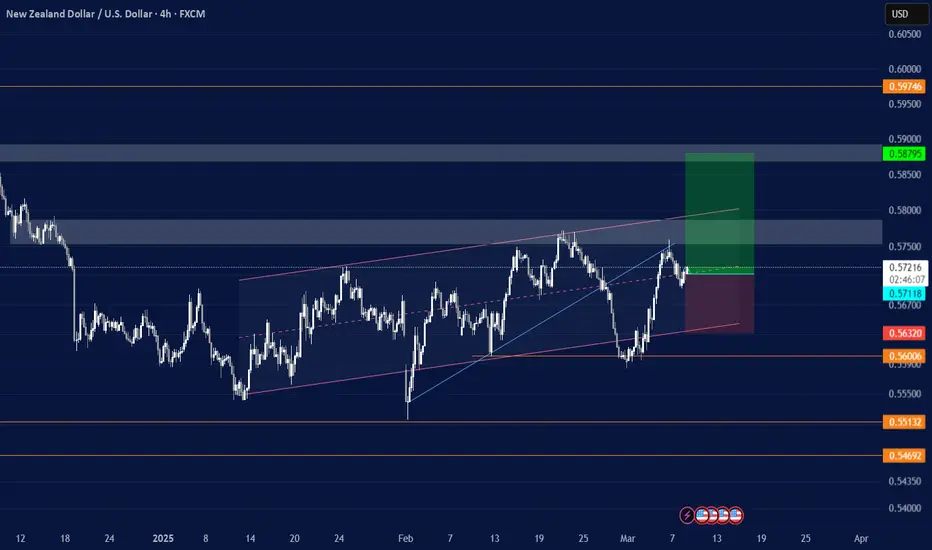
NZD/USD Holds Near Four-Month LowNZD/USD Holds Near Four-Month Low
As today’s NZD/USD chart shows, the pair is trading near a four-month low following a sharp decline. The drop occurred yesterday after the Reserve Bank of New Zealand cut the official cash rate by 25 basis points to a three-year low of 3.0% and indicated that the rate could fall further to 2.55% by May 2026.
According to Trading Economics:
- Analysts now expect at least two additional rate cuts before the end of the year;
- There is a risk of deeper cuts depending on incoming economic data.
New Zealand’s exports are also under pressure, particularly due to the 15% US tariffs that came into effect earlier this month, threatening to undermine the country’s competitiveness in key markets. According to Reuters, Citi analysts expect GDP to contract in the second quarter, raising the risk of a recession in New Zealand.
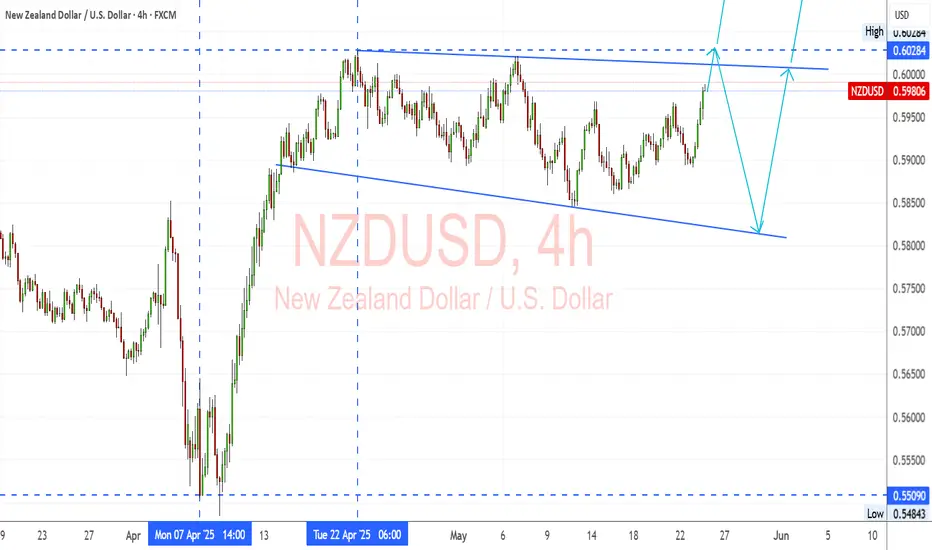
Technical Analysis of the NZD/USD 4-Hour Chart
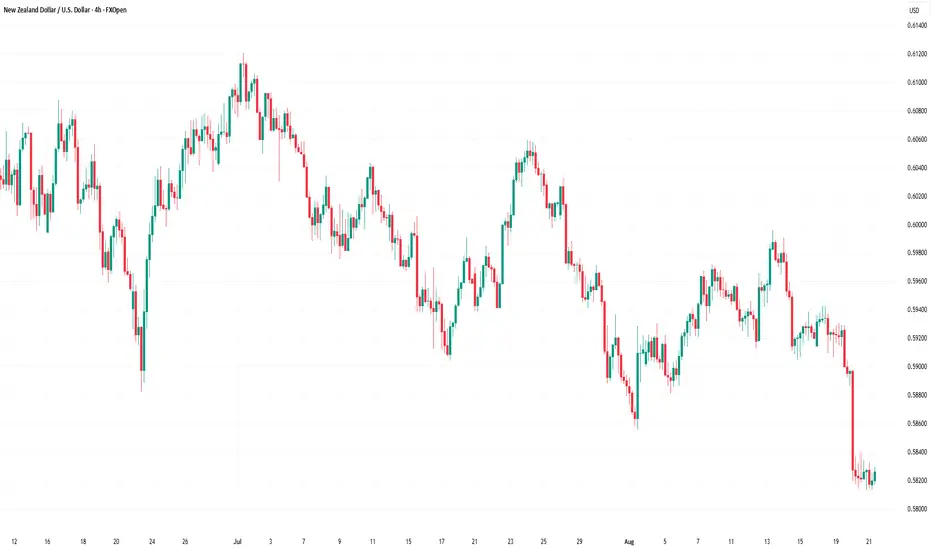
NZD/USD price action since early July has formed a downward channel (marked in red), reflecting a bearish outlook. Key observations:
→ Yesterday’s drop was sharp, with a very long candle closing near its lows – a bearish signal;
→ However, the lower boundary of the channel acted as strong support, holding back further pressure.
Looking at the broader context:
→ The B→C recovery reached approximately the 0.618 Fibonacci retracement level after the A→B impulse;
→ The D→E rebound from the channel’s median was modest, signalling weak demand.
Given the strength of the channel’s lower boundary and the oversold condition (as shown by the RSI), bulls have some grounds to expect a potential rebound. In that case, NZD/USD could face resistance from the QL line, which divides the descending channel into two quarters.
Reaching the resistance zone formed by the channel median and the 0.589 level (previously acted as support during the inverse head and shoulders pattern - highlighted with arrows) could be difficult in the near term under current conditions.
This article represents the opinion of the Companies operating under the FXOpen brand only. It is not to be construed as an offer, solicitation, or recommendation with respect to products and services provided by the Companies operating under the FXOpen brand, nor is it to be considered financial advice.
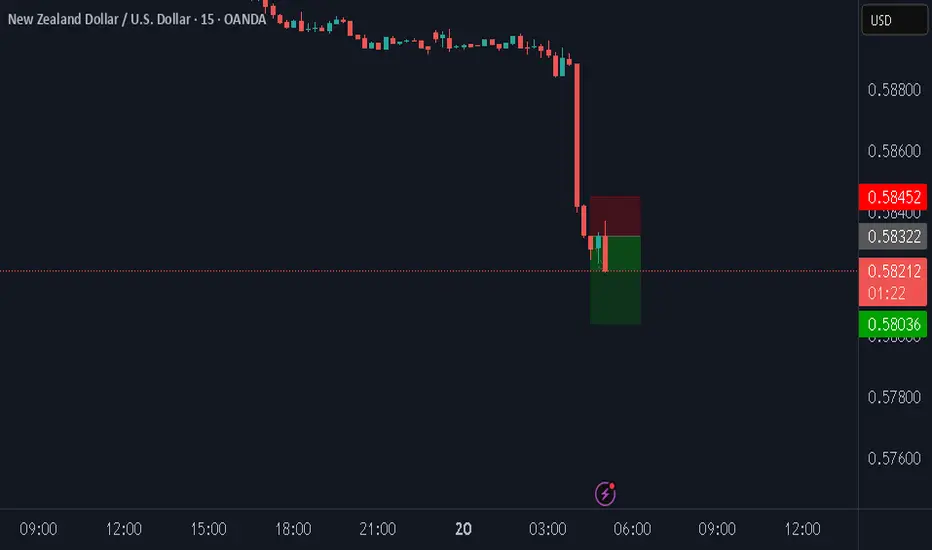
NZDUSD short due to as exptected interrest rate decion by RBNZDThe current benchmark interest rate in New Zealand, known as the Official Cash Rate (OCR), is 3.0%, as set by the Reserve Bank of New Zealand (RBNZ). This follows a 25-basis-point cut from 3.25% on August 20, 2025, marking the lowest rate since August 2022.
Due to this result, we expect NZD to weaken against the USD.
Market Analysis: NZD/USD SlipsMarket Analysis: NZD/USD Slips
NZD/USD is struggling and might decline below the 0.5980 level.
Important Takeaways for NZD/USD Analysis Today
- NZD/USD is consolidating above the 0.5980 support.
- There is a connecting bearish trend line forming with resistance at 0.6010 on the hourly chart of NZD/USD at FXOpen.
NZD/USD Technical Analysis
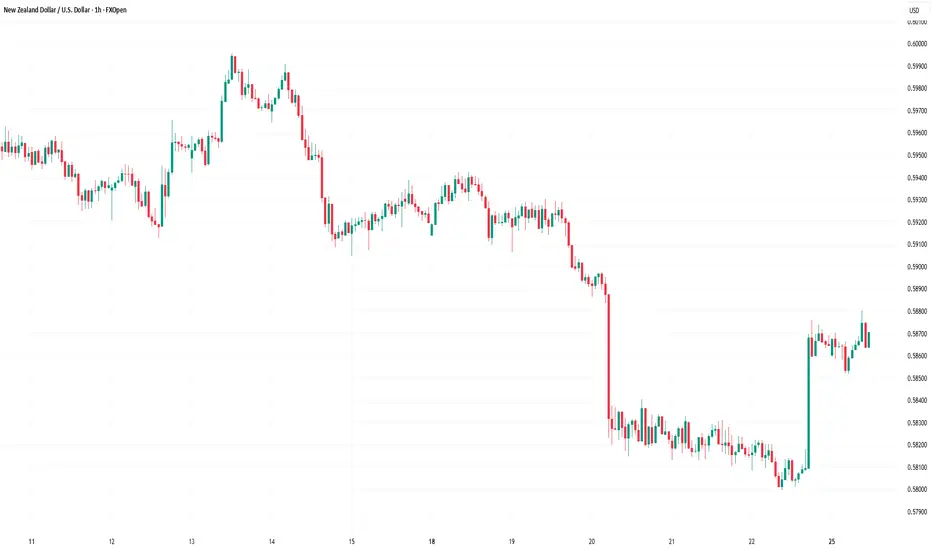
On the hourly chart of NZD/USD at FXOpen, the pair also followed AUD/USD. The New Zealand Dollar struggled above 0.6100 and started a fresh decline against the US Dollar.
There was a move below the 0.6050 and 0.6020 support levels. A low was formed at 0.5978 and the pair is now consolidating losses below the 50-hour simple moving average. The NZD/USD chart suggests that the RSI is back below 50 signalling a bearish bias.
On the upside, the pair is facing resistance near the 23.6% Fib retracement level of the downward move from the 0.6120 swing high to the 0.5978 low. There is also a connecting bearish trend line forming with resistance at 0.6010.
The next major resistance is near the 0.6065 level or the 61.8% Fib retracement level. A clear move above the 0.6065 level might even push the pair toward the 0.6120 level. Any more gains might clear the path for a move toward the 0.6150 resistance zone in the coming days.
On the downside, there is a support forming near the 0.5980 zone. If there is a downside break below 0.5980, the pair might slide toward 0.5940. Any more losses could lead NZD/USD in a bearish zone to 0.5910.
This article represents the opinion of the Companies operating under the FXOpen brand only. It is not to be construed as an offer, solicitation, or recommendation with respect to products and services provided by the Companies operating under the FXOpen brand, nor is it to be considered financial advice.
NZDUSD Trade Idea. Key Levels for a Potential NZD/USD Short📉 NZD/USD is trending strongly bearish, and I’ve just posted a new breakdown on TradingView 🎥. The current price action looks overextended, and the pair remains under heavy selling pressure 🔻.
I’m watching for a potential retracement into the Fibonacci 50%–61.8% zone 🔄 — the equilibrium area where I’ll be eyeing a possible short entry 🎯.
The video covers entry ideas, stop-loss placement, and target levels 🎯📍.
⚠️ This is not financial advice — for educational purposes only.

NZD/USD Shows Bullish Hints, Can Gains Be Sustained?Market Analysis: NZD/USD Shows Bullish Hints, Can Gains Be Sustained?
NZD/USD is also rising and might aim for more gains above 0.6040.
Important Takeaways for NZD/USD Analysis Today
- NZD/USD is consolidating gains above the 0.6000 zone.
- There was a break above a major bearish trend line with resistance at 0.5970 on the hourly chart of NZD/USD at FXOpen.
NZD/USD Technical Analysis
On the hourly chart of NZD/USD at FXOpen, the pair started a steady increase from the 0.5880 zone. The New Zealand Dollar broke the 0.5920 resistance to start the recent increase against the US Dollar.
There was a break above a major bearish trend line with resistance at 0.5970. The pair settled above 0.5960 and the 50-hour simple moving average. It tested the 0.6040 zone and is currently consolidating gains.
The pair tested the 23.6% Fib retracement level of the upward move from the 0.5882 swing low to the 0.6040 high. However, the bulls are active above the 0.6000 level.
The NZD/USD chart suggests that the RSI is stable near 60. On the upside, the pair might struggle near 0.6040. The next major resistance is near the 0.6090 level.
A clear move above the 0.6090 level might even push the pair toward 0.6120. Any more gains might clear the path for a move toward the 0.6200 resistance zone in the coming days.
On the downside, immediate support is near the 0.5980 level. The first key support is near 0.5960. It is close to the 50% Fib retracement level.
The next major support is near 0.5920. If there is a downside break below the 0.5920 support, the pair might slide toward 0.5880. Any more losses could lead NZD/USD in a bearish zone to 0.5850.
This article represents the opinion of the Companies operating under the FXOpen brand only. It is not to be construed as an offer, solicitation, or recommendation with respect to products and services provided by the Companies operating under the FXOpen brand, nor is it to be considered financial advice.
NZD/USD Aims Steady IncreaseNZD/USD Aims Steady Increase
NZD/USD is also rising and might aim for more gains above 0.6080.
Important Takeaways for NZD USD Analysis Today
- NZD/USD is consolidating gains above the 0.6030 zone.
- There is a key bullish trend line forming with support at 0.6030 on the hourly chart of NZD/USD at FXOpen.
NZD/USD Technical Analysis
On the hourly chart of NZD/USD on FXOpen, the pair started a steady increase from the 0.5990 zone. The New Zealand Dollar broke the 0.6020 resistance to start the recent increase against the US Dollar.
The pair settled above 0.6030 and the 50-hour simple moving average. It tested the 0.6065 zone and is currently consolidating gains. The pair corrected lower below the 0.6050 level and the 23.6% Fib retracement level of the upward move from the 0.6006 swing low to the 0.6064 high.
However, the bulls are active above the 0.6030 level. The NZD/USD chartsuggests that the RSI is stable near 50. On the upside, the pair might struggle near 0.6065. The next major resistance is near the 0.6080 level.
A clear move above the 0.6080 level might even push the pair toward the 0.6120 level. Any more gains might clear the path for a move toward the 0.6200 resistance zone in the coming days.
On the downside, immediate support is near the 0.6030 level. There is also a key bullish trend line forming with support at 0.6030. It is close to the 61.8% Fib retracement level of the upward move from the 0.6006 swing low to the 0.6064 high.
The first key support is near the 0.6005 level. The next major support is near the 0.5990 level. If there is a downside break below the 0.5990 support, the pair might slide toward the 0.5970 support. Any more losses could lead NZD/USD in a bearish zone to 0.5950.
This article represents the opinion of the Companies operating under the FXOpen brand only. It is not to be construed as an offer, solicitation, or recommendation with respect to products and services provided by the Companies operating under the FXOpen brand, nor is it to be considered financial advice.
nzdusd sell signal. Don't forget about stop-loss.
Write in the comments all your questions and instruments analysis of which you want to see.
Friends, push the like button, write a comment, and share with your mates - that would be the best THANK YOU.
P.S. I personally will open entry if the price will show it according to my strategy.
Always make your analysis before a trade
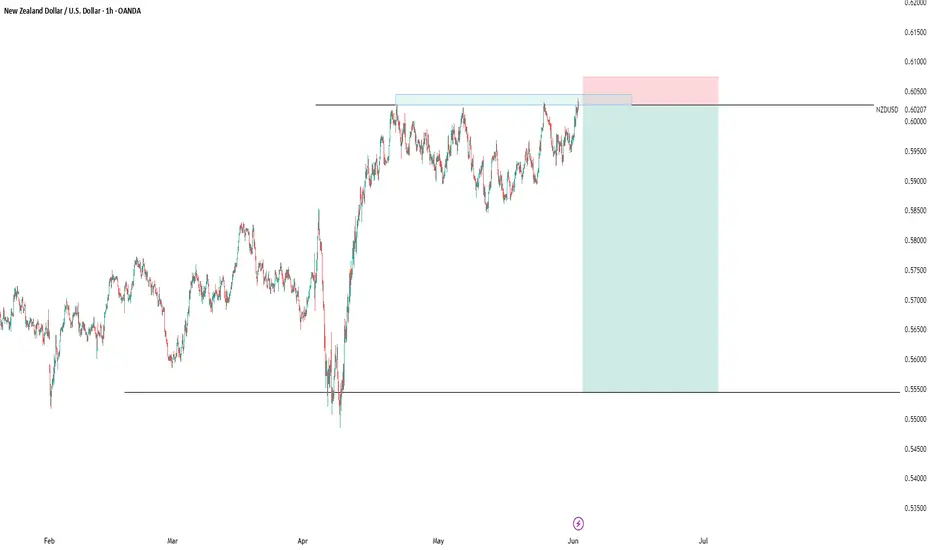
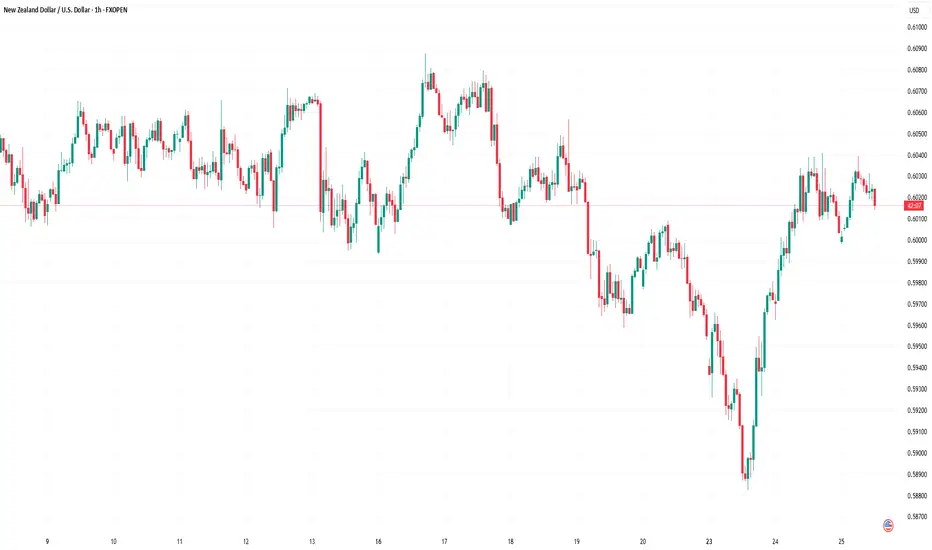
NZDUSD Range Tightens – Breakout Setup BuildingNZDUSD continues to coil within a contracting triangle, forming a symmetrical wedge bounded by lower highs and higher lows. Price is approaching the resistance zone near 0.6028, with visible indecision and rejection wicks, signaling potential for either breakout or rejection.
Key Levels:
Resistance: 0.6028 (structural ceiling, key pivot)
Support: ~0.5800 (ascending support line of wedge)
Breakout Target (Bullish): 0.6150–0.6200
Breakdown Target (Bearish): 0.5650–0.5550
Scenarios to Watch:
🔹 Bearish Rejection
Price rejects off 0.6028 and returns inside range
Watch for momentum drop and move toward wedge base (0.5800)
Clean breakdown opens path toward April lows (~0.5509)
🔹 Bullish Breakout
Break and hold above 0.6028
Confirmation on 4H close + retest
Opens room for bullish extension toward 0.6150+
Outlook:
Price is nearing apex compression, suggesting breakout is imminent.
Bias is neutral until price breaks out of the current wedge structure.
Expect volatility spike around the 0.6028 test.
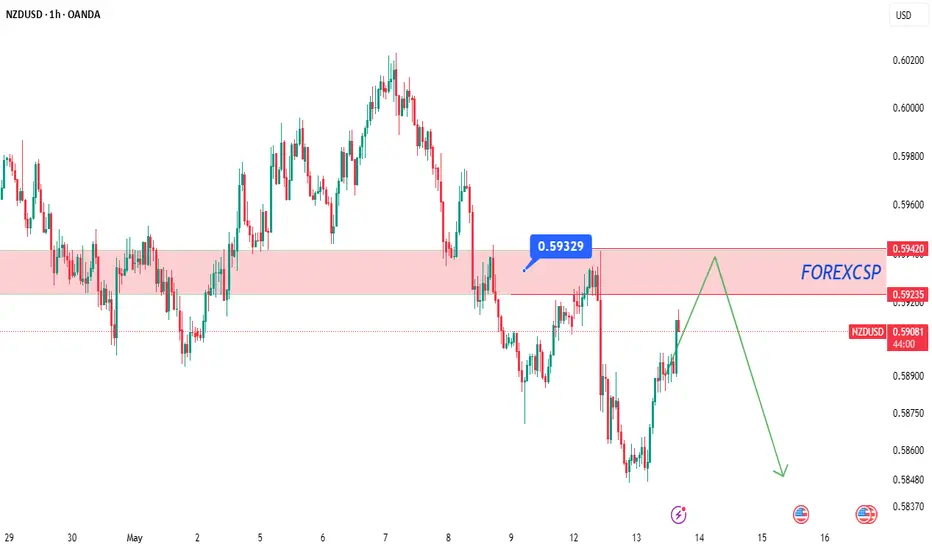
NZDUSD..SHORTPrice is nearing a critical level around .
** No setup, no trade. **
For me, a solid plan always comes before any prediction.
*****If the zone is broken and confirmed with a retest, I’ll adjust my plan accordingly for a possible reverse trade.
For detailed entry points, trade management, and high-probability setups, follow the channel:
ForexCSP
nzdusd sell signal. Don't forget about stop-loss.
Write in the comments all your questions and instruments analysis of which you want to see.
Friends, push the like button, write a comment, and share with your mates - that would be the best THANK YOU.
P.S. I personally will open entry if the price will show it according to my strategy.
Always make your analysis before a trade
#NZDUSD:DXY Gaining Its Strength Back, Is it end for the Bulls? The OANDA:NZDUSD DXY index shows a change in price character and momentum, indicating a possible price reversal for the shorter term. This aligns with our fundamental analysis, as there’s a likelihood of a China-US trade deal that could significantly influence the demand for the DXY.
There are two possible selling entries, allowing you to choose between a riskier or safer approach. Alongside these entries, we’ve set targets accordingly to your chosen entry.
Good luck and trade safely!
Thank you for your unwavering support! 😊
If you’d like to contribute, here are a few ways you can help us:
- Like our ideas
- Comment on our ideas
- Share our ideas
Team Setupsfx_
❤️🚀
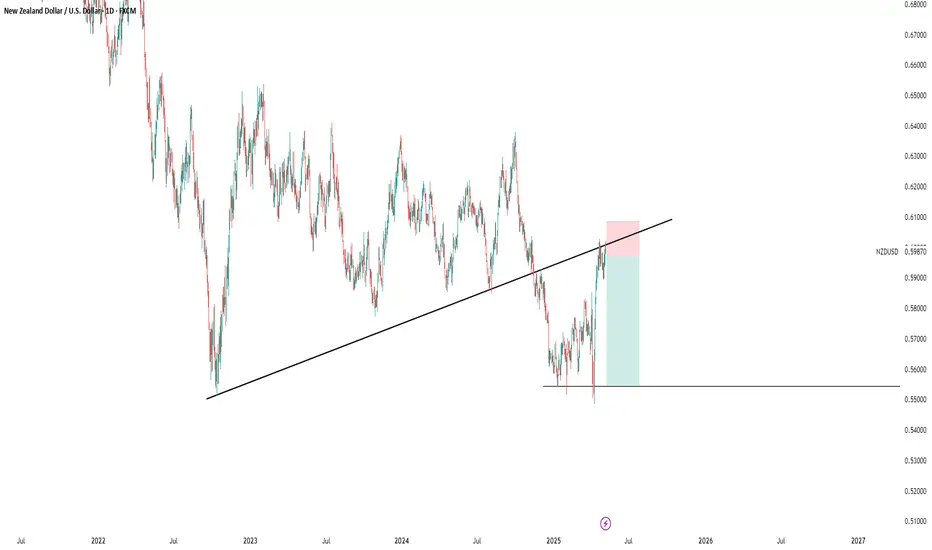
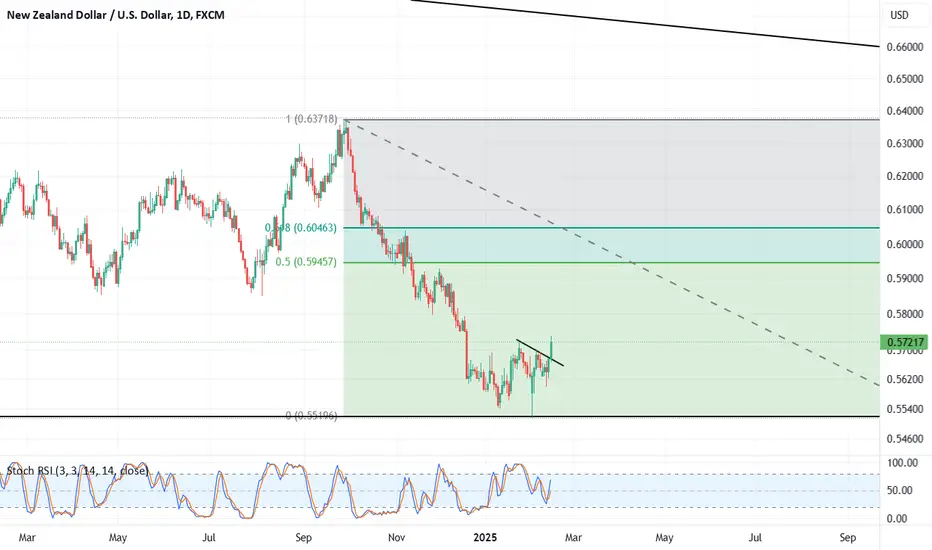
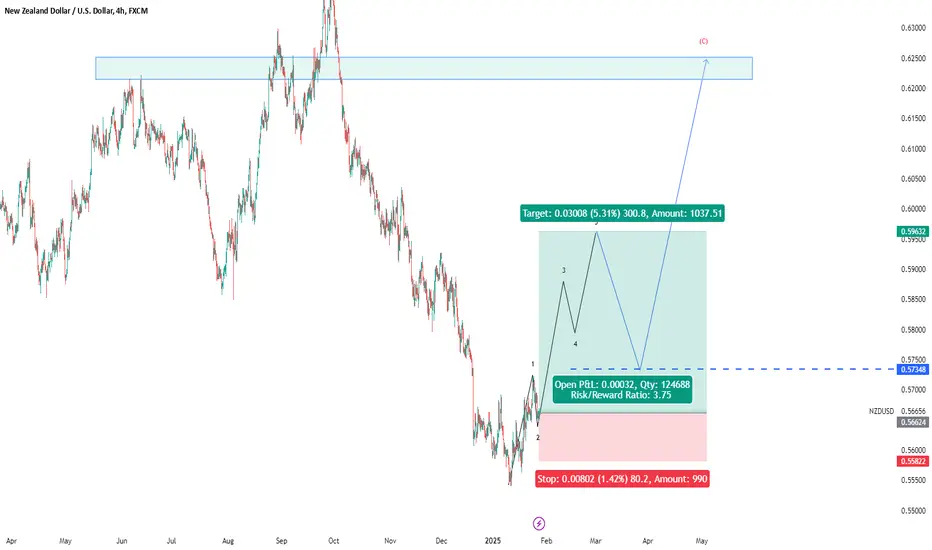
Long on NZD/USDI am long on NZDUSD. We have a bottoming structure with an additional trendline break.
You can long from a retest of trendline or as close to 0.56500.
Target 1 - Golden Zone area between 0.59500 - 0.60500
Target 2 - 0.63
nzdusd sell signal. Don't forget about stop-loss.
Write in the comments all your questions and instruments analysis of which you want to see.
Friends, push the like button, write a comment, and share with your mates - that would be the best THANK YOU.
P.S. I personally will open entry if the price will show it according to my strategy.
Always make your analysis before a trade
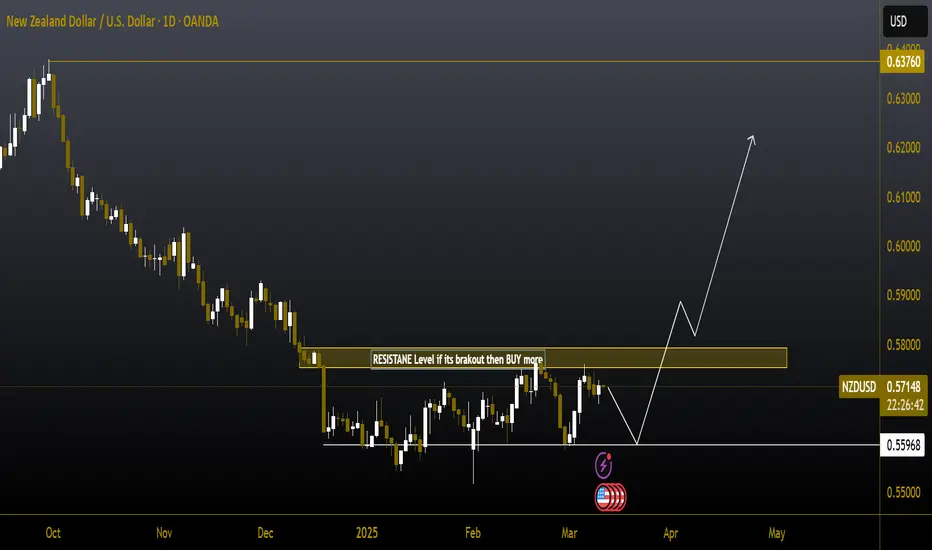
#NZDUSD 1DAYNZDUSD (1D Timeframe) Analysis
Market Structure:
The price is approaching a significant support level, which has previously acted as a key area for price reversals. This level is important for identifying potential buying opportunities.
Forecast:
It is recommended to wait for the price to reach the support level. If bullish confirmation is observed, such as bullish candlestick patterns or increased buying momentum, a buy position can be considered.
Key Levels to Watch:
- Entry Zone: Monitor the price behavior near the support level and consider buying if a clear bounce or bullish signal is confirmed.
- Risk Management:
- Stop Loss: Placed below the support zone to protect against a potential breakdown.
- Take Profit: Target the next resistance levels for potential gains.
Market Sentiment:
Confirmation of bullish sentiment will depend on how the price reacts at the support level. A strong bounce would indicate potential for upward movement, while a breakdown may signal further downside. Waiting for confirmation will provide better trade accuracy.
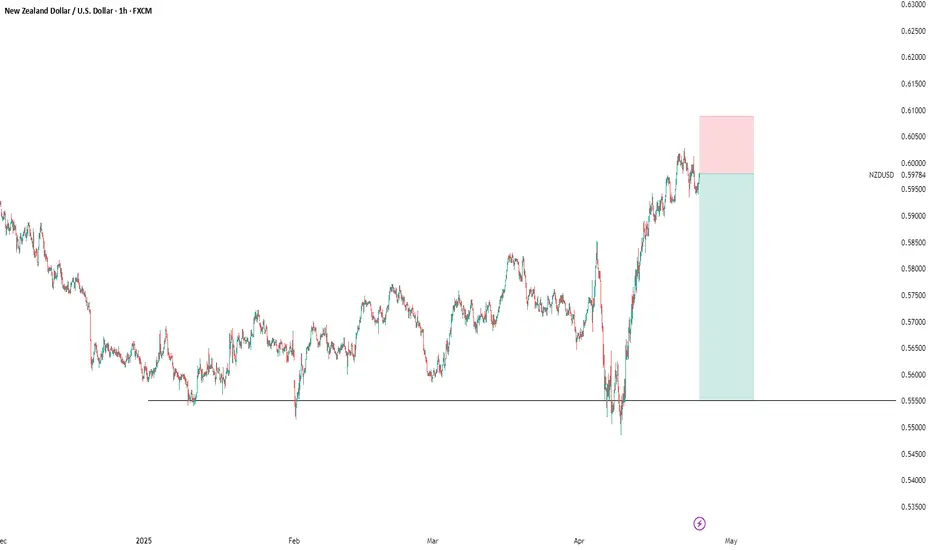
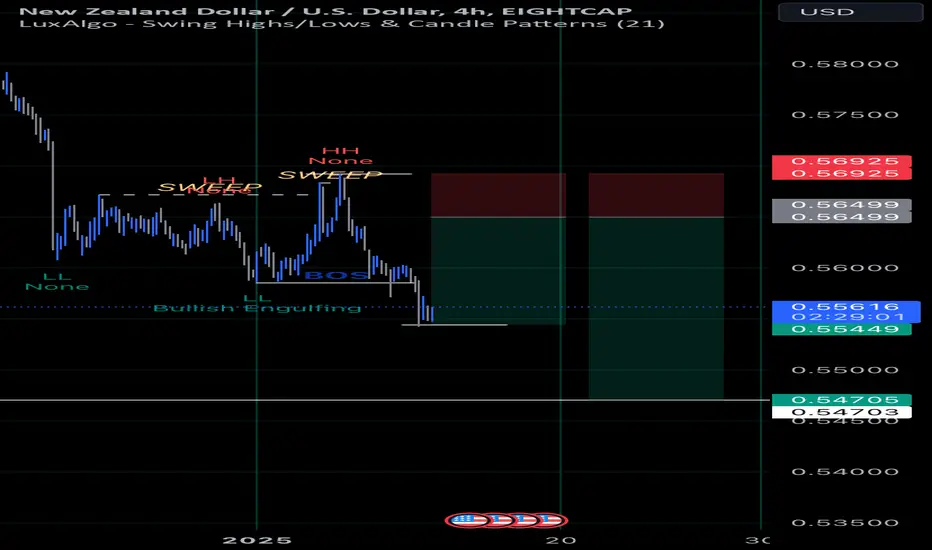
NZDUSDThe price has touched this base once and is now unable to fall, so I expect the price to rise above the upper base.
nzdusd buy signal. Don't forget about stop-loss.
Write in the comments all your questions and instruments analysis of which you want to see.
Friends, push the like button, write a comment, and share with your mates - that would be the best THANK YOU.
P.S. I personally will open entry if the price will show it according to my strategy.
Always make your analysis before a trade
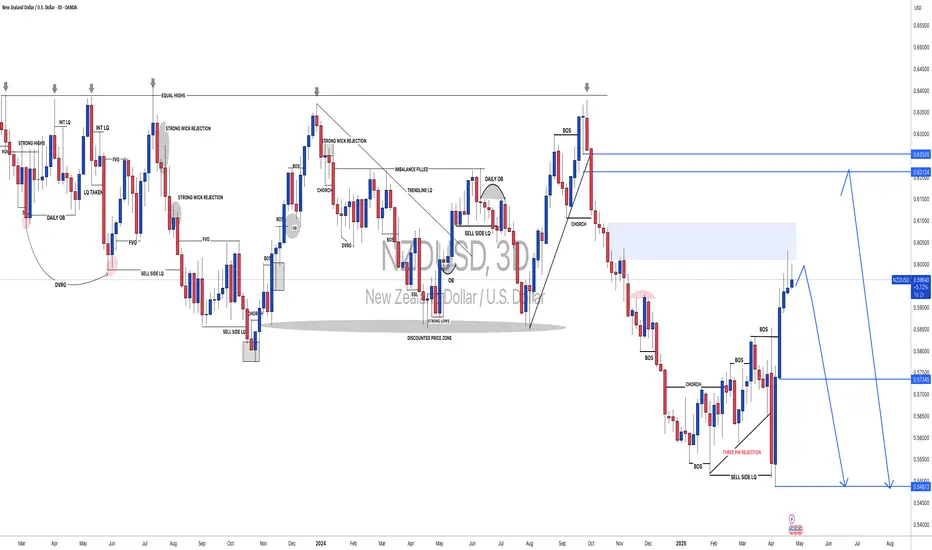
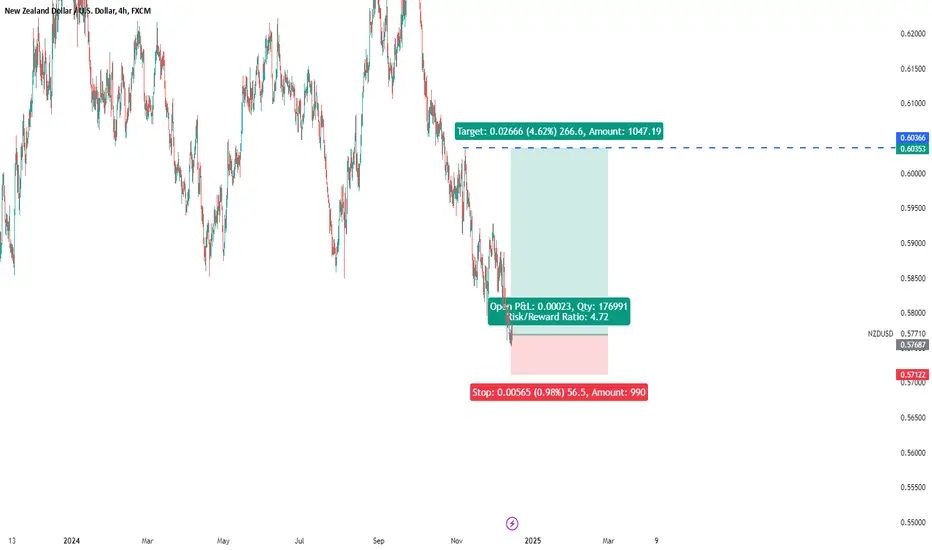
NZDUSD TRADE IDEA : SHORT | SELL (13/01/25)Very nice and easy setup. Nothing fancy with the opportunity of doubling the RR.
Following the order flow - no forcing whatsoever - I decided that the sell made most sense. Entry makes sense with the break of structure coming at the hands of a clear heavy imbalance.
RR1: 2.48
RR2: 4.21
nzdusd buy signal. Don't forget about stop-loss.
Write in the comments all your questions and instruments analysis of which you want to see.
Friends, push the like button, write a comment, and share with your mates - that would be the best THANK YOU.
P.S. I personally will open entry if the price will show it according to my strategy.
Always make your analysis before a trade
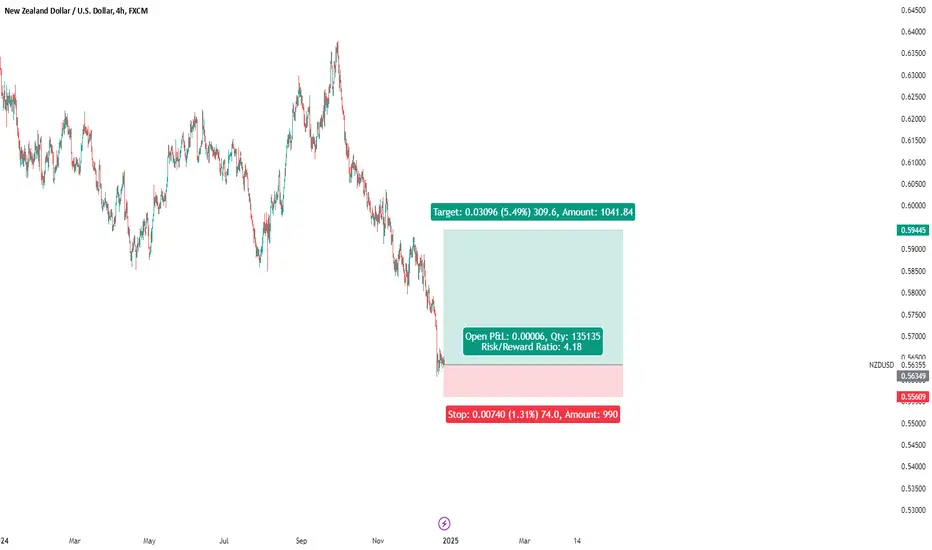
NZDUSD BUY | Idea Trading AnalysisNZD/USD is falling towards a support level which is a pullback support and could bounce from this level to our take profit.
We expect a decline in the channel after testing the current level which suggests that the price will continue to rise
Hello Traders, here is the full analysis.
I think we can soon see more fall from this range! GOOD LUCK! Great BUY opportunity NZDUSD
I still did my best and this is the most likely count for me at the moment.
-------------------
Traders, if you liked this idea or if you have your own opinion about it, write in the comments. I will be glad