NZDUSD END-WEEK ANALYSIS-UPDATE 24/09/2023Riding the Waves - Awaiting the Next Move
As anticipated, NZD/USD experienced a notable recovery following a drop, aligning with our earlier insights. However, the dynamic of this currency pair is ever-changing, and now, a new shift is on the horizon.
With a stronger US dollar looming, I'm now looking for another potential drop to the downside. Join me in navigating these market fluctuations as we stay vigilant and adapt our trading strategies. Stay tuned for the next chapter in the NZD/USD journey! 📉📈 #NZDUSDAnalysis #MarketOutlook #TradingView
THIS WORKS IF AND ONLY DXY MAINTAINS IT BULLISHNESS ABOVE 105.864
Nzdusdshort

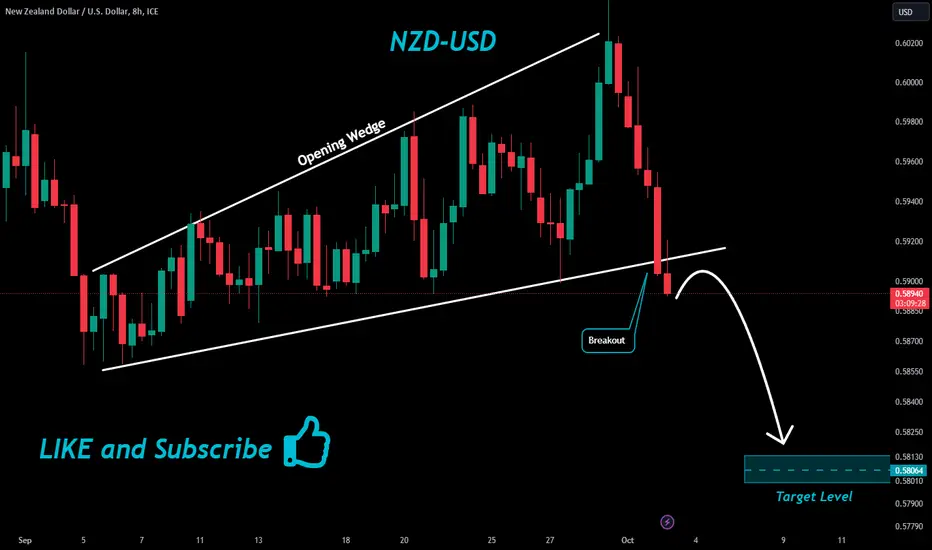
NZDUSD Bearish Breakout!NZD-USD was trading in an
Uptrend but now we are
Seeing a bearish breakout
From the opening wedge
Pattern which makes me
Bearish biased and I think
That we will see a move down !
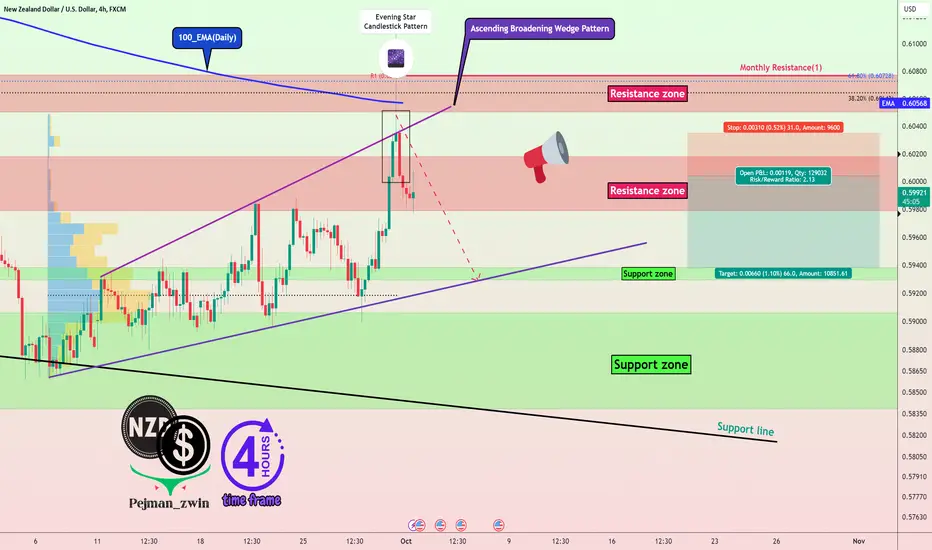
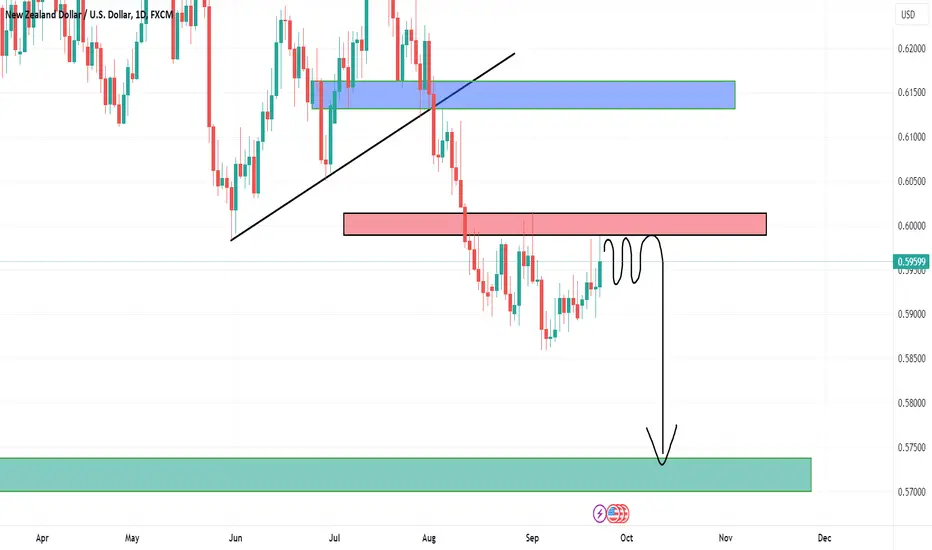
🚨NZDUSD will Fall by Ascending Broadening Wedge Pattern🚨✅NZDUSD managed to form an Ascending Broadening Wedge Pattern.
🐮Also, NZDUSD seems to have passed a Bull Trap .
🏃Currently, NZDUSD is moving in the 🔴 Resistance zone($0.6018-$0.5980) 🔴.
🔔I expect the NZDUSD to fall to the 🟢 Support zone($0.594-$0.5929) 🟢 and the lower line of the classic pattern due to the formation of the 💫Evening Star Candlestick Pattern💫 above the upper line of the Ascending Broadening Wedge Pattern.
New Zealand Dollar/U.S.Dollar Analyze ( NZDUSD ), 4-hour Time frame ⏰.
Do not forget to put Stop loss for your positions (For every position you want to open).
Please follow your strategy; this is just my idea, and I will gladly see your ideas in this post.
Please do not forget the ✅' like '✅ button 🙏😊 & Share it with your friends; thanks, and Trade safe.
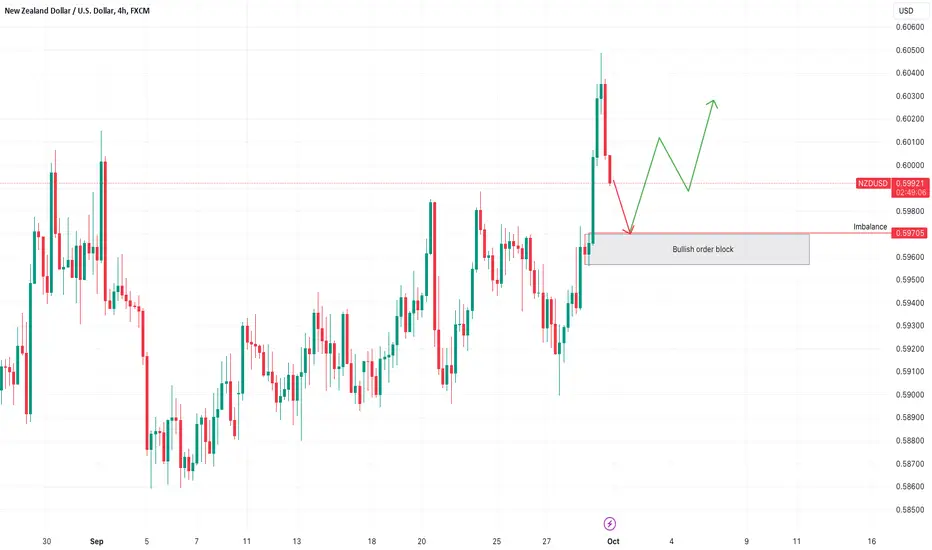
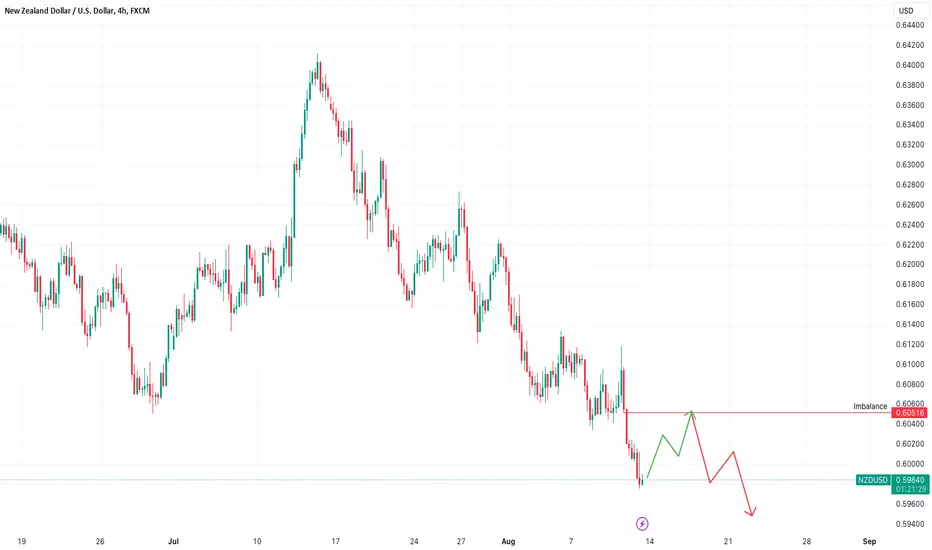
NZDUSD - Long after filling the imbalance ✅Hello traders!
‼️ This is my perspective on NZDUSD.
Technical analysis: Here we are in a bullish market structure from 4H timeframe perspective, so I am looking for long. I want price to go lower to fulfill the imbalance and then to reject from bullish order block.
Like, comment and subscribe to be in touch with my content
NZDUSD Q4 ANALYSISWhats'up traders! Howdy? This is my view on the NZDUSD for the year's last quarter. Subscribe to my page for a top-down analysis and entry points for day traders. Peace!
NZDUSD Long Term Selling Trading IdeaHello Traders
In This Chart NZDUSD HOURLY Forex Forecast By FOREX PLANET
today NZDUSD analysis 👆
🟢This Chart includes_ (NZDUSD market update)
🟢What is The Next Opportunity on NZDUSD Market
🟢how to Enter to the Valid Entry With Assurance Profit
This CHART is For Trader's that Want to Improve Their Technical Analysis Skills and Their Trading By Understanding How To Analyze The Market Using Multiple Timeframes and Understanding The Bigger Picture on the Charts
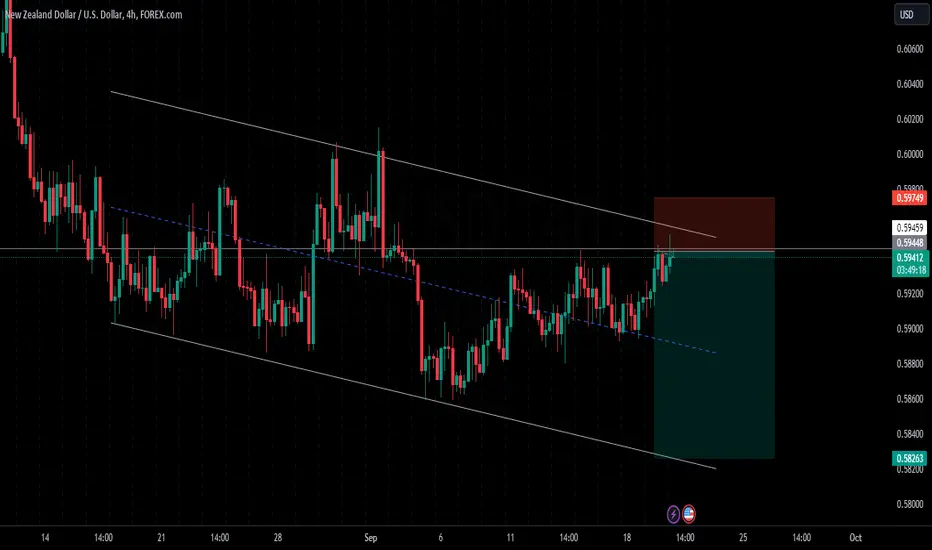
NZDUSD SHORT NOWTechnical Reasons for going SHORT is best known to BIG-FX Inner Circle.
With 4 confluences confirmed to go short on NZDUSD now.
Trade: SHORT
Entry: 0.59448
SL: 0.59749
TP: 0.58263
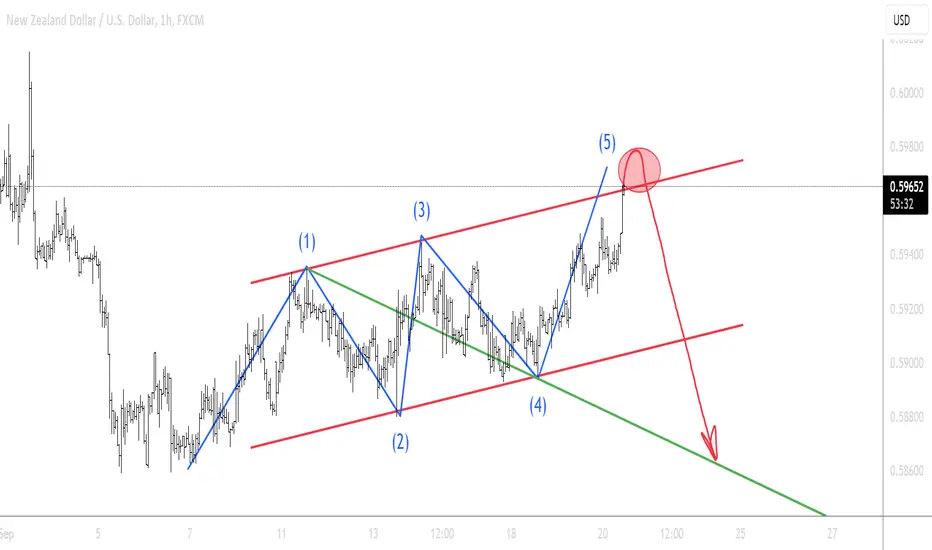
NZDUSD Bearish Wolve WaveBearish Wolfe Wave pattern on NZDUSD H1 chart, if there will be False break out on this resistance we will have strong sell signal.
NZDUSD I Potentially headed for resistance 0.6000 zoneWelcome back! Let me know your thoughts in the comments!
** NZDUSD Analysis - Listen to video!
We recommend that you keep this pair on your watchlist and enter when the entry criteria of your strategy is met.
Please support this idea with a LIKE and COMMENT if you find it useful and Click "Follow" on our profile if you'd like these trade ideas delivered straight to your email in the future.
Thanks for your continued support!

Daily Wave Rider - SELL NZDUSDNZDUSD
Channel: RED
WK Pivot: RED
AOB: 10
CON: SBB
SELL Stop: 0.5867
Stop Loss: 0.5921
TP01: 0.5813
TP02: 0.5705
DWR presents as a sell setup on 11SEP, with Channel and Pivot are red bouncing off SMA 10.
However, trade is not taken/considered as it differs from our Market Analysis Bias.
SPX500: Up
DXY: Down
OIL: Up
GOLD: Up
Reference to our WK37 analysis, we are anticipating a "Risk-On" sentiments thus will BUY AUD/NZD.

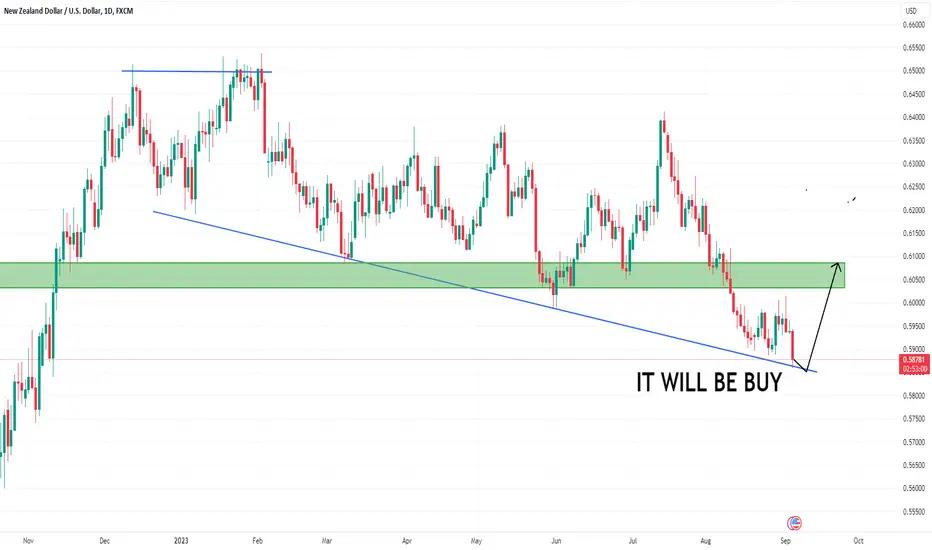
NZDUSD Long Term BUYING Trading IdeaHello Traders
In This Chart NZDUSD HOURLY Forex Forecast By FOREX PLANET
today NZDUSD analysis 👆
🟢This Chart includes_ (NZDUSD market update)
🟢What is The Next Opportunity on NZDUSD Market
🟢how to Enter to the Valid Entry With Assurance Profit
This CHART is For Trader's that Want to Improve Their Technical Analysis Skills and Their Trading By Understanding How To Analyze The Market Using Multiple Timeframes and Understanding The Bigger Picture on the Charts
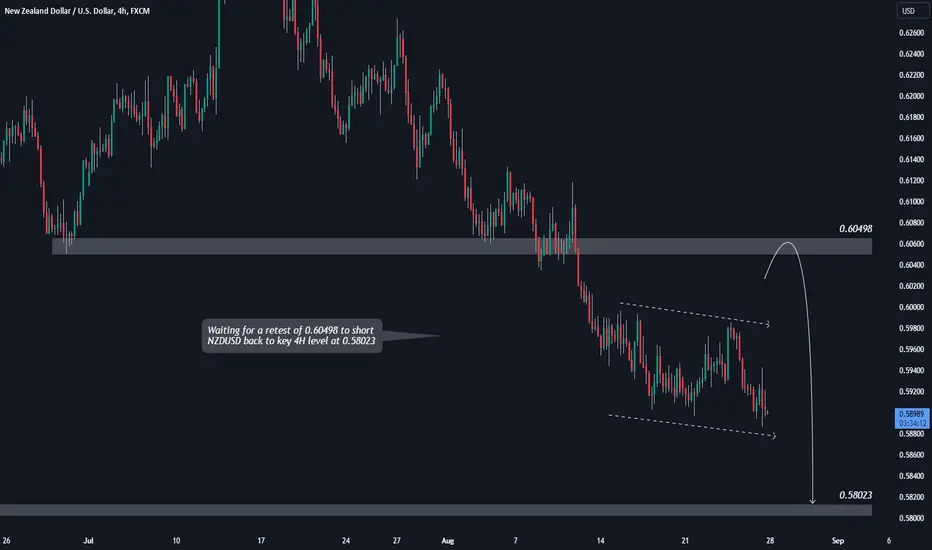
NZDUSD SHORT - MORE NZD WEAKNESS!Waiting for a retest of 0.60498 to short NZDUSD back to key 4H level at 0.58023
If you agree drop a like and if you have any questions leave a comment :)
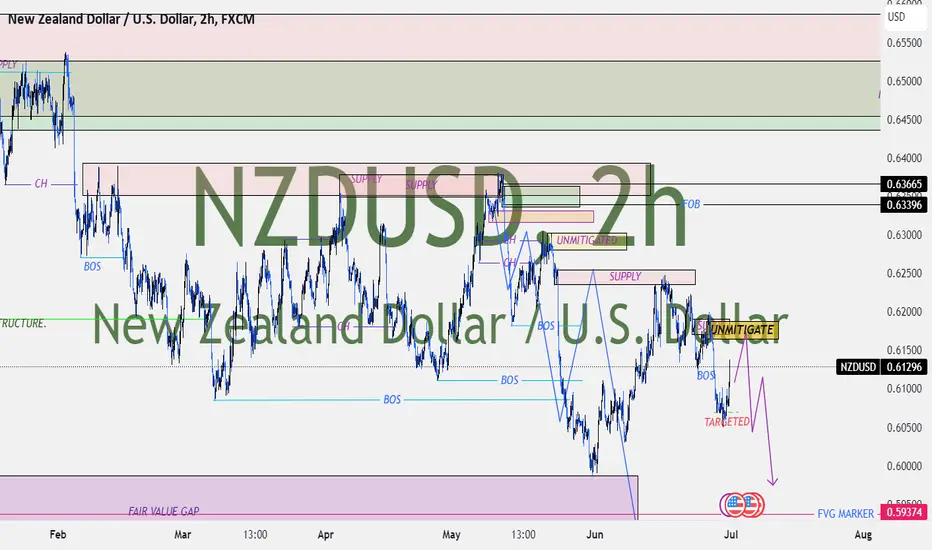
NZDUSD-SHORTThe long-term market outlook is bearish for NZDUSD. On the 4-hour chart, we have a bullish correction targeting the unmitigated supply sitting at 0.62 price handle. Our approach to this pair is to wait for a break to the downside then short it targeting the fair value gap at 0.59374 price handle.
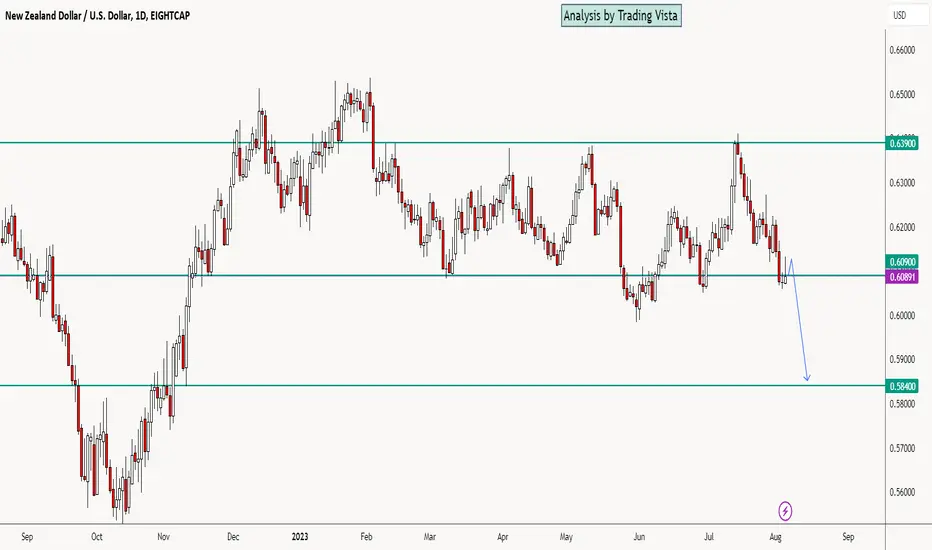
NZDUSD – bearish momentum building 07 Aug, 2023This pair has had 3 consecutive weeks of losses and in my opinion, this trend will continue during the upcoming week. Looking at recent PA, the bulls have tried to recover some ground, but these have been mostly weak moves that were quickly reversed by the bears. A similar pullback and further bearish evidence will provide another opportunity to go short.
If my expectation does come through, I will be looking at the area around 0.5840 as target.
Nothing is 100% in trading, so as always, use sound money and risk management and stay patient in all your trades. If you like my content, please give it a “thumbs up” and follow me to get even more.
What do you think about this trade idea? Please comment and share your thoughts!!
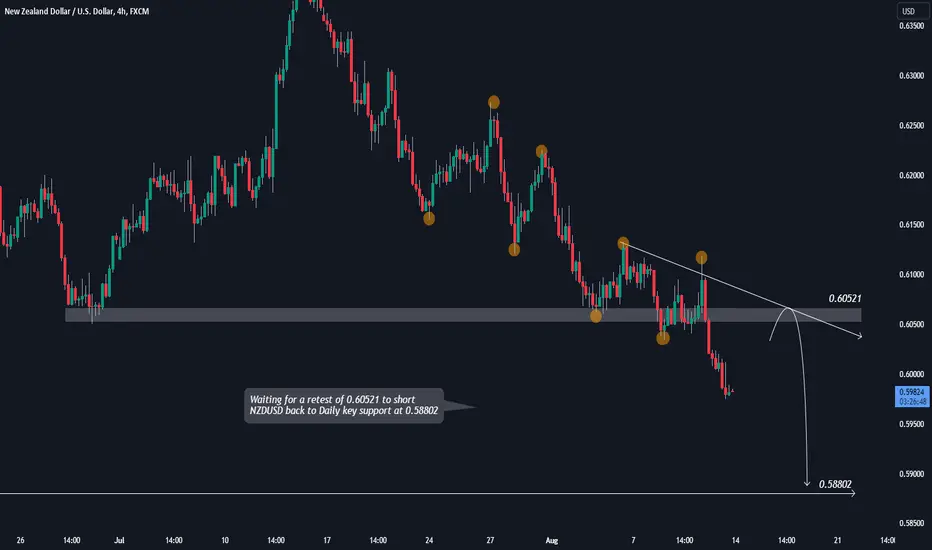
NZDUSD SHORT - STILL A LONG WAY TO GO!Waiting for a retest of 0.60521 to short NZDUSD back to Daily key support at 0.58802
If you agree drop a like and if you have any questions leave a comment :)
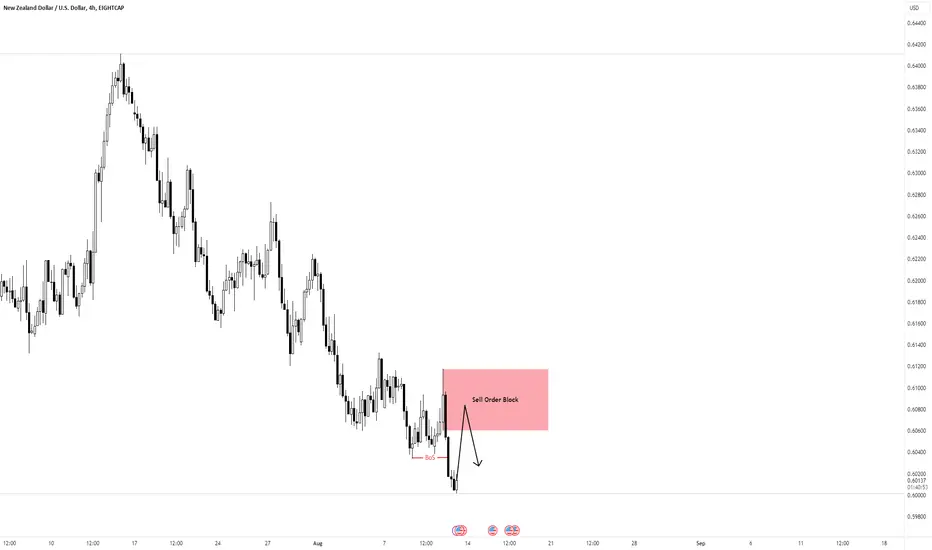
NZDUSD - Short after filling the imbalance ✅Hello traders!
‼️ This is my perspective on NZDUSD.
Technical analysis: Here we are in a strong bearish market structure from 4H timeframe perspective, so I am looking for short. I want price to make a retracement to fill the imbalance higher and then to reject from institutional mid figure 0.60500.
Like, comment and subscribe to be in touch with my content!
NZDUSD Analysis H4Here is my analysis for NZDUSD on H4 using Order Block. The price could go bearish, you can put a pending order on the Order block or find an entry on LTF within OB Zone. Trade Safe!
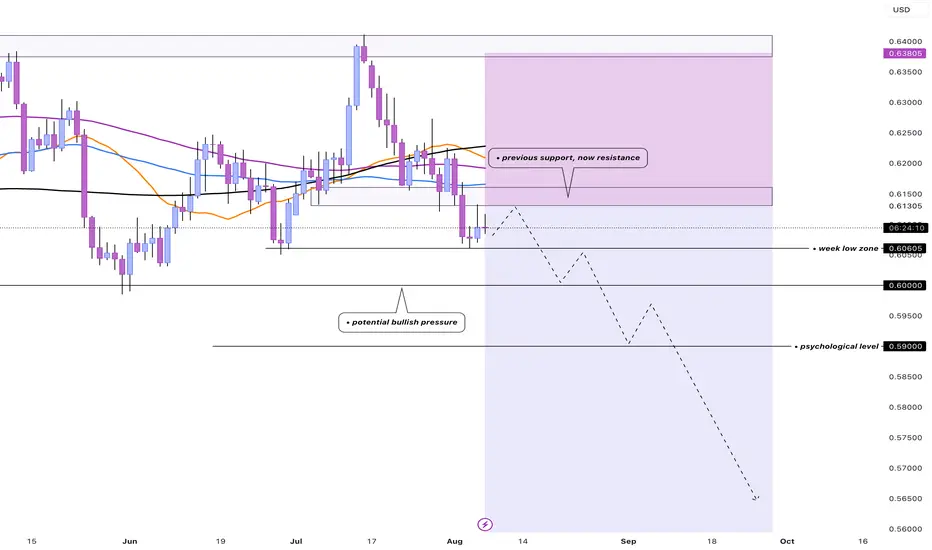
📌 Potential LONG-TERM SELL setup for: NZD/USD👩🏽💻Technical: NZDUSD is currently undergoing a pullback as it experienced a recent rejection at the 0.60605 level. The presence of multiple rejections at the monthly and weekly moving averages signals significant bearish pressure in the market. Furthermore, the breach of higher time frame support has now transformed it into a resistance level, further reinforcing the bearish sentiment.
🎯 For an ideal entry: For a strong confirmation that the push > exhaustion cycle is completed, a powerful bearish candlestick forming around the resistance zone would be highly desirable. Such a signal could serve as a compelling indication to sell, potentially driving prices back to previous lows and psychological levels.
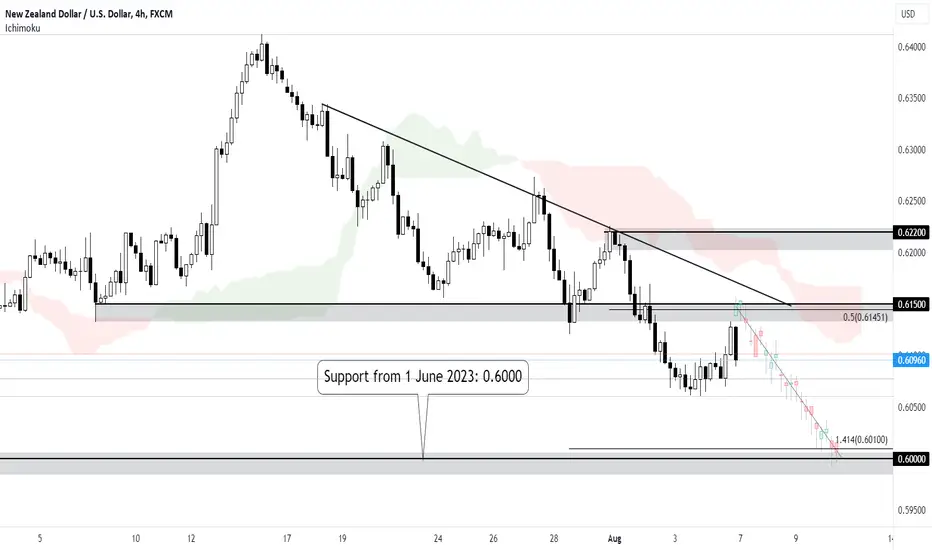
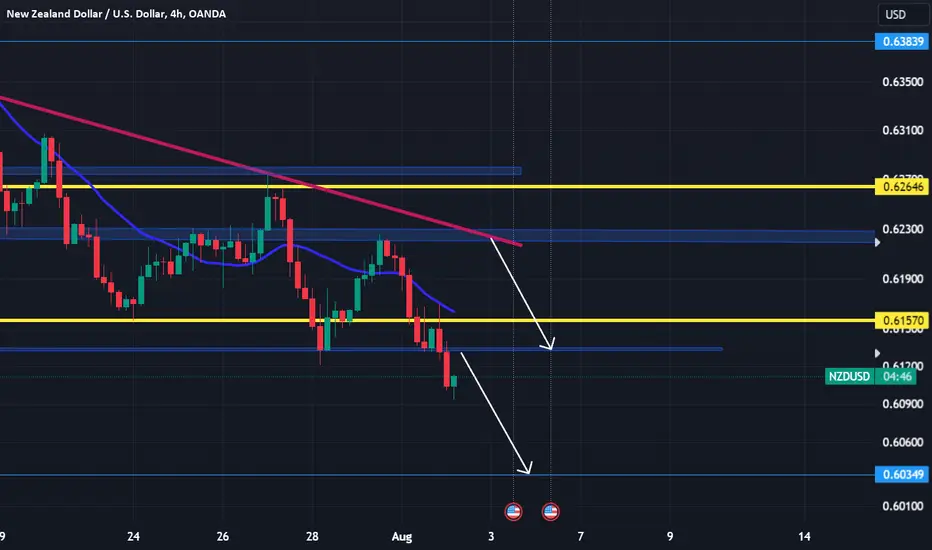
Bearish Outlook on NZDUSD - 5 AugPrice has been adhering to the observed descending trendline on the H4 timeframe. A pullback to the key resistance zone at 0.6150, which coincides with the 50% fibonacci retracement, could provide the bearish acceleration towards the next support zone at 0.6000, which is in line with the 141.4% fibonacci extension. Price is hovering below ichimoku cloud, supporting our bearish bias.
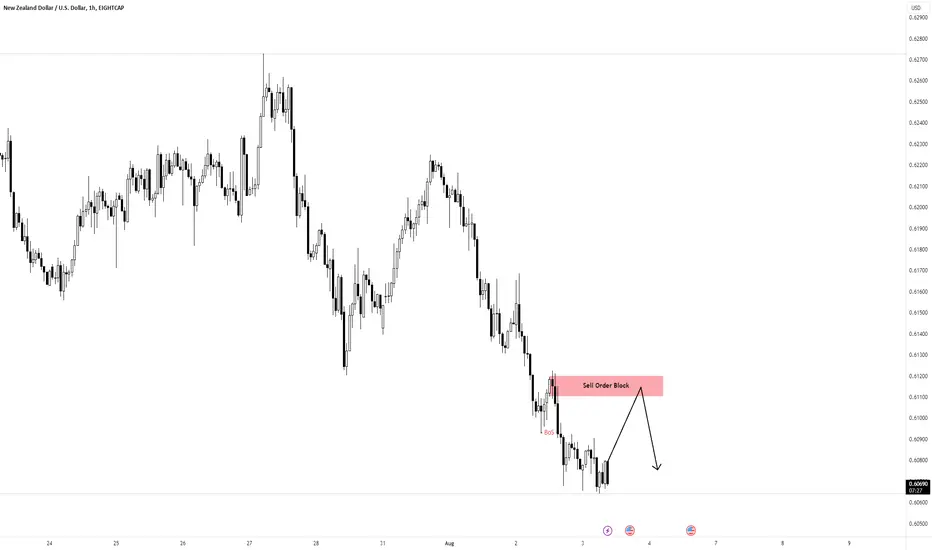
NZDUSD Analysis H1Here is my analysis for NZDUSD on H1 using Order Block. The price could go bearish, you can put a pending order on the Order block or find an entry on LTF within OB Zone. Trade Safe!
$nzdusd short trade setup.This count is based on my assumptions so anything can happen not a trading or financial advice just for educational purposes only kindly do your own ta thanks trade with care good luck.
NZDUSD ShortStill looking for shorts, looking for a pullback and rejection to 0.61338 to look for shorts following a 15m close
NZDUSD Top-down analysisHello traders, this is a complete multiple timeframe analysis of this pair. We see could find significant trading opportunities as per analysis upon price action confirmation we may take this trade. Smash the like button if you find value in this analysis and drop a comment if you have any questions or let me know which pair to cover in my next analysis.
