NZDUSD: Bearish. Clean Setup For Potential Sells!Welcome back to the Weekly Forex Forecast for the week of Sept 1 - 5th.
In this video, we will analyze the following FX market: NZDUSD
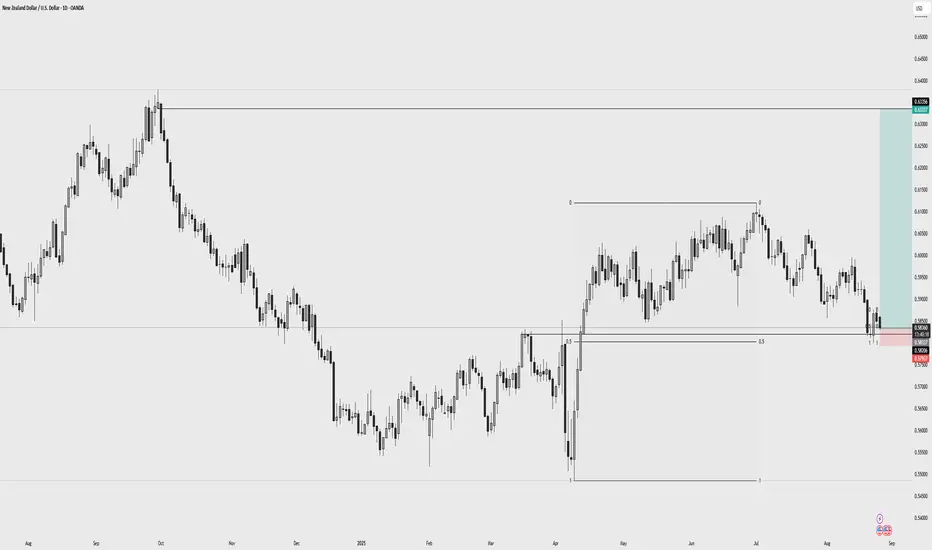
NZDUSD is currently showing the cleanest setup for the FX pairs.
- it's in a downtrend on the HTFs
- D1 shows the LH. LL, low and the -BOS clearly
- the retracement is contacting a decent -OB
- the Descending Channel is only an added bonus as a confluence for resistance.
I like the probabilities for a potential rejection downward from the -OB.
The caution here is that it would require the USD to show strength, pulling the NZD down. That part is still iffy. The DXY has not shown its hand just yet.... but it will very soon.
Enjoy!
May profits be upon you.
Leave any questions or comments in the comment section.
I appreciate any feedback from my viewers!
Like and/or subscribe if you want more accurate analysis.
Thank you so much!
Disclaimer:
I do not provide personal investment advice and I am not a qualified licensed investment advisor.
All information found here, including any ideas, opinions, views, predictions, forecasts, commentaries, suggestions, expressed or implied herein, are for informational, entertainment or educational purposes only and should not be construed as personal investment advice. While the information provided is believed to be accurate, it may include errors or inaccuracies.
I will not and cannot be held liable for any actions you take as a result of anything you read here.
Conduct your own due diligence, or consult a licensed financial advisor or broker before making any and all investment decisions. Any investments, trades, speculations, or decisions made on the basis of any information found on this channel, expressed or implied herein, are committed at your own risk, financial or otherwise.
Nzdusdtrade

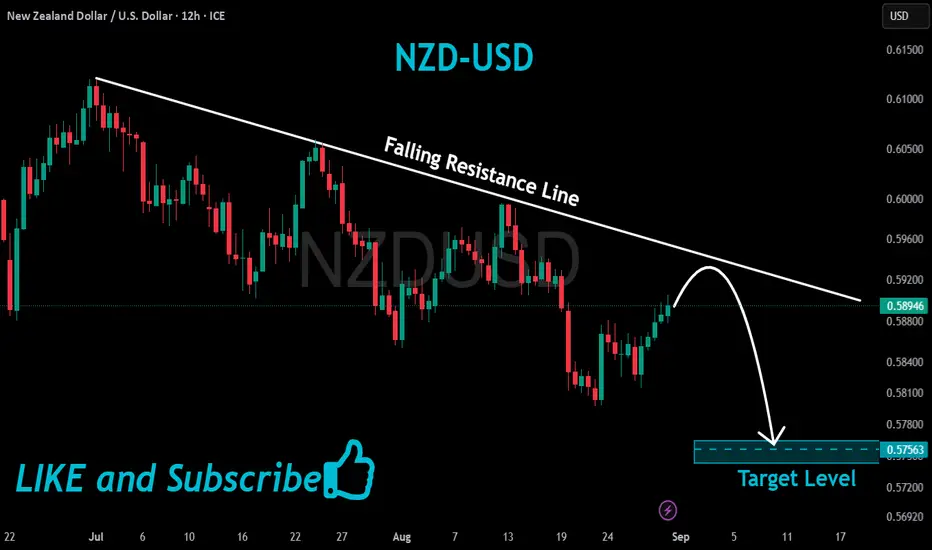
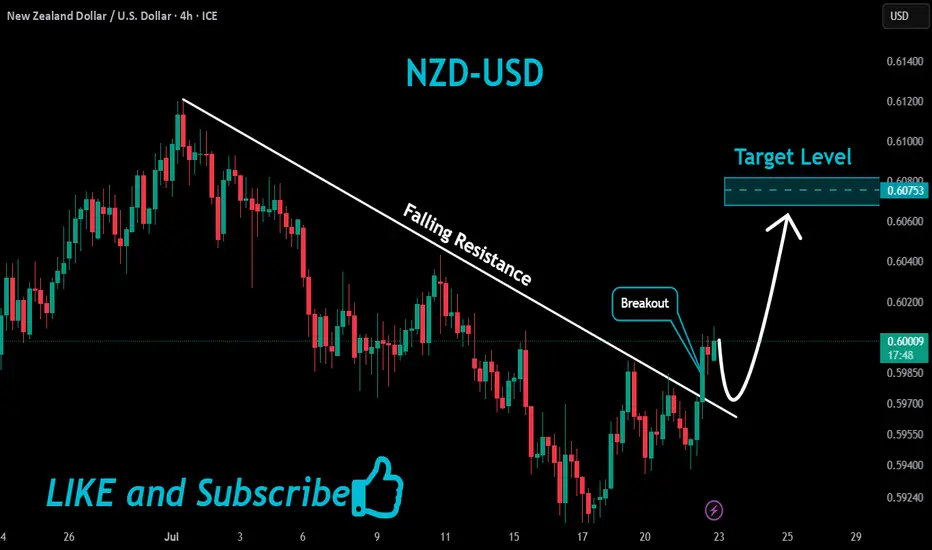
NZDUSD Move Down Ahead!
HI,Traders !
#NZDUSD is trading in a
Downtrend below the falling
Resistance line and the pair
Will soon hit the resistance
From where we will be
Expecting a further move down!
Comment and subscribe to help us grow !
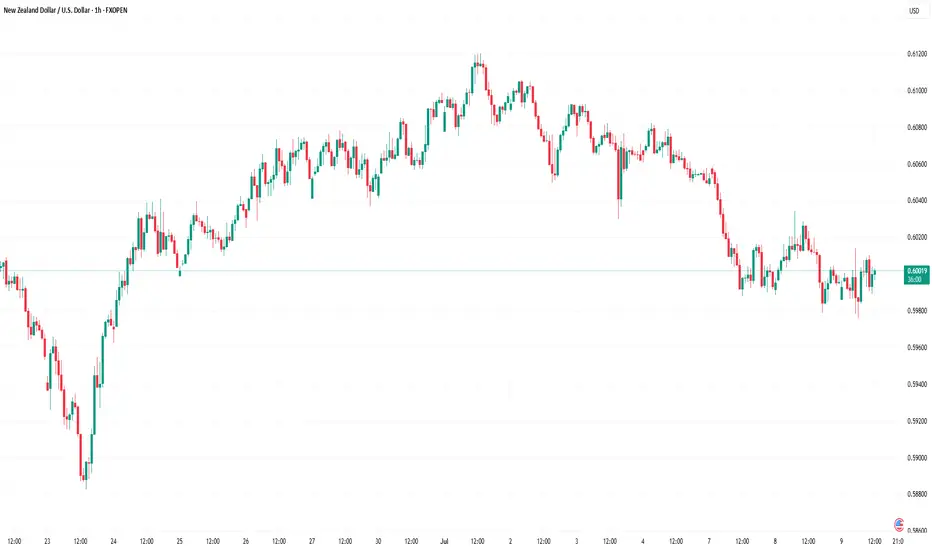
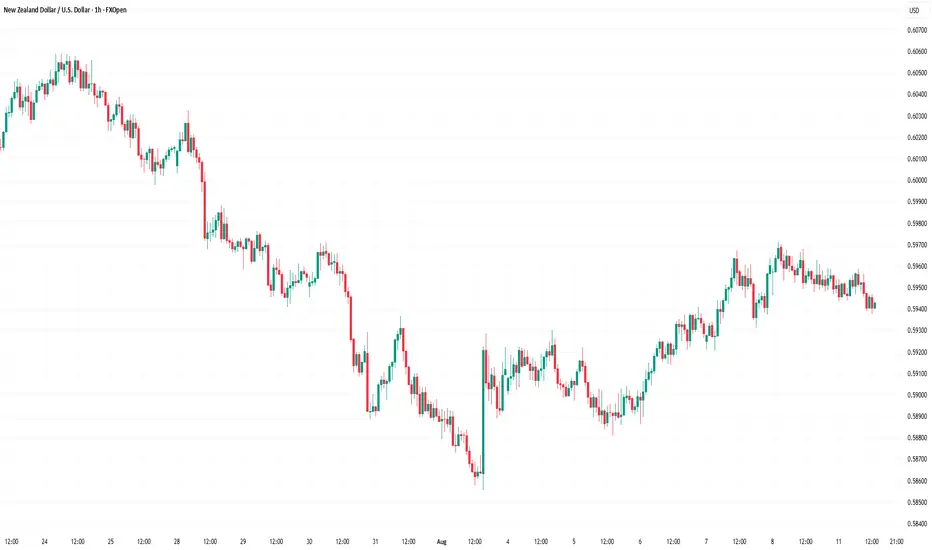
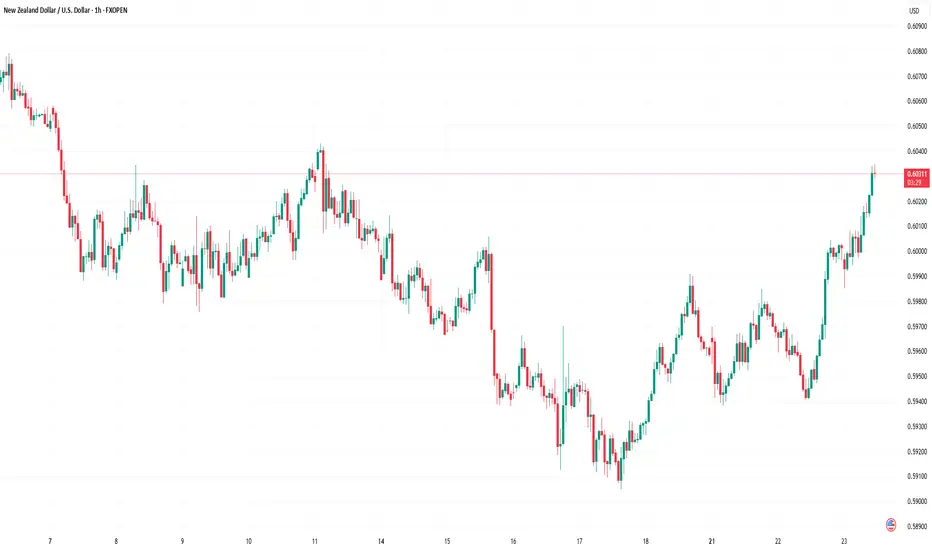
NZD/USD Rises by ~1.4% in 2 DaysNZD/USD Rises by ~1.4% in 2 Days
As the NZD/USD chart shows, the New Zealand dollar was trading around 0.5820 against the US dollar on Wednesday, but today it has climbed above 0.5895 – an impressive gain of approximately 1.4% in just two days.
The rise in NZD/USD is being driven both by the general weakening of the US dollar ahead of the Federal Reserve’s expected September rate cut, and by strengthening demand for the “kiwi”. As Reuters notes:
→ the New Zealand dollar is often used as a substitute for the yuan because of close trade relations with China;
→ meanwhile, the yuan is strengthening, with Chinese policymakers recommending support for the currency given its low valuation and the need to facilitate trade negotiations with the US.
Technical Analysis of the NZD/USD Chart
It’s worth paying attention to the unusual trading activity (marked by the arrow) and its context:
→ it was the lowest level in more than four months;
→ after a sharp decline, the price stabilised near the lower boundary of the channel;
→ trading was fairly active, and although the price was drifting lower, it failed to generate strong bearish momentum.
It is possible that so-called Smart Money was attracted by the undervalued asset, preventing further declines through buy orders and accumulating long positions. If so, from this perspective it is notable that:
→ the 0.5820 level acted as support on Wednesday – the price rebounded sharply;
→ yesterday NZD/USD moved into the upper half of the channel, breaking through the 0.5875 resistance.
This week’s price rise has formed a trajectory marked by purple lines. NZD/USD might be heading towards the upper boundary of the ascending channel, with the following resistance levels standing out along the way:
→ the former support at 0.5910;
→ the 50% Fibonacci retracement level from the A→B move.
An attempt to break through this resistance zone could result in a pullback towards the lower boundary of the purple channel.
This article represents the opinion of the Companies operating under the FXOpen brand only. It is not to be construed as an offer, solicitation, or recommendation with respect to products and services provided by the Companies operating under the FXOpen brand, nor is it to be considered financial advice.
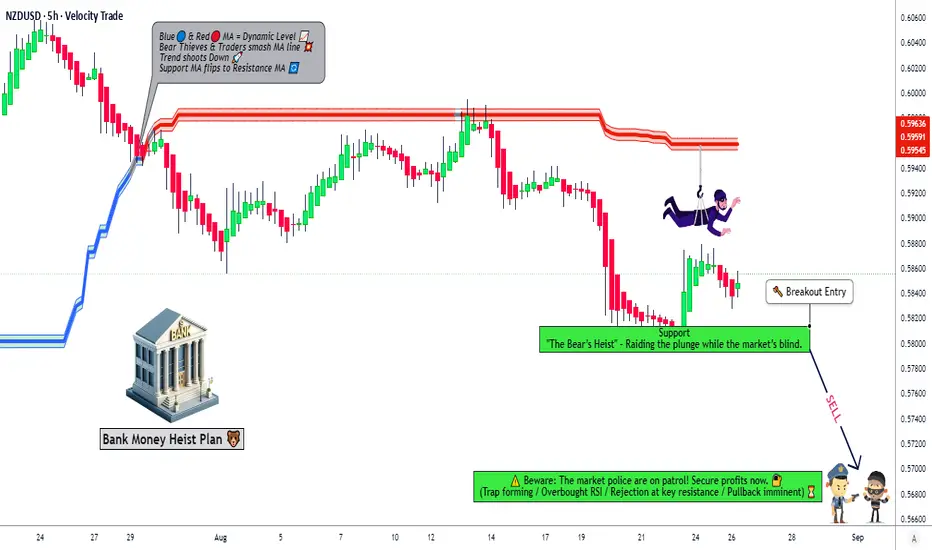
NZD/USD The Kiwi Heist Plan – Breakout or Bust?🦘 NZD/USD "The Kiwi" Forex Bank Heist Plan (Swing/Day Trade) 🦘
🎯 MISSION: BEARISH (PENDING ORDER HEIST) 🎯
📍 THE ENTRY PLAN: THE BREAKOUT TRIGGER
⚡ MAIN ENTRY SIGNAL: Wait for the BREAKOUT & CLOSE below 0.58000! This is when the bank vault door gets cracked! ⚡
🧨 THIEF'S LAYERED ENTRY STRATEGY: Don't go all in! We use multiple SELL LIMIT orders to scale in like a pro. After the breakout, set your heist layers at:
1st Layer (Safe Loot): 0.58100
2nd Layer (Main Loot): 0.58200
3rd Layer (Ballsy Loot): 0.58400
🤑 You can add more layers based on your own risk appetite! This is the thief's way (DCA/Layering).
🛑 THE ESCAPE ROUTE: STOP LOSS
👮♂️ THIEF OG's STOP LOSS: Our getaway car is parked at 0.58800. Place your SL ONLY AFTER the 0.58000 breakout is confirmed!
📢 Attention all Thieves & Robbers: Adjust your final SL based on your own risk management, lot size, and how many layers you used! Protect your capital! 👊
💰 THE FINAL TARGET: CASH OUT & ESCAPE
🚨 Police Barricade Ahead! Don't get greedy! The mission is to escape with the stolen money at 0.57000! 🚨
🔊 THIEF'S LOOTING MANUAL (READ THIS!):
🚨 Set a CHART ALERT at 0.58000! Don't miss the heist signal!
📰 NEWS = POLICE PATROLS! Avoid opening new trades during high-impact news. It increases volatility and risk!
🔐 Manage Your Position! This is your key to survival. Use proper risk/reward ratios.
💖 SUPPORT THE HEIST CREW!
💥 SMASH THAT LIKE & BOOST BUTTON! 💥
It fuels our next robbery plan! Let's make stealing money from the market look EASY! 🤑🚀
I'll see you on the next heist, Thief! Stay sharp! 🐱👤🤝
NZDUSD LONGI enetered Long position on NZDUSD based on fundamentals and technical analysis.
Entry 0.58337
SL 0.57937
TP: 0.63337
Market Analysis: NZD/USD Starts Recovery, Key Hurdles AheadMarket Analysis: NZD/USD Starts Recovery, Key Hurdles Ahead
NZD/USD is also rising and could aim for a move above 0.5900 in the short term.
Important Takeaways for NZD/USD Analysis Today
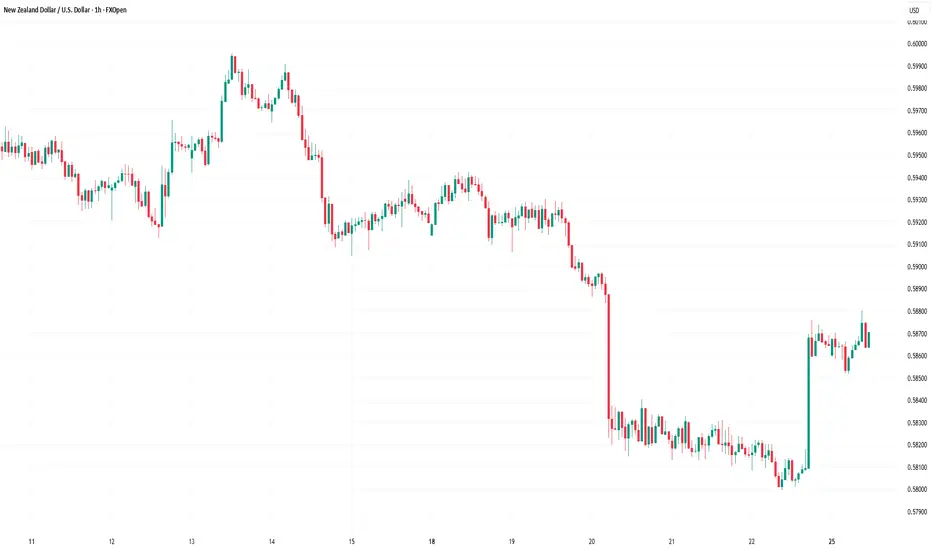
- NZD/USD is slowly moving higher above 0.5830.
- There is a major bearish trend line forming with resistance at 0.5870 on the hourly chart of NZD/USD.
NZD/USD Technical Analysis
On the hourly chart of NZD/USD, the pair followed AUD/USD. The New Zealand Dollar formed a base above the 0.5800 level and started a recovery wave against the US Dollar.
The pair climbed above the 50-hour simple moving average and 0.5830. There was a close above the 23.6% Fib retracement level of the downward move from the 0.5990 swing high to the 0.5830 low.
However, the bears are now active near the 0.5870 zone and a major bearish trend line. The NZD/USD chart suggests that the RSI is back above 60, signaling a positive bias. On the upside, the pair is facing resistance near 0.5870.
The next major hurdle for buyers could be near the 50% Fib retracement at 0.5895. A clear move above 0.5895 might even push the pair toward 0.5910. Any more gains might clear the path for a move toward the 0.5945 pivot zone in the coming sessions.
On the downside, there is support forming near the 0.5830 zone. If there is a downside break below 0.5830, the pair might slide toward 0.5800. Any more losses could lead NZD/USD into a bearish zone to 0.5740.
This article represents the opinion of the Companies operating under the FXOpen brand only. It is not to be construed as an offer, solicitation, or recommendation with respect to products and services provided by the Companies operating under the FXOpen brand, nor is it to be considered financial advice.
NZD/USD Holds Near Four-Month LowNZD/USD Holds Near Four-Month Low
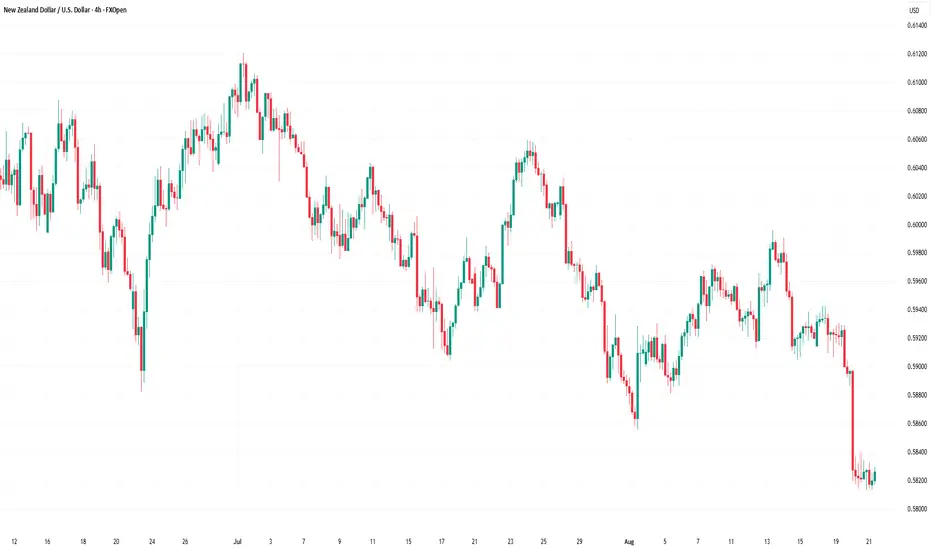
As today’s NZD/USD chart shows, the pair is trading near a four-month low following a sharp decline. The drop occurred yesterday after the Reserve Bank of New Zealand cut the official cash rate by 25 basis points to a three-year low of 3.0% and indicated that the rate could fall further to 2.55% by May 2026.
According to Trading Economics:
- Analysts now expect at least two additional rate cuts before the end of the year;
- There is a risk of deeper cuts depending on incoming economic data.
New Zealand’s exports are also under pressure, particularly due to the 15% US tariffs that came into effect earlier this month, threatening to undermine the country’s competitiveness in key markets. According to Reuters, Citi analysts expect GDP to contract in the second quarter, raising the risk of a recession in New Zealand.
Technical Analysis of the NZD/USD 4-Hour Chart
NZD/USD price action since early July has formed a downward channel (marked in red), reflecting a bearish outlook. Key observations:
→ Yesterday’s drop was sharp, with a very long candle closing near its lows – a bearish signal;
→ However, the lower boundary of the channel acted as strong support, holding back further pressure.
Looking at the broader context:
→ The B→C recovery reached approximately the 0.618 Fibonacci retracement level after the A→B impulse;
→ The D→E rebound from the channel’s median was modest, signalling weak demand.
Given the strength of the channel’s lower boundary and the oversold condition (as shown by the RSI), bulls have some grounds to expect a potential rebound. In that case, NZD/USD could face resistance from the QL line, which divides the descending channel into two quarters.
Reaching the resistance zone formed by the channel median and the 0.589 level (previously acted as support during the inverse head and shoulders pattern - highlighted with arrows) could be difficult in the near term under current conditions.
This article represents the opinion of the Companies operating under the FXOpen brand only. It is not to be construed as an offer, solicitation, or recommendation with respect to products and services provided by the Companies operating under the FXOpen brand, nor is it to be considered financial advice.
NZDUSD Long From Support!
HI,Traders !
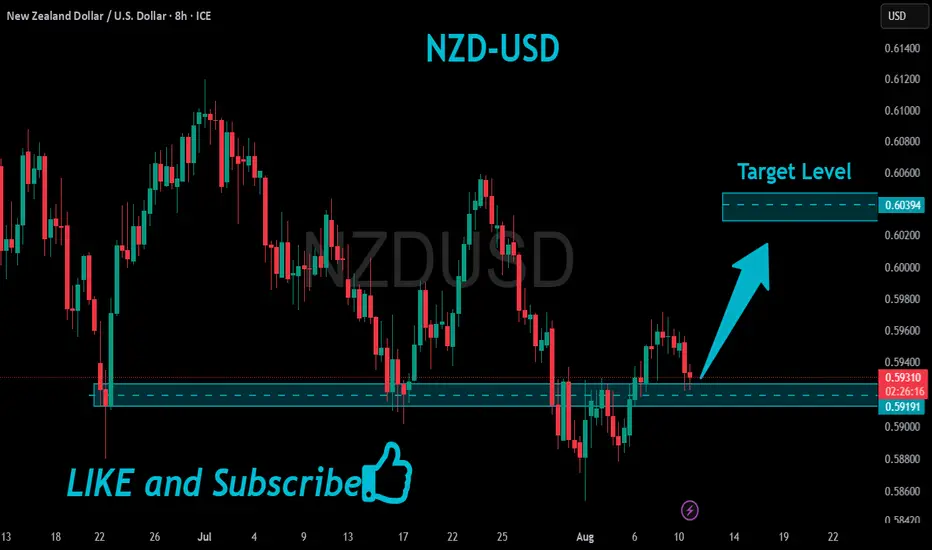
#NZDUSD fell down again
But a strong horizontal
Support level is close by
At 0.59191 so after the
Pair retests the support
we will be Expecting a local
Bullish correction !
Comment and subscribe to help us grow !
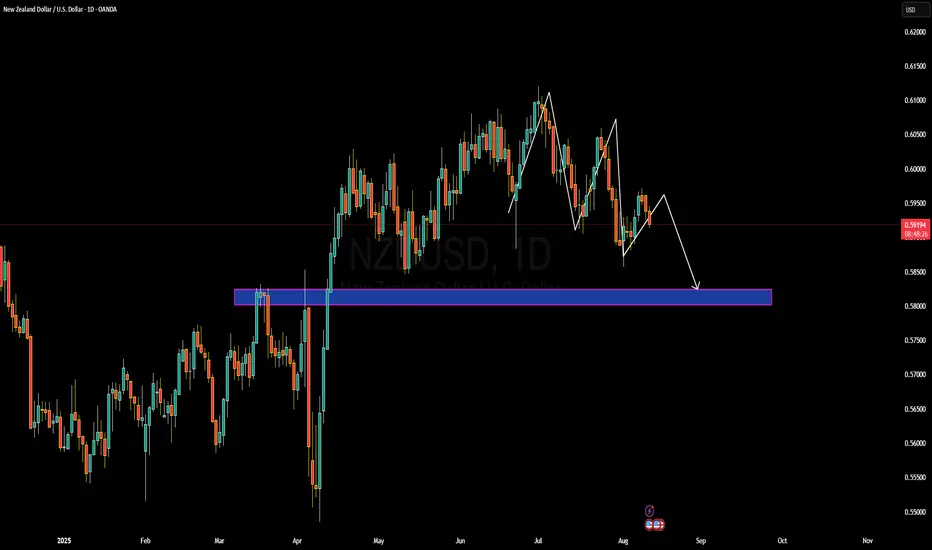
NZDUSD Forming Bearish ContinuationNZDUSD is carving out what appears to be a bearish continuation setup on the daily chart. The pair is forming lower highs and lower lows, guided by a clear corrective structure. As price breaks below the mini-leg retracement and edges lower, it suggests a potential slide toward the larger support zone around 0.5800–0.5820—an area that previously held as resistance and now flips to demand.
On the fundamentals front, the spotlight is on an increasingly dovish Reserve Bank of New Zealand. Inflation has remained within the RBNZ’s target band, with annual CPI rising just to 2.7%—slightly below forecasts—while labor data shows the unemployment rate creeping up to 5.2%, and labor force participation dipping to multi-year lows. Markets are now pricing in an 88% probability of another rate cut in August, Further weighting the scales against the kiwi.
Political and economic headwinds also cast a shadow over the NZD. The housing market is under pressure; prices are retracing sharply, rents are falling, and migration is declining. While the government is pushing fiscal stimulus via infrastructure spending, the momentum remains fragile—and it adds to bearish pressure on NZD.
Technically, this setup offers a defined structure and clean risk-to-reward. A violation below the last swing low around 0.5930 opens the path to 0.5800–0.5820. If that level gives way, the next logical target lies closer to 0.5700. For now, traders should be watching for confluence near 0.5950 for potential entry, aiming lower with stops tight above recent swing highs.
Market Analysis: NZD/USD Much Higher—Uptrend Shows StrengthMarket Analysis: NZD/USD Much Higher—Uptrend Shows Strength
NZD/USD is also rising and might aim for more gains above 0.5970.
Important Takeaways for NZD/USD Analysis Today
- NZD/USD is consolidating gains above the 0.5940 zone.
- There is a short-term declining channel forming with resistance at 0.5960 on the hourly chart of NZD/USD.
NZD/USD Technical Analysis
On the hourly chart of NZD/USD on FXOpen, the pair started a steady increase from the 0.5880 zone. The New Zealand Dollar broke the 0.5925 resistance to start the recent increase against the US Dollar.
The pair settled above 0.5940 and the 50-hour simple moving average. It tested the 0.5970 zone and is currently consolidating gains. There was a move below the 23.6% Fib retracement level of the upward move from the 0.5881 swing low to the 0.5971 high.
The NZD/USD chart suggests that the RSI is stable above 50. On the upside, the pair might struggle near 0.5960. There is also a short-term declining channel forming with resistance at 0.5960.
The next major resistance is near the 0.5970 level. A clear move above the 0.5970 level might even push the pair toward the 0.6000 level. Any more gains might clear the path for a move toward the 0.6020 resistance zone in the coming days.
On the downside, immediate support is near the 0.5940 level. The first key support is near the 0.5925 level. It is close to the 50% Fib retracement level of the upward move from the 0.5881 swing low to the 0.5971 high.
The next major support is near the 0.5900 level. If there is a downside break below it, the pair might slide toward 0.5880. Any more losses could lead NZD/USD to 0.5820.
This article represents the opinion of the Companies operating under the FXOpen brand only. It is not to be construed as an offer, solicitation, or recommendation with respect to products and services provided by the Companies operating under the FXOpen brand, nor is it to be considered financial advice.
Ready to Rob the Kiwi? NZD/USD Bullish Breakout Plan🥝💚 NZD/USD Bullish Breakout Heist Plan 🟢💰 (Thief Trader Style)
🎭 Robbery Mission Activated – Code: Kiwi Uprising 💣📈
💥 Asset: NZD/USD
📍 Entry: 0.59400 (Breakout confirmed – the vault door’s open!)
🔐 Stop Loss: 0.58300 (Thief exit point – avoid the trap zone)
🎯 Target: 0.60500 (Cash-out point – grab the bags and vanish!)
🧠 Strategy: Layered Limit Orders a.k.a “Precision DCA Infiltration”
🧤 The Thief Trader is sneaking into the forex vaults once again — this time with eyes locked on Kiwi (NZD/USD). The bulls are loading up, and the breakout zone is showing green flags 🟢 — time to strike hard and clean 💰
🔥 Operation Details:
We’re stacking multiple limit orders like a pro thief would place decoys – distraction + precision = execution! Entry at 0.59400 is our main gate breach. Orders set in layers to trap liquidity zones below.
🚨 Stop Loss @ 0.58300 – tight enough to avoid getting caught, but wide enough to dodge fake traps.
🏆 Target: 0.60500 – that’s where the loot vault is sitting. Clean exit once we’re loaded with profits!
👀 Swingers & Scalpers Alert!
Only look LONG – no short robbing here!
🔁 Use trailing SL once in profit – protect your gold like a pro.
💡If cash is low – no panic, join the swing gang and glide in with patience & alerts. Smart robbers wait 🧠💼
📣 News Risk ⚠️
Avoid jumping during major news blast-offs.
Lock profits with trailing SL.
No panic entries — only sniper moves.🕵️♂️💥
❤️ Smash That BOOST Button 💥💪
Support the squad! More boosts = more heist plans, more clean money from the market streets 🚀📈
🎭 Stay sharp, rob smart — see you in the next plan, robbers 🤑🐱👤🎯
~ Thief Trader

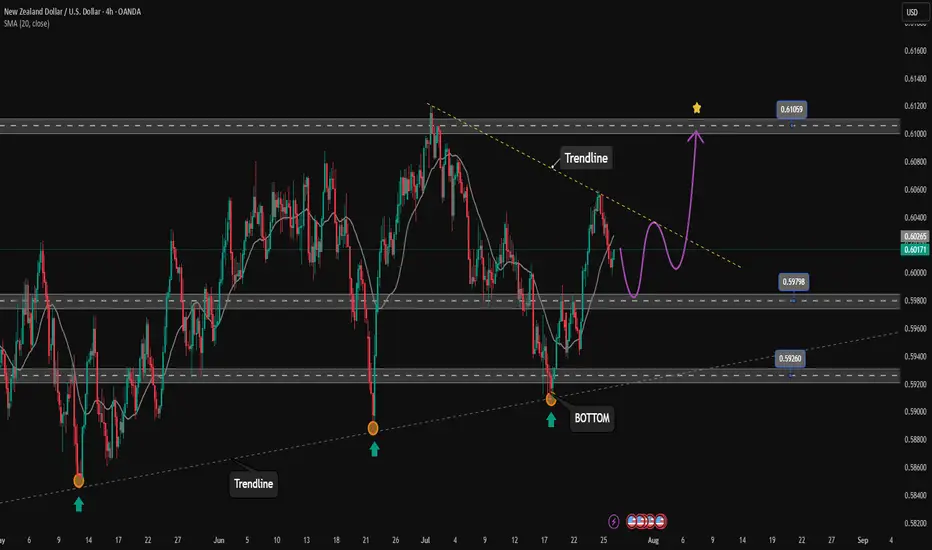
Price is heading towards the upper boundary of the price channel✏️ OANDA:NZDUSD is trading in a bullish wave on H4 chart towards the upper boundary of the ascending price channel. The trendline reaction to the support zone of 0.598 will form a nice corrective wave for the uptrend. If the nearest trendline is broken, the price will soon reach our take profit zone.
📉 Key Levels
Buy trigger: Reject and Trading above 0.598
BUY zone 0.592 ( vùng hỗ trợ biên dưới)
Target: 0.610
Leave your comments on the idea. I am happy to read your views.
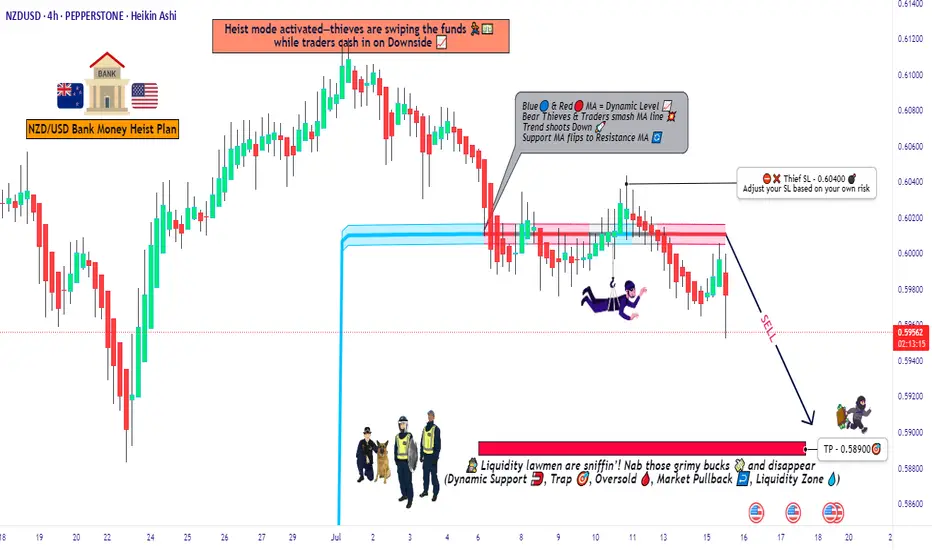
NZD/USD "KIWI HEIST" – BEARISH BANK ROBBERY!🦹♂️ NZD/USD "THE KIWI HEIST" – BEARISH BANK ROBBERY PLAN! 🚨💰
(Thief Trading Style – Short Entry Strategy for Maximum Loot!)
🎯 MASTER TRADING HEIST BLUEPRINT
🔥 Thief’s Technical & Fundamental Analysis Confirms:
NZD/USD is OVERBOUGHT + TREND REVERSAL!
Police (Bulls) set a TRAP near the Red Zone (Support) – Time to ESCAPE with profits before they catch us!
✔ Entry Point (Bearish Loot Grab):
*"The vault is UNLOCKED! Swipe SHORT anywhere – but for SAFER HEIST, use Sell Limit orders (15m/30m pullbacks). Pro Thieves use DCA/Layering for max gains!"*
✔ Stop Loss (Escape Route):
"SL at nearest 4H Swing High (0.60400). Adjust based on YOUR risk tolerance & loot size!"
✔ Target 🎯 (Profit Escape):
0.58900 (or exit earlier if cops (bulls) show up!)
⚠️ THIEF’S WARNING – NEWS & RISK MANAGEMENT
📢 High-Impact News = VOLATILITY TRAP!
Avoid new trades during news releases.
Trailing SL = Lock profits & evade market cops!
💥 SCALPERS & SWING THIEVES – QUICK NOTES:
Scalpers: Only quick LONG scalp plays (use Trailing SL!).
Swing Thieves: Hold for the BIG BEARISH LOOT! 🏦
📉 WHY NZD/USD IS BEARISH? (Thief’s Intel Report)
Overbought + Trend Reversal Signals!
Bulls (Police) losing strength at Resistance!
For FULL Intel (Fundamentals, COT Report, Sentiment, etc.) – Klickk 🔗!
🚀 BOOST THIS HEIST! (Like & Share for More Loot Plans!)
💖 "Hit 👍 BOOST to strengthen our THIEF SQUAD! More heists = More profits!"
📌 DISCLAIMER (Stay Safe, Thieves!):
This is NOT financial advice. Trade at your own risk & manage positions wisely!
🤑 NEXT HEIST COMING SOON… STAY TUNED! 🎭
NZD/USD – A Bullish Opportunity You Shouldn't MissNZD/USD is showing a clear bullish structure across multiple timeframes:
Weekly: Overall trend remains bullish.
Daily: Structure flipped bullish on July 23, 2025, confirmed by a strong bullish engulfing candle.
4H: Also aligned bullish, adding further confluence.
We are now anticipating a retest near the previous Daily Higher Low (HL) — likely around a round psychological level. This zone may offer a textbook HL formation and a high-probability long setup.
📍 Potential Trade Plan
Entry: Around 0.6000
Take Profit: 0.6160
Stop Loss: 0.5960
⚠️ This is not financial advice. Please do your own research and analysis before entering any trade. I am not responsible for any potential losses.

NZDUSD Massive Bullish Breakout!
HI,Traders !
#NZDUSD is trading in a strong
Uptrend and the price just
Made a massive bullish
Breakout of the falling
Resistance line and the
Breakout is confirmed
So after a potential pullback
We will be expecting a
Further bullish continuation !
Comment and subscribe to help us grow !
Market Analysis: NZD/USD Climbs as Dollar WeakensMarket Analysis: NZD/USD Climbs as Dollar Weakens
NZD/USD is also rising and might aim for more gains above 0.6000.
Important Takeaways for NZD/USD Analysis Today
- NZD/USD is consolidating gains above the 0.5980 zone.
- There was a break above a major bearish trend line with resistance at 0.5980 on the hourly chart of NZD/USD.
NZD/USD Technical Analysis
On the hourly chart of NZD/USD at FXOpen, the pair started a steady increase from the 0.5910 zone. The New Zealand Dollar broke the 0.5940 resistance to start the recent increase against the US Dollar.
There was a break above a major bearish trend line with resistance at 0.5980. The pair settled above 0.5980 and the 50-hour simple moving average. It tested the 0.6010 zone and is currently consolidating gains.
The NZD/USD chart suggests that the RSI is stable above 60. On the upside, the pair might struggle near 0.6010. The next major resistance is near the 0.6020 level.
A clear move above the 0.6020 level might even push the pair toward the 0.6050 level. Any more gains might clear the path for a move toward the 0.6120 resistance zone in the coming days.
On the downside, immediate support is near the 0.5990 level. It is close to the 23.6% Fib retracement level of the upward move from the 0.5941 swing low to the 0.6008 high.
The first key support is near the 0.5975 level. It is close to the 50% Fib retracement level. The next major support is near the 0.5940 level. If there is a downside break below the 0.5940 support, the pair might slide toward 0.5910. Any more losses could lead NZD/USD in a bearish zone to 0.5850.
This article represents the opinion of the Companies operating under the FXOpen brand only. It is not to be construed as an offer, solicitation, or recommendation with respect to products and services provided by the Companies operating under the FXOpen brand, nor is it to be considered financial advice.
NZDUSD Sell Stop SetupNZDUSD is in a clear downtrend, forming lower highs and lower lows. A sell stop is placed below the recent support to confirm bearish continuation.
Sell Stop: 0.59
Stop Loss (SL): 0.60
Take Profit 1 (TP1): 0.58
Take Profit 2 (TP2): 0.57
Waiting for price activation to validate the setup.

NZDUSD SELLBy utilizing levels, historical patterns, we can formulate a hypothesis that the market might follow a similar trajectory if bearish sentiment prevails.

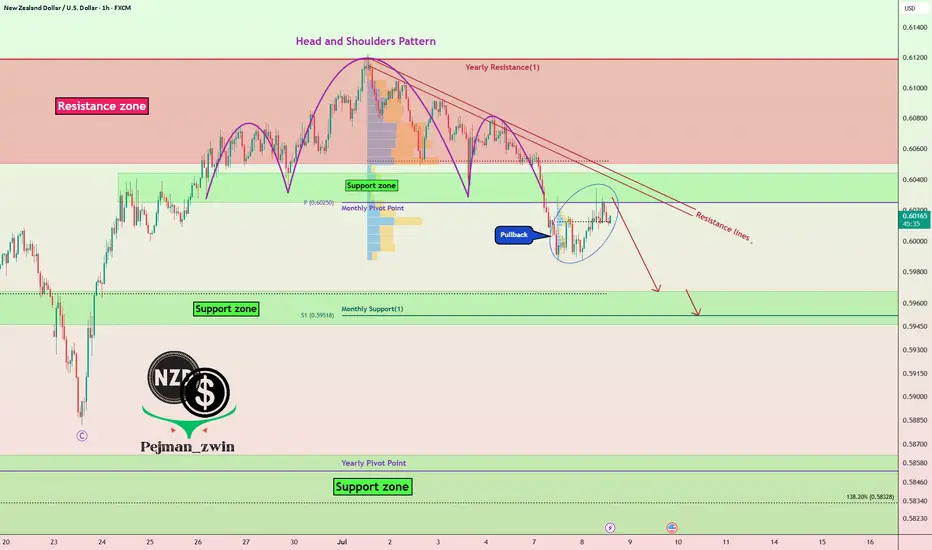
NZDUSD Pullback in Play – Head & Shoulders Signals More DownsideNZDUSD ( OANDA:NZDUSD ) is currently trading near the Resistance zone($0.612-$0.605) and has also managed to break the Support zone($0.604-$0.602) . We consider the Support zone as the neckline of the Head and Shoulders Pattern .
In terms of classic technical analysis , NZDUSD has managed to form a Head and Shoulders Pattern .
I expect NZDUSD to decline towards the Support zone($0.5968-$0.5946) after completing the pullback .
Note: Stop Loss(SL): $0.6062
Please respect each other's ideas and express them politely if you agree or disagree.
New Zealand Dollar/ U.S. Dollar Analyze (NZDUSD), 1-hour time frame.
Be sure to follow the updated ideas.
Do not forget to put a Stop loss for your positions (For every position you want to open).
Please follow your strategy and updates; this is just my Idea, and I will gladly see your ideas in this post.
Please do not forget the ✅' like '✅ button 🙏😊 & Share it with your friends; thanks, and Trade safe.
"Vault Breached! NZD/USD Bullish Loot (Live Heist)"🚨 "THE KIWI BANK HEIST" 🏦💰
NZD/USD Bullish Raid – Loot Fast Before the Cops Arrive!
🌟 Greetings, Money Bandits! 🌟 (Hola! Bonjour! Ciao! Konnichiwa!)
🔥 Thief Trading Intel:
The Vault is Open! 🏦➡️📈 – Price is bullish, but overbought.
Red Zone = Police Trap! 🚨 (Resistance/Reversal Risk)
Escape Plan: Take profits near 0.62400 (or bail early if traps trigger).
🔐 ENTRY: "BREAK IN NOW!"
"Buy the dip!" – Use 15M/30M swing lows for stealthy entries.
Set Alerts! ⏰ (Don’t miss the heist!)
🛑 STOP-LOSS: "THIEF’S SAFETY NET"
"Hide at 0.59500 (4H Swing Low)" – Adjust based on your loot size!
🎯 TARGET: "GRAB & VANISH!"
"0.62400 or escape earlier!" – Don’t get greedy; cops (bears) are lurking.
⚡ SCALPERS’ NOTE:
"Only steal LONG!" – Use trailing SL to protect your bag.
"Rich? Charge in! Poor? Wait for swings!"
📡 FUNDAMENTAL BACKUP:
"Kiwi is bullish… but check the news!" 📰 (COT, Macro Data, Sentiment)
⚠️ ALERT: Avoid trading during high-impact news – cops (volatility) love chaos!
💥 BOOST THIS HEIST! (Like & Share = More Loot!)
🚀 "Support the crew! Hit 👍, and let’s rob this market blind!" 💸🤝
Next heist coming soon… Stay tuned, bandits! 🏴☠️🎭
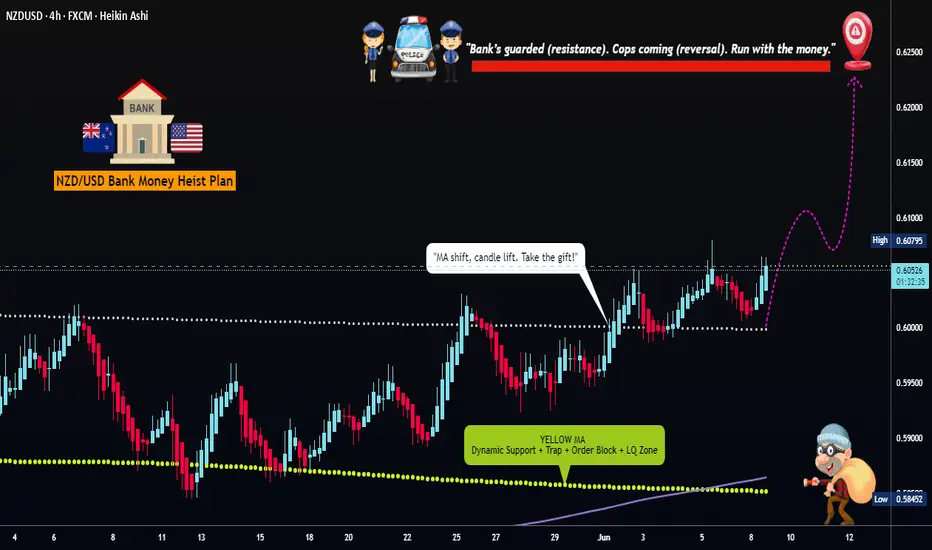
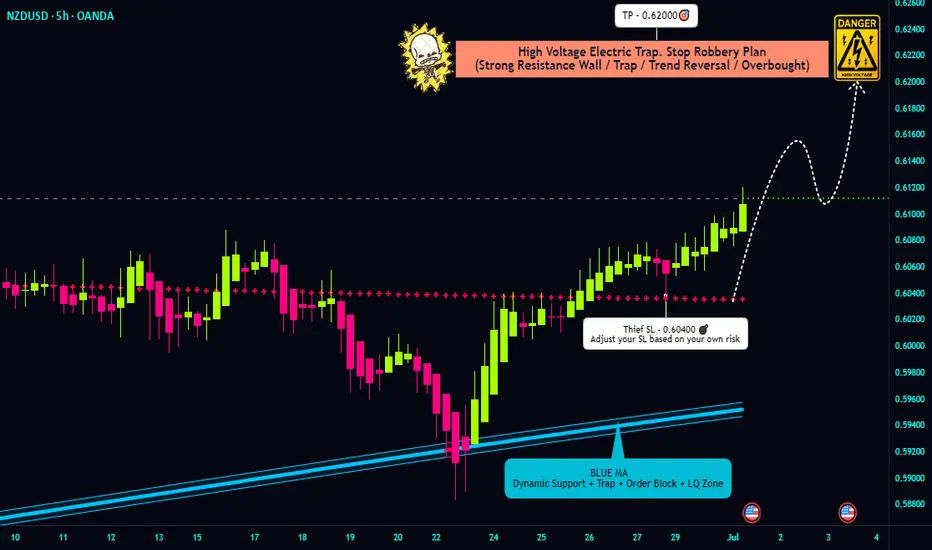
"NZD/USD Bullish Heist! Steal Pips Before the Reversal Trap! 🏴☠️ NZD/USD Kiwi Heist Masterplan – Steal the Bull Run! 💰
🌟 Hola, Money Makers & Market Marauders! 🌟
Welcome to the Thief Trading Style raid on the NZD/USD "The Kiwi" Forex vault. Follow the blueprint sketched in the chart for a bold long takeover — escape the high‑risk Yellow MA Zone before guards tighten!
🎯 Heist Blueprint
1. Entry 🚀
"The vault swings wide—yank that Bull loot at any price!"
Drop your buy-limit orders within the next 15–30 min (or at the latest swing low/high). Don’t sleep—set chart alerts for the perfect breach.
2. Stop‑Loss 🛑
Thief-style SL lurks at the nearest 5h swing‑low wick (≈ 0.60400) for intra‑day.
Adjust your SL based on your risk appetite, position size, and combo of orders.
3. Target 🎯
Aim to escape by 0.62000, or bail early for safety.
4. Scalpers’ Edge 🔍
Only rob on the long side. Big bankroll? Go all‑in. Prefer safety? Slide into the swing crew with a trailing SL to lock in your spoils.
🔍 Market Intel
Why the Kiwi Loot is Ripe:
Bullish momentum marches on, fueled by macroeconomic clues, COT data, sentiment shifts, inter-market moves — all pointing upward.
📚 For Full Recon:
Dive into the fundamental, macro, COT, quant, sentiment & intermarket intel — plus trend targets and scorecards. Check the data here 👉🔗🔗
⚠️ Caution Zone
News Watch & Position Safety:
Major news = guarded vault. Don't open new trades during release windows.
If you're in already, use trailing stops to shield your haul and lock in gains.
💪 Support the Crew
Smash that “Boost” to fuel our team and keep the raid running smooth. With Thief Trading Style, every day’s a payday.
🗓️ Stay tuned for the next Kiwi Heist – we’re just getting started. Happy robbing, legends! 🐱👤💥
NZDUSDMarket structure suggests is preparing for its next move. The level will likely play a critical role in the upcoming direction.
If structure breaks and confirms the shift, a new bias might form after the retest.
Market Analysis: NZD/USD SlipsMarket Analysis: NZD/USD Slips
NZD/USD is struggling and might decline below the 0.5980 level.
Important Takeaways for NZD/USD Analysis Today
- NZD/USD is consolidating above the 0.5980 support.
- There is a connecting bearish trend line forming with resistance at 0.6010 on the hourly chart of NZD/USD at FXOpen.
NZD/USD Technical Analysis
On the hourly chart of NZD/USD at FXOpen, the pair also followed AUD/USD. The New Zealand Dollar struggled above 0.6100 and started a fresh decline against the US Dollar.
There was a move below the 0.6050 and 0.6020 support levels. A low was formed at 0.5978 and the pair is now consolidating losses below the 50-hour simple moving average. The NZD/USD chart suggests that the RSI is back below 50 signalling a bearish bias.
On the upside, the pair is facing resistance near the 23.6% Fib retracement level of the downward move from the 0.6120 swing high to the 0.5978 low. There is also a connecting bearish trend line forming with resistance at 0.6010.
The next major resistance is near the 0.6065 level or the 61.8% Fib retracement level. A clear move above the 0.6065 level might even push the pair toward the 0.6120 level. Any more gains might clear the path for a move toward the 0.6150 resistance zone in the coming days.
On the downside, there is a support forming near the 0.5980 zone. If there is a downside break below 0.5980, the pair might slide toward 0.5940. Any more losses could lead NZD/USD in a bearish zone to 0.5910.
This article represents the opinion of the Companies operating under the FXOpen brand only. It is not to be construed as an offer, solicitation, or recommendation with respect to products and services provided by the Companies operating under the FXOpen brand, nor is it to be considered financial advice.