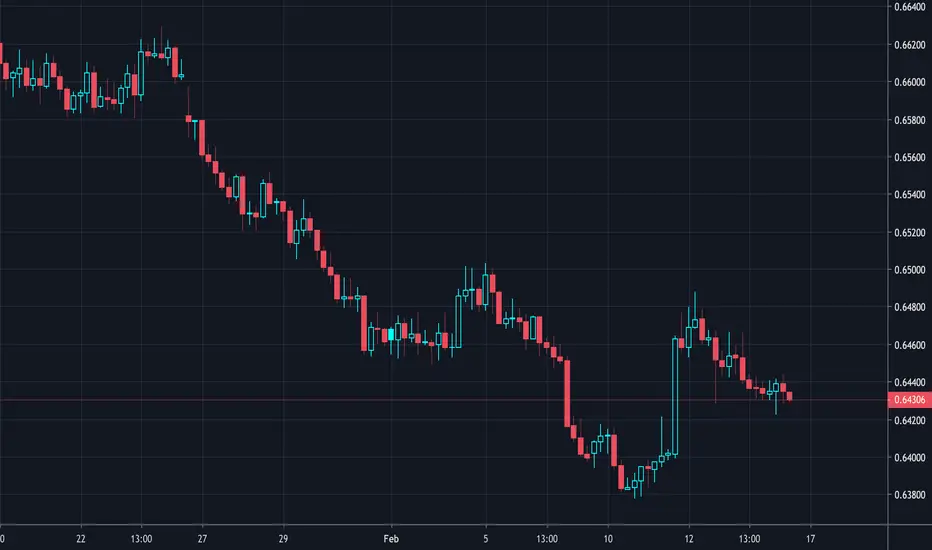
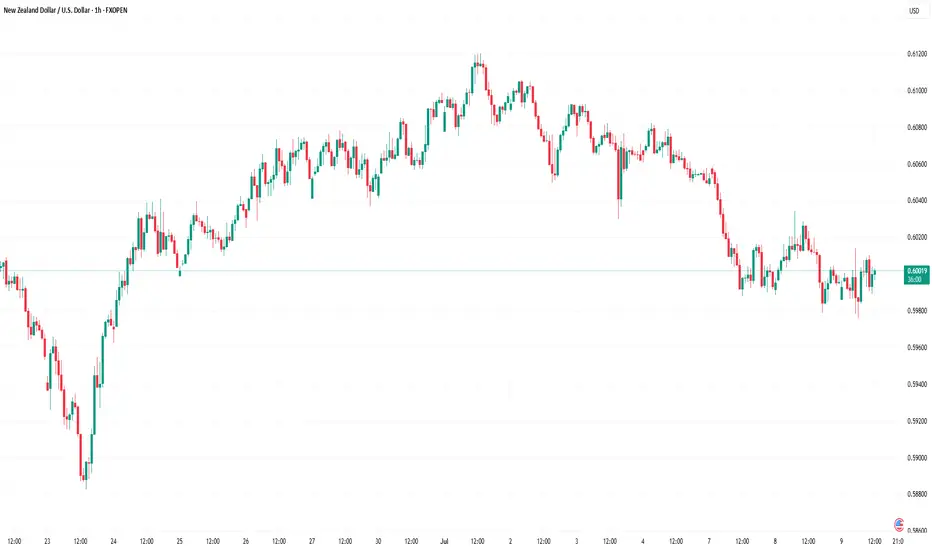
NZD/USD Holds Near Four-Month LowNZD/USD Holds Near Four-Month Low
As today’s NZD/USD chart shows, the pair is trading near a four-month low following a sharp decline. The drop occurred yesterday after the Reserve Bank of New Zealand cut the official cash rate by 25 basis points to a three-year low of 3.0% and indicated that the rate could fall further to 2.55% by May 2026.
According to Trading Economics:
- Analysts now expect at least two additional rate cuts before the end of the year;
- There is a risk of deeper cuts depending on incoming economic data.
New Zealand’s exports are also under pressure, particularly due to the 15% US tariffs that came into effect earlier this month, threatening to undermine the country’s competitiveness in key markets. According to Reuters, Citi analysts expect GDP to contract in the second quarter, raising the risk of a recession in New Zealand.
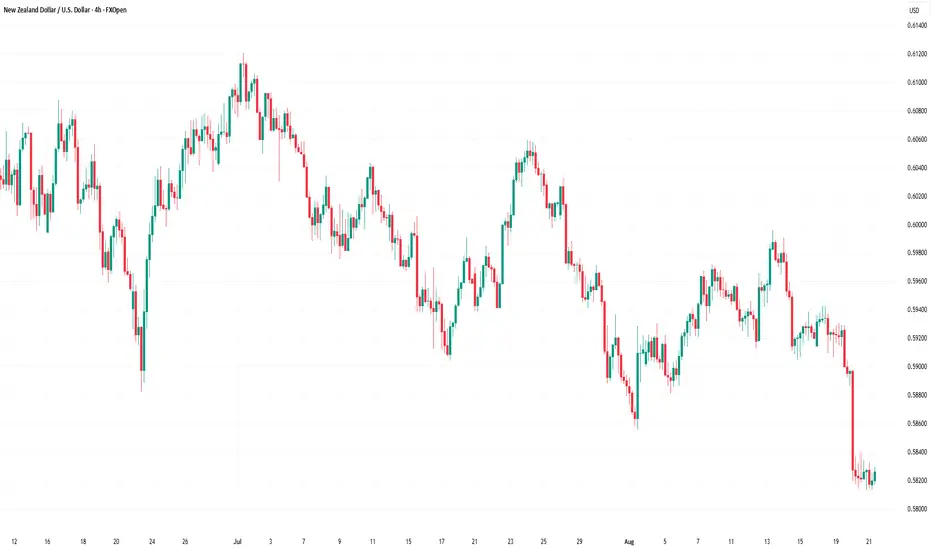
Technical Analysis of the NZD/USD 4-Hour Chart
NZD/USD price action since early July has formed a downward channel (marked in red), reflecting a bearish outlook. Key observations:
→ Yesterday’s drop was sharp, with a very long candle closing near its lows – a bearish signal;
→ However, the lower boundary of the channel acted as strong support, holding back further pressure.
Looking at the broader context:
→ The B→C recovery reached approximately the 0.618 Fibonacci retracement level after the A→B impulse;
→ The D→E rebound from the channel’s median was modest, signalling weak demand.
Given the strength of the channel’s lower boundary and the oversold condition (as shown by the RSI), bulls have some grounds to expect a potential rebound. In that case, NZD/USD could face resistance from the QL line, which divides the descending channel into two quarters.
Reaching the resistance zone formed by the channel median and the 0.589 level (previously acted as support during the inverse head and shoulders pattern - highlighted with arrows) could be difficult in the near term under current conditions.
This article represents the opinion of the Companies operating under the FXOpen brand only. It is not to be construed as an offer, solicitation, or recommendation with respect to products and services provided by the Companies operating under the FXOpen brand, nor is it to be considered financial advice.
Nzdusdtrend
Market Analysis: NZD/USD SlipsMarket Analysis: NZD/USD Slips
NZD/USD is struggling and might decline below the 0.5980 level.
Important Takeaways for NZD/USD Analysis Today
- NZD/USD is consolidating above the 0.5980 support.
- There is a connecting bearish trend line forming with resistance at 0.6010 on the hourly chart of NZD/USD at FXOpen.
NZD/USD Technical Analysis
On the hourly chart of NZD/USD at FXOpen, the pair also followed AUD/USD. The New Zealand Dollar struggled above 0.6100 and started a fresh decline against the US Dollar.
There was a move below the 0.6050 and 0.6020 support levels. A low was formed at 0.5978 and the pair is now consolidating losses below the 50-hour simple moving average. The NZD/USD chart suggests that the RSI is back below 50 signalling a bearish bias.
On the upside, the pair is facing resistance near the 23.6% Fib retracement level of the downward move from the 0.6120 swing high to the 0.5978 low. There is also a connecting bearish trend line forming with resistance at 0.6010.
The next major resistance is near the 0.6065 level or the 61.8% Fib retracement level. A clear move above the 0.6065 level might even push the pair toward the 0.6120 level. Any more gains might clear the path for a move toward the 0.6150 resistance zone in the coming days.
On the downside, there is a support forming near the 0.5980 zone. If there is a downside break below 0.5980, the pair might slide toward 0.5940. Any more losses could lead NZD/USD in a bearish zone to 0.5910.
This article represents the opinion of the Companies operating under the FXOpen brand only. It is not to be construed as an offer, solicitation, or recommendation with respect to products and services provided by the Companies operating under the FXOpen brand, nor is it to be considered financial advice.
Market Analysis: NZD/USD Faces Pressure, Dips AgainMarket Analysis: NZD/USD Faces Pressure, Dips Again
NZD/USD is also moving lower and might extend losses below 0.5935.
Important Takeaways for NZD/USD Analysis Today
- NZD/USD declined steadily from the 0.6000 resistance zone.
- There is a major bearish trend line forming with resistance at 0.5960 on the hourly chart of NZD/USD at FXOpen.
NZD/USD Technical Analysis
On the hourly chart of NZD/USD on FXOpen, the pair also followed a similar pattern and declined from the 0.6030 zone. The New Zealand Dollar gained bearish momentum against the US Dollar.
The pair settled below the 0.5960 level and the 50-hour simple moving average. Finally, it tested the 0.5930 zone and is currently consolidating.
Immediate resistance on the upside is near the 23.6% Fib retracement level of the downward move from the 0.6031 swing high to the 0.5929 low at 0.5960. There is also a major bearish trend line forming with resistance at 0.5960.
The next resistance is the 0.5985 level or the 50% Fib retracement level of the downward move from the 0.6031 swing high to the 0.5929 low. If there is a move above 0.5985, the pair could rise toward 0.6030.
Any more gains might open the doors for a move toward the 0.6080 resistance zone in the coming days. On the downside, immediate support on the NZD/USD chart is near the 0.5930 level.
The next major support is near the 0.5910 zone. If there is a downside break below 0.5880, the pair could extend its decline toward the 0.5850 level. The next key support is near 0.5820.
This article represents the opinion of the Companies operating under the FXOpen brand only. It is not to be construed as an offer, solicitation, or recommendation with respect to products and services provided by the Companies operating under the FXOpen brand, nor is it to be considered financial advice.

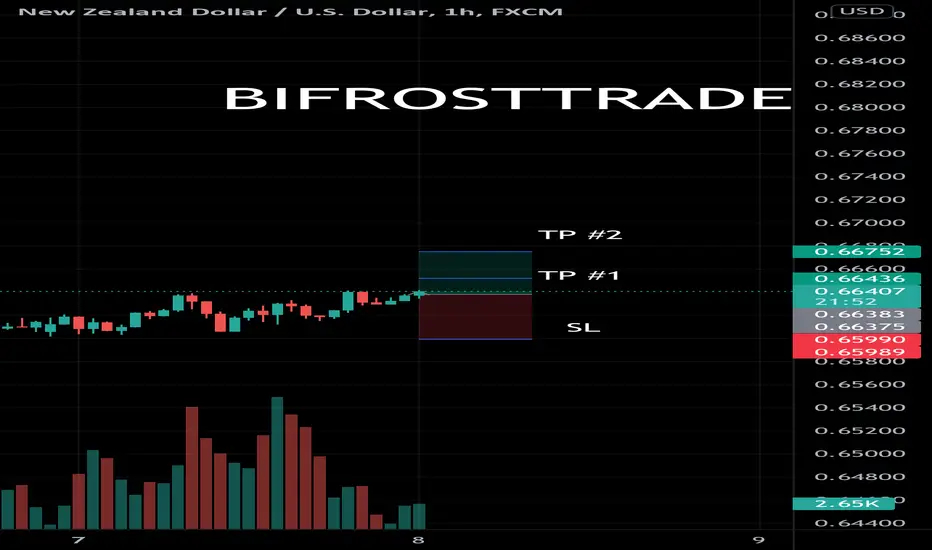
NZDUSD hrly long | Algo trading@everyone** NZDUSD hrly long**
⚠️ half risk due to lack of trend
Buystop @ .66359
TP #1 @ .66530 77.63% wr
TP #2 @ .66752 56.58% wr
SL @ swing low .65990 17.11% hr
Hr and Wr determined from past trades
For more trades, view my profile or BifrostTrades.com
What I'd love to see on NZDUSD!Price has already respected my trendline. Since i close all my position over the weekends, i'd love price to get back to my trendline so that i could short
NZD/USD Intraday: further upside.Long positions above 0.6535 with targets at 0.6560 & 0.6600 in extension.
Alternative scenario
Below 0.6525 look for further downside with 0.6505 & 0.6470 as targets.
NZDUSD Time Cycle Pattern.NZDUSD is trading according to the time cycle (as you can see in the chart). NZDUSD is also trading in a channel pattern moreover it is trading in a synchronize pattern with the time cycle. At the beginning of time cycle, price is at high point A or at the resistance of channel pattern (as you can see in chart), in the middle of time cycle it is trading at lowest point B or the support line of Channel Pattern and at end of time cycle price is again moving towards the resistance line of channel pattern, which is point C. So, according to the pattern, we might see NZDUSD may move downside towards the Support of channel pattern.
If You Like Idea Do Follow/Comment/Like For More Quick Update As Time Is Money.
Note Trade With Proper Risk Management System.
Thanks

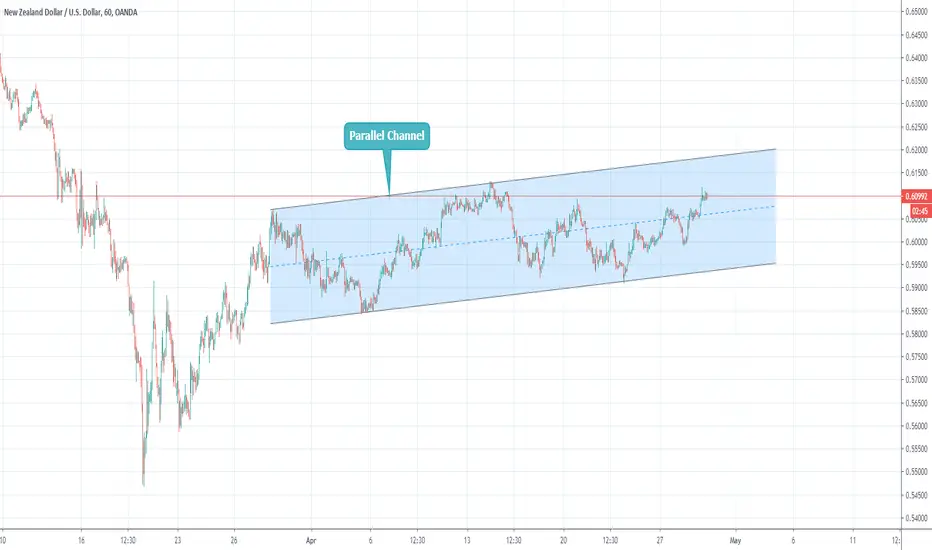
NZDUSD Trading In Channel PatternNZDUSD is trading in channel pattern we might see, that it will trade in the same manner. One can take the trade on a buy or sell side at the support and resistance level of channel pattern, respectively.
If You Like Idea Do Follow/Like/Comment For More Quick Update As Time Is Money.
Note - Trade With Proper Risk Management system.
Thanks.
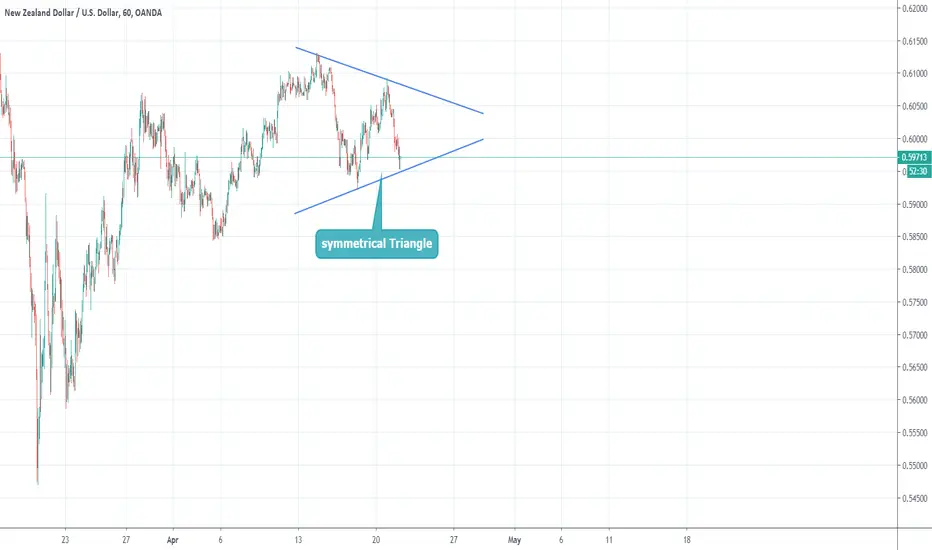
NZDUSD trade In Symmetrical Pattern.NZDUSD is currently trading in a symmetrical pattern, which indicates that the trend is not decisive, as NZDUSD can give a breakout on either side for longer-term trends. For a period, it will trade in the symmetrical triangle pattern. Trade can be initiated for the long side for a very short time and gain few pips of profit until it gives a breakout from the pattern.
If You Like Idea Do Follow/Comment/Like For More Update
Note - Trade With Proper Risk Management System
Thanks
NZDUSD is bearish, looking for violation of the range lowNZDUSD can trade up to 0.6450 and a little bit past it but ultimately looking for a bearish move past 0.6380