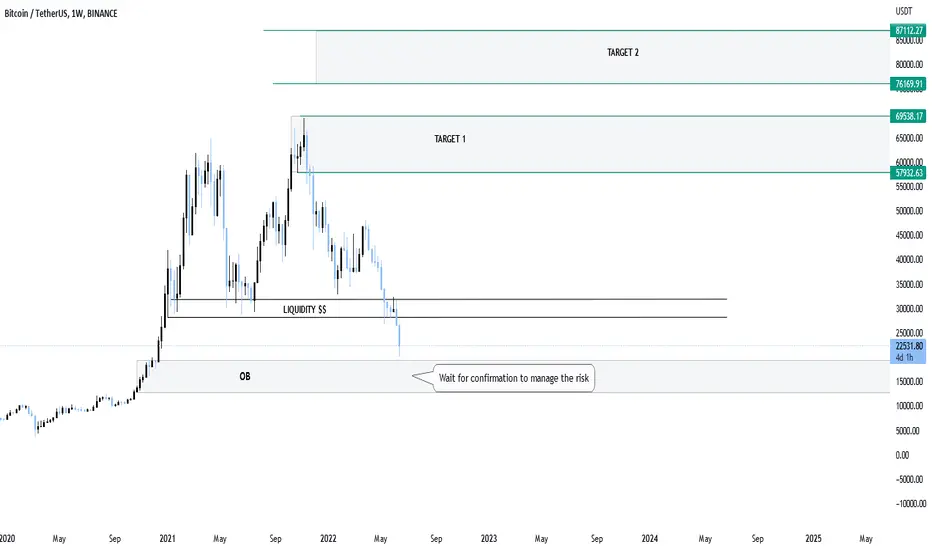
#analysis 59 - Weekends endSo the weekend has finally come to an end, and we can see there's not much altcoin flied far. Now Bitcoin has come to a consolidation phase.
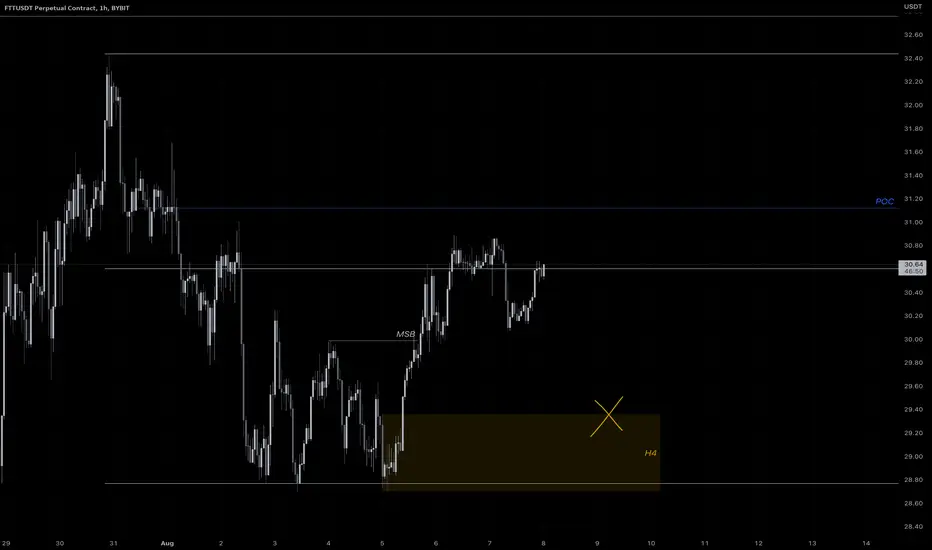
Not pretty sure how it go, so flat now. But I did check the chart of FTT. It seems that pretty good if we reach the lower part inside the range. Look forward to going to the range high if we made a bounce down below. However, the SL should be at around the range low, not below the OB for safety.
Why?
The range low has already tested for 3 times, which is not pretty good for general cases. Also, now not pretty sure how Bitcoin go in the new week. We'll set it when Monday ends.
So let's take a rest for another day.
OB
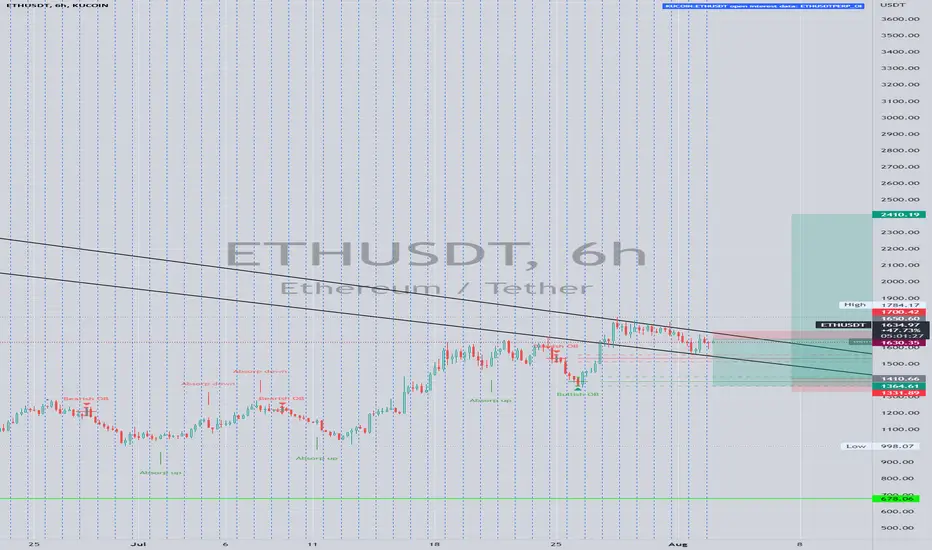
Possible Idea for Short and Long ETH/USDTThis is another test of an idea using order blocks. Bearish and Bullish Order Blocks are marked. Think Ethereum must correct more before going up too much more or it will be an epic failure. I would never buy Ethereum at this price so why would most other people? For this uptrend to be resumed iit needs to finish the correction. Here is kind of how I see it playing out. I was looking at the locations of the order blocks and this is what I cane up with. Those two lines are very old and seems to be important here. Since the top trend line has been a point of rejection multiple times, it seems to me that its a good place to short to the bullish OB. Those line were there from way earlier when I was finding where another breakdown was going to occur. You should be able to see the origins. So shorting to the Bullish OB makes sense. Then longing there to the next high and use TP using the VP. There is the potential that it could go straight down through the block and continue further,
It could also just got to the order block from where it is now, if so missed trade not a big deal. Again, this is just an idea/experiment part of a series of tests I am working on for a new strategy and possible indicator.
I am using many other thing besides this to design this trade idea. I use a MM Matrix, Live Order Book data, Liquidation Levels, Volume Analysis, Foot print charts and a different charting software. I have done my best to get the data here and make it work on time based charts but I work more with range charts I am not trading this just seeing how it plays out. I have a fair amount of confidence it will be close to how it goes. One or both trades should work out. I would have larger stop losses myself but these make sense if my idea is remotely correct.
-NFA, Not live trade I am doing, experimental trade but think concept is sound. Lets see. If you haven't noticed I am in search of something different. I hate following so I always look for different things or opportunities. Some work, many don't. I still trade my regular trades but am just posting these for feedback and heck maybe someone sees something they like and it makes them good profits. I certainly hope it helps someone.
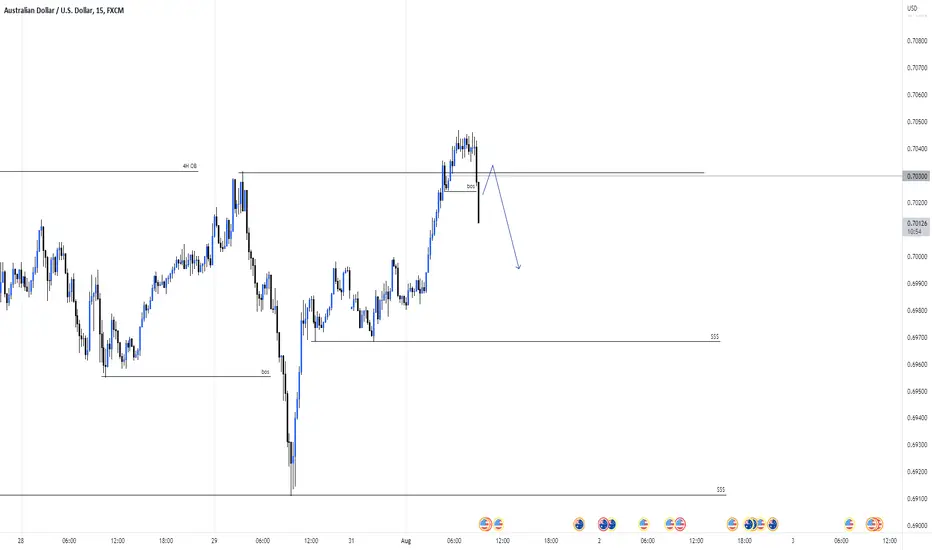
AUDUSD Monday Analaysis Update, Bearish for Equity Open EntrySo it took the buyside liquidity high as you can see, we are still in the 4H OB, and we can see the bearish momentum and the inner Break of structure in the 5M Timeframe.
if you are fimiliar with ICT Model you can apply it now
we are targeting the 2 liquidity lines as seen, SL will be moved to entry and partials will be taken upon the first Liquidity line being hit, overall really confident with the analysis and i will be taking the trade
in the inner small timeframe range, enter at the EQ ( 50% ) and Sl above the high and target the liquidity lines.

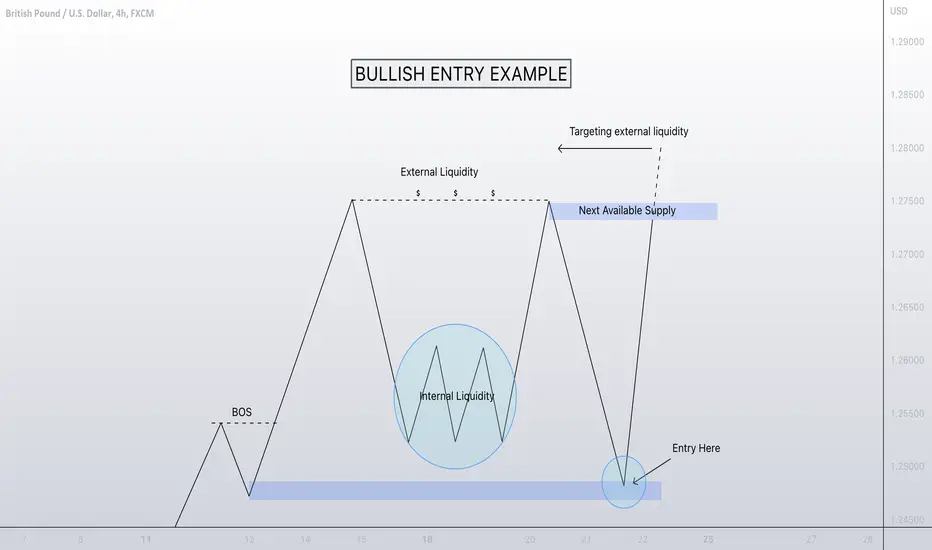
BULLISH ENTRY EXAMPLE 🔥🔥🔥Usually, liquidity is calculated by taking the volume of trades or the volume of pending trades currently on the market. Liquidity is considered “high” when there is a significant level of trading activity and when there is both high supply and demand for an asset, as it is easier to find a buyer or seller.
Hope this example can help some people understand when trading.
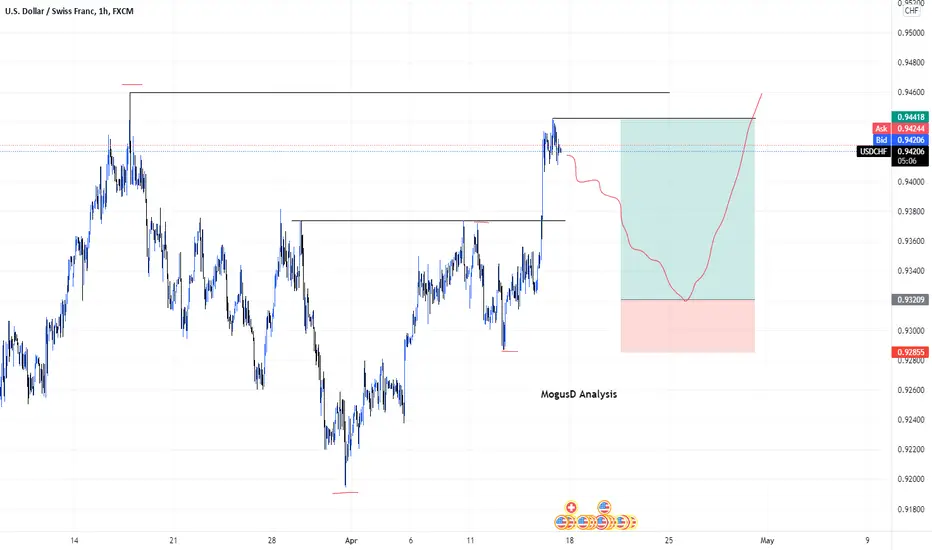
USD/CAD -Long This is one scenario i have for usd/cad.
Price has created choch and a bos with a bullish move to the upside i am looking to enter on the 30m OB and could take out the previous weekly high and liquidity
This is for educational purposes only.

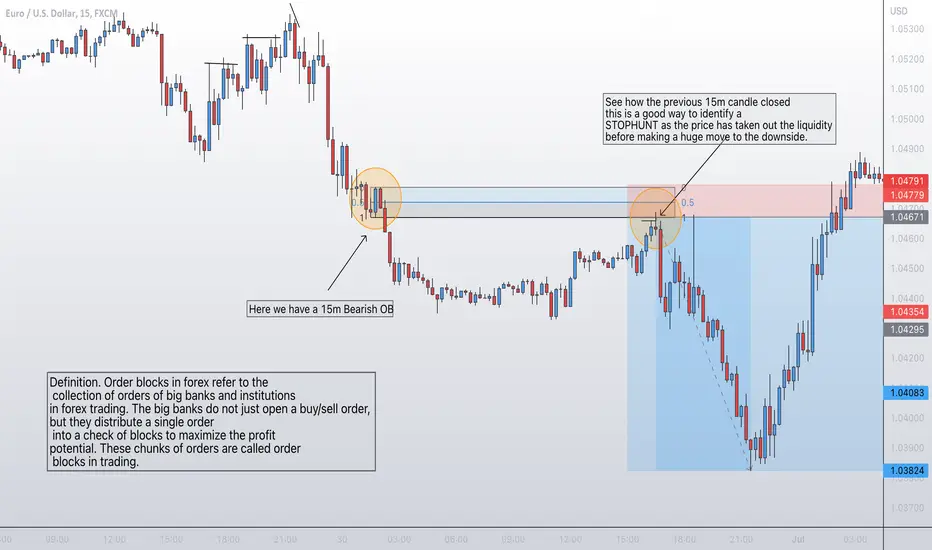
Bearish Orderblock with SH Powerful setups 🔥Definition. Order blocks in forex refer to the collection of orders of big banks and institutions in forex trading. The big banks do not just open a buy/sell order, but they distribute a single order into a check of blocks to maximise the profit potential. These chunks of orders are called order blocks in trading
GOLD (XAUUSD) 1DHi there,
Over here i got the Bulish Bat pattern on daily TF so you can found the buying Opportunity, and also here is POI on D1 TF From 1677 to 1715 as i mentions in the chart, And also from here the 0.886 (88.6%) level of fibonacci retracement, The Last thing is that it is a strong support also.
Note: this is not a financial advice thank you

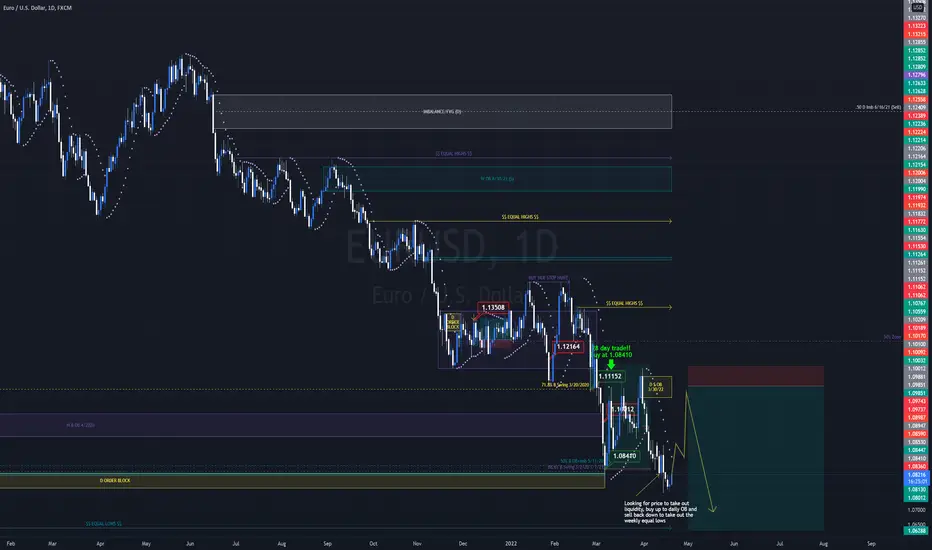
EU Sell at 3/30/22 OB IdeaLooking for price to take out liquidity, buy up to daily OB and sell back down to take out the weekly equal lows. Very small FVG below OB
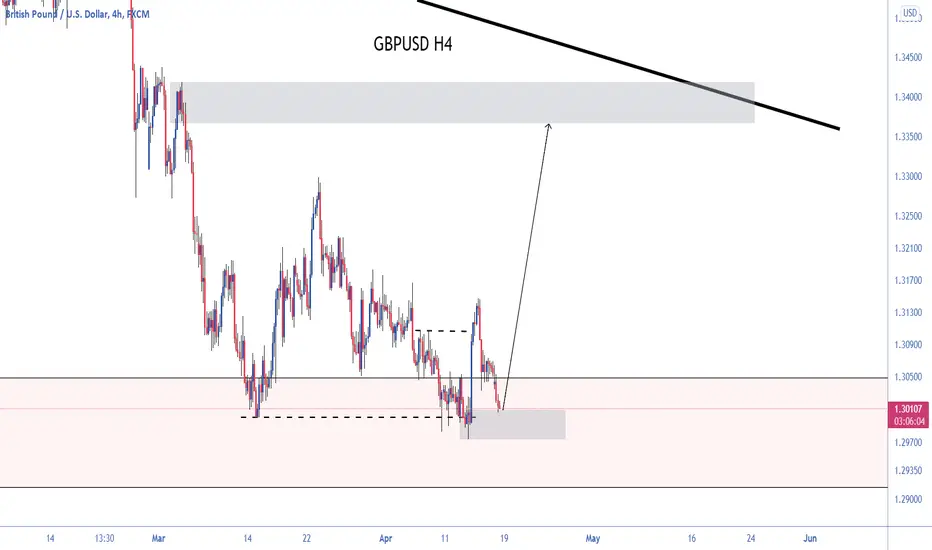
GBPUSD LONGPrice has come back to OB where price made a CHOCH taking out 2 highs.
Has only touched the top half of the OB but there seems to be more liquidity left within the wick.
Price has also created 2 liquidity zones which were done intentionally.

EURUSD SHORTPrice made a choch and left the IMB on back and it has to be filled and price will break the EQH and reach our poi and we will look up sell opportunities

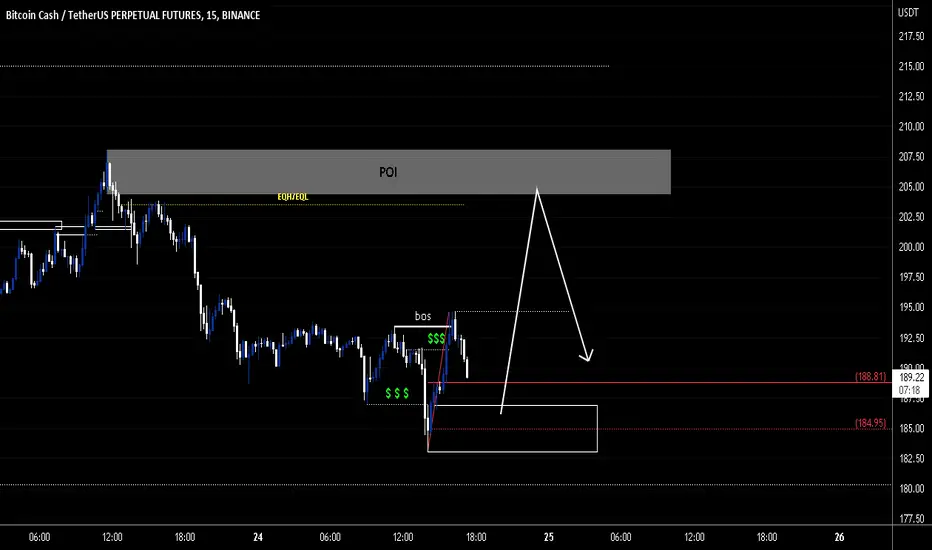
BCHUSDTPERP / BINANCE / BUY TO SELL SETUPHello everyone !
After taking buyside liquidity, price is showing strength with an15m BOS.
Higher timeframe strucure was bearish, I am trading this retracement to my POI.
Upther, price action could show me a bullish continuation or defend is bearish position.
Time will tell !
BITCOIN attempts to fireBITCOIN forming liquidity trend line with buy stops on the fake blocks. BITCOIN is in the BULLISH ORDER FLOW which means that a rally to the 32.000$ can obviously come true. I expect a correction to the 29500$ than bounce from the major order block

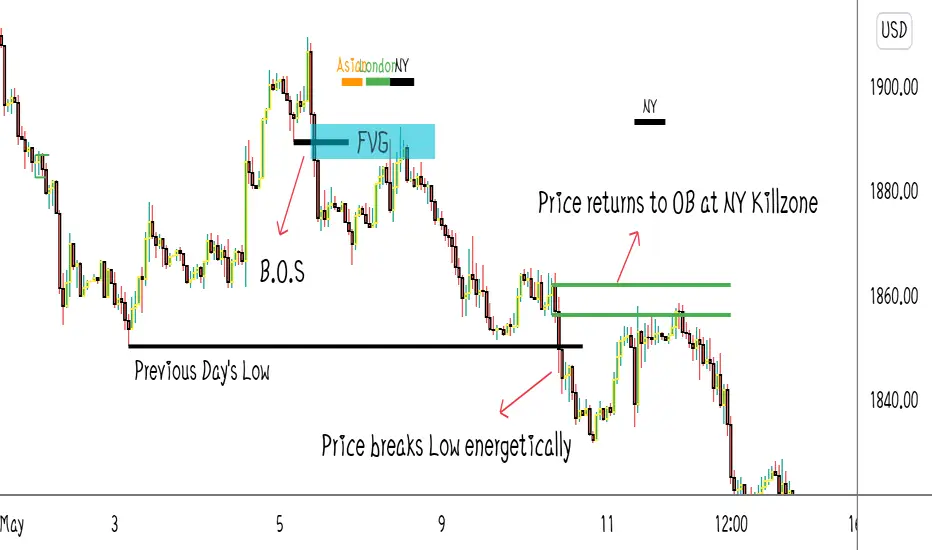
Fair Value Gab/Order Block/Break of Structure | Beginner' Guide Hello Traders! i thought I would give a short review of recent Gold move and how you could spot like this price moves next time. You can also see how time and price theory work.. with NY session being the most volatile or where real price moves could start..
The charg explains everything.. take a look at it and then look at your chart and try highlighting same and similar moves in YOUR OWN chart..
Let me know what you think in the comments 🙂
Please like if you found this helpful to you 😸
Thanks all :)
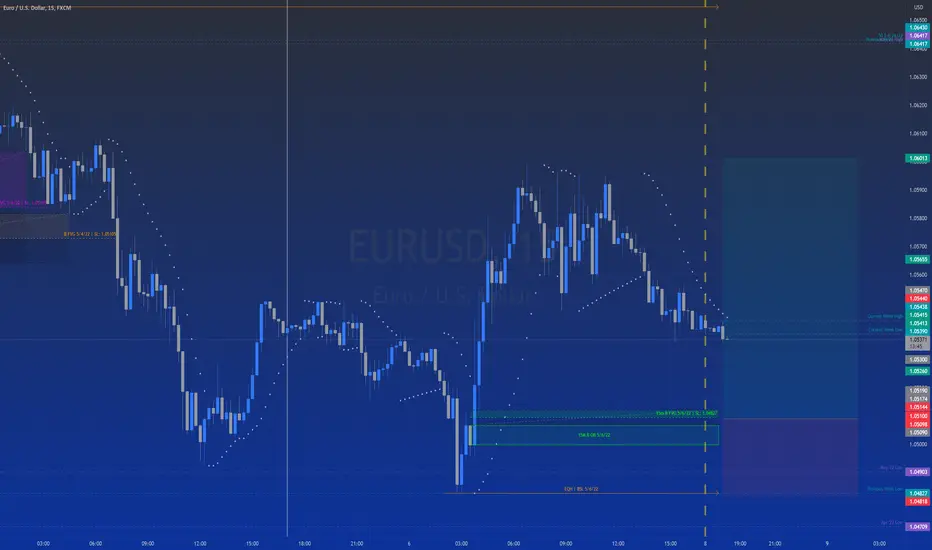
Possible EU buy 15m FVG+OB 5/6/22Looking for price to hit FVG on 15m time frame and continue bullish
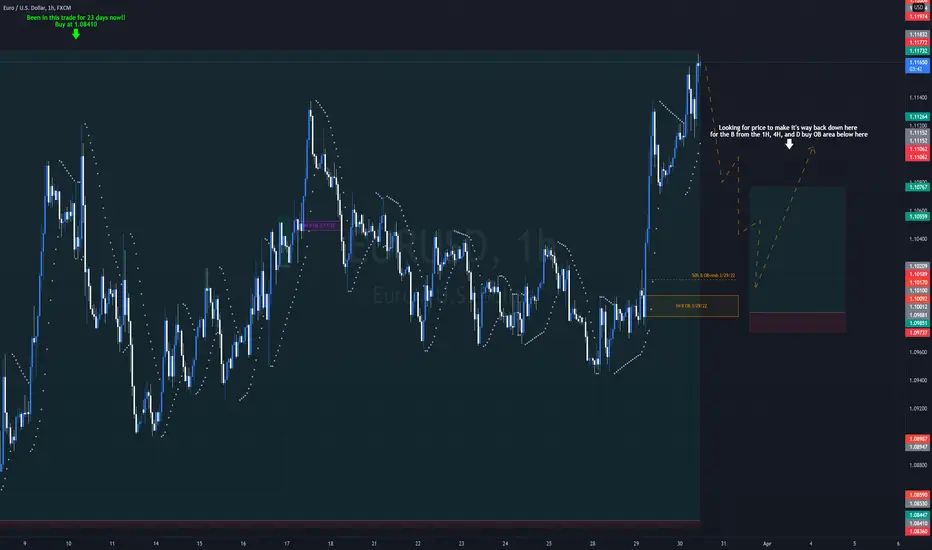
Possible EU buy when price returns to this areaLooking for price to eventually make it's way back down here for the buy from the 1H, 4H, and D buy OB area. In the same area of the 1H order block there is also a 4H and a Daily order block in the same area and they all intersect. What do you think?
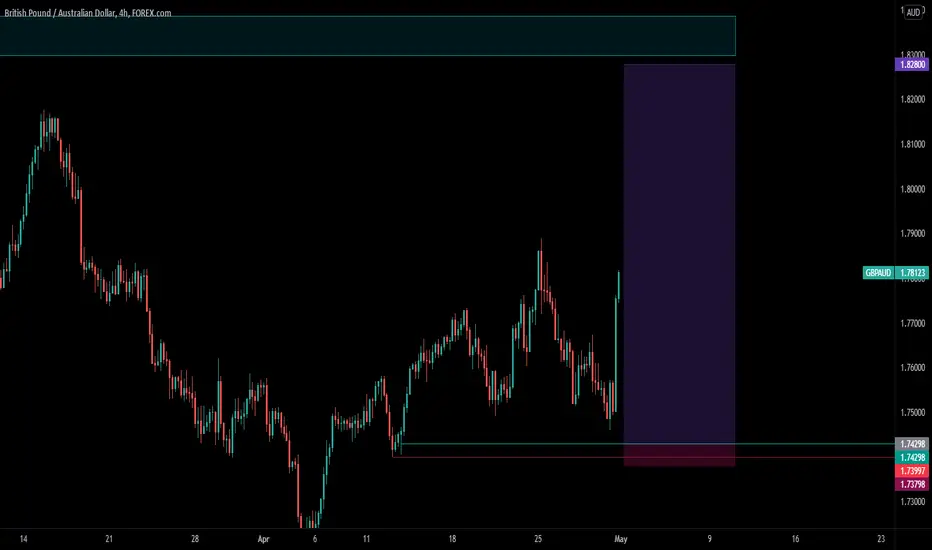
GBPAUD... MASSIVE 17RR OPPORTUNITYHello traders,
I'm not really a fan of trading these pairs (EURAUD, EURNZD, GBPAUD, GBPNZD). Why? they come with more than usual spreads which make the limit orders not to be triggered. Nevertheless, I will place a limit order for this pair once this market opens tomorrow.
Just like the EURAUD, this pair is taking a breather before continuing the bearish move. You might wonder if there is any liquidity trap, well if I must say, there is always a trap but might not be visible on this timeframe. If you go lower, you might find,
Anyways, like if you agree.
Cheers!!!
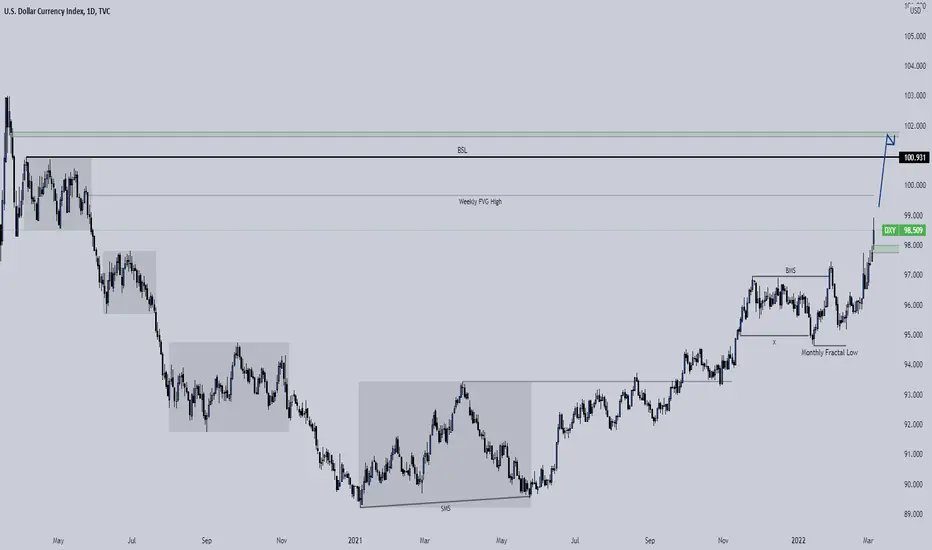
USD Index DXY - Potential MMBM Monthly Timeframe: (check the linked image)
- The market traded aggressively away from a Bullish Orderblock.
- Last Month, DXY created a Bullish 3- Bar Fractal (swing low) which lead to an explosively bullish move. We can easily see the next monthly candle being bullish as well.
- We have now disrespected a very strong Bearish PD Array: A Bearish Breaker. It showed no willingness of respecting it, which means that buyers are in control.
- 3 months ago, we traded through a bearish candle. This bearish candle works as its own structural Orderblock, and we shouldn't see price drop below this level (like the two green boxes below). If it does- we might see a reversal lower.
Daily Timeframe:
- We have a potential ICT Market Maker Buy Model playing out.
- We are in a massive uptrend, and we can easily see a continuation of it.
- We are getting closer to the Weekly FVG's High.
- At 101.000 (institutional number), we have very clean Equal Highs. Price can easily draw up to this level, as a massive liquidity pool resides here. Expecting a manipulation through this level, potentially up to the Volume Imbalance.
- At 101.640, we also have a daily Volume Imbalance Vaccum Block. This is a huge gap in price which likes to get traded to, and filled. Sometimes you'll see a reversal at this level as well.
Caution:
- This is just my view on the USD. Price may not play out as expected. This can especially be due to the current war situation in Ukraine. Price can create Black Swan events and massive volatility that can ruin the setup on a Daily TF.
- From 97.720 to 98.000 we have a volume imbalance below current price. DXY can easily retrace lower to fill this level. If this happens- it can respect this volume imbalance and go higher from there, or create a lower retracement.
GBPUSD LONGThe price has reached the demand zone in high time frame.
.
After hunting the previous support, showed a good reaction.
.
We expect the price to rise in the coming weeks.
A very very first time for this Newbabie - SMC+LiquidityAfter scanning quite a lot of videos and articles and discussions with buddies, and started to mark the key area on the chart. Not all the trade were taken, but i did backtest and paper trading most of them.
What confusing me is the TF that where i am truly in! have to workout on this