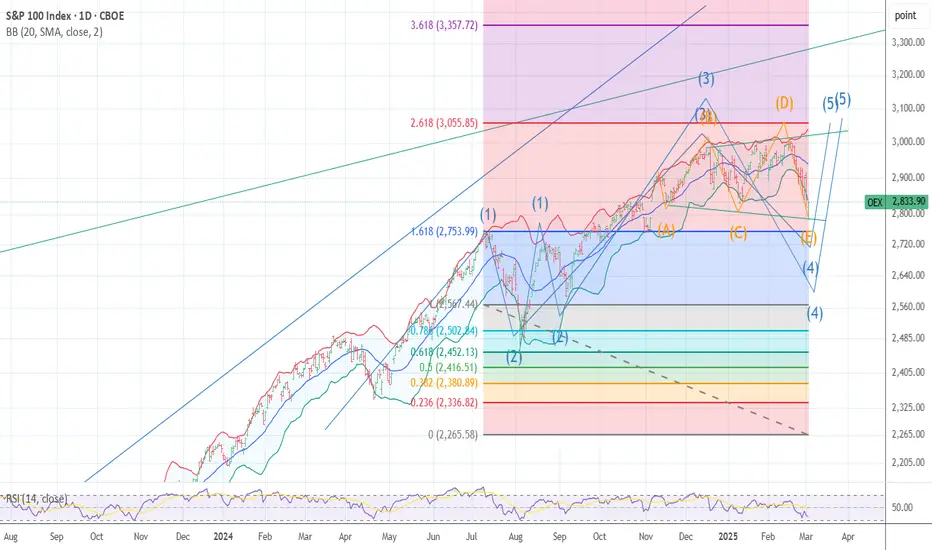
OEX /SPX Bullish wave 5 pattern crossroads The chart posted is the sp 100 I am posting it as we are now at the crossroad for bull or bear count .We have rallied to .786 as I will show and have a wave a x 1.27 = c at the .786 High But if we break above 5922 in the Cash SP 500 There is NOTHING to stop it from reaching a target of 3005 in the OEX where wave A up or wave 1 x 1.618 = wave C Top or wave 3 in the SP 500 WAVE A or WAVE 1 up 5481 - 4835 = 646 x 1.618 =1045 plus wave B low or wave 2 5102low= 5102plus 1045 =6147.22 The exact high . This is the reason I took the loss and moved LONG .Best of trades WAVETIMER
OEX

I am 100 % short spy and qqq I am BULLISH DXY the chart posted is now setup for the cycle top On several cycles and we have just popped the Shiller p/e above 3866 second highest reading ever . Cycle are into a peak that was due 7/5 to 7/14 So why are we now turning down .? wait the energy from one of the largest solar storms is the time for the transition it is also a new moon . my spirals have called for the top as it did in 12/5 and 2/17 . I see a min drop of over 8 and could see well over 11.8 within the next 90 days . best of trades WAVETIMER

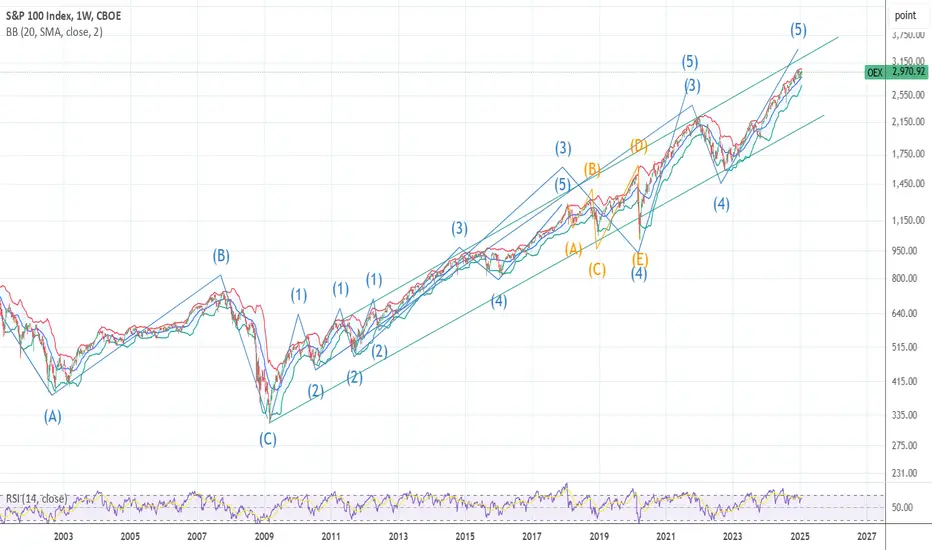
Risk off The cycle low is due 10/10 -20th The Bullish wave count is that we are ending wave 1 of 5 in super cycle blowoff wave 2 would drop in a ABC decline and drop back to .382 alt 50% of the whole rally from 4835 low . This is the bull wave count ! The bearish wave count is that we are ending the final 5th wave up from 2020 low march 23th see my work calling for a panic into 3/18/3/20 2020 the low was 3/23 20 into perfect math at 2191 as was the call for 3510 to 3490 low and the 4835 low all are in near perfect math . My worry for this oct 10 to the 20th Is I see a 1987 like decline taking out the 4835 in a wave E CRASH . Under all three counts I moved to a 110 % short. best of trades WAVETIMER

Oex 4 hourly chart so you can see in detail The chart posted should be view as a guide to what is a Crossroad in all indexes Today best of trades wavetimer!

RSP and WHY I AM BULLISH STILL197/199 target The chart posted is the sp 500 equal weighted RSP has dropped to a trend line dated back to march 23 2020 . I have three clean points and all are major . Elliot Wave calls for a final 5th wave to end this advance in the area of 198 plus or minus 1.25 Fib relationship and PUT /CALL as well as most of my spiral and cycles point to the final advance to a Bull market top is now setup . BULL MARKETS TOP ON GOOD NEWS > Best of trades WAVETIMER

NEW RECORD HIGH Coming 26 td from today The wave structure I was so bearish on Has made it to the support targets the crash cycle based on data back to 1902 is all Crash cycles have been 8 to 12 TD today is day 9 I have moved to a 90 long knowing that the cycle has at most 2 days and is into the 5 /6 spiral cycle lows inan event due by 3/8 to 3/13 focus 3/10 .I can now state that the chart posted could be counted as an expanding triangle in what is now labeled wave 4 I am looking for a sharp 26 td rally to mark the top from 3/10the week .SP 100 should see 3055 min to as high 3150 in a blowoff wave . Best of trades WAVETIMER
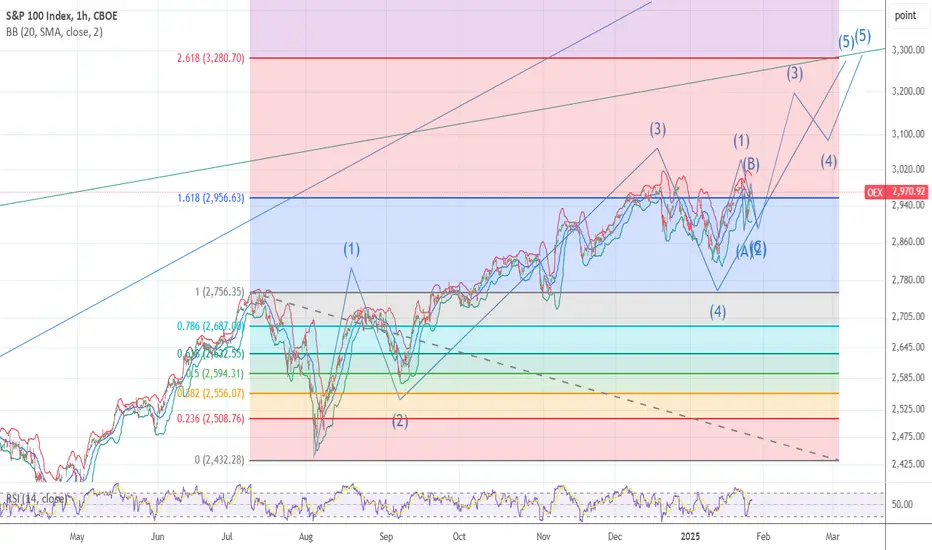
OEX 100 hourly Forecast 3273I am posting this chart for a guide as to where if we still need to go to complete the advance ! best of trades the Wavetimer
OEX 100 FINAL LEG TARGET 3273 March 13th week The chart posted is the blue chips SP 100 OEX .It is my View that All markets are that of fractals patterns the have a clear movement of math in a repeating Sequence . March 13th week if I am correct and we are into an OEX HIGH near 3273 we would be hitting the long term channel as well as my 1.4 to 3.4 % Breach of the monthly Bollinger band signal as well . I would then generate My Signal for the Major Top to End the bull move from march 9 2009 . I have posted the forecast for 2025 calling for a min drop of 20 % plus as I did in the bed8th forecast 2021 calling for a decline of mIn 20 plus . Well spirals as well as the Math and Bullish Sentiment models call a last wave up in what should be a blowoff ?? in a narrow but it is a new Paradigm !! The MIN decline in this signal has been 21.9 The avg has been 38% and the longest has been over 50 % . If we see a sharp drop over the next 3 td and we drop to 618 target 2886 plus or minus 4 I will move to a 120% long in the money Calls in SPY and QQQ . Best of Trades WAVETIMER After this top I will turn as Bearish as I did January 10th 2020 and dec 2021
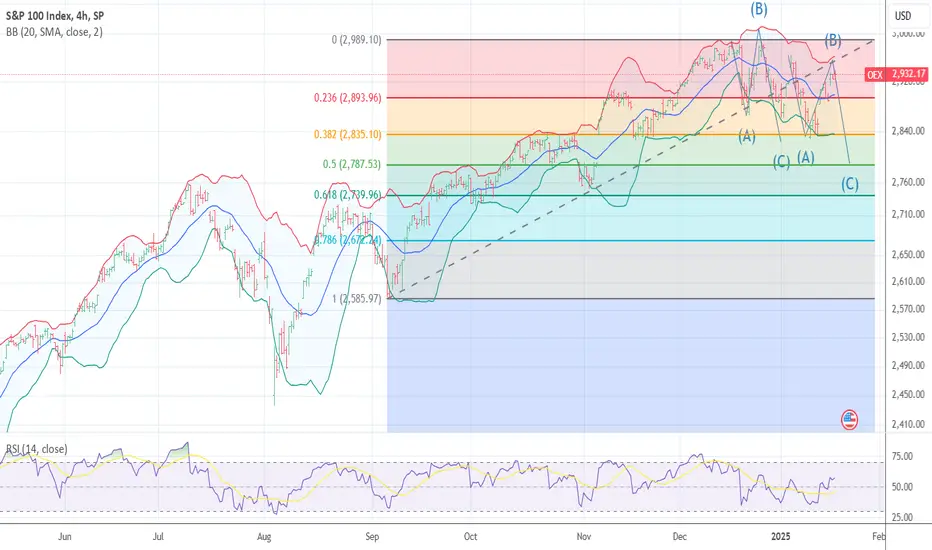
I have now moved to an 80 % long PUTS in SPY and QQQ and SMHBased on the chart posted the OEX 100 is at a crossroad I can count this Two ways first the bullish count we are ending a wave 1 up of 5 of 5 in the blowoff wave and we would see an small abc decline toa .382 then I would cover Or if we break the .50 % pullback would would look for a sharp washout to the a minor new low .But if we break above 2951 then we are in the 5 wave up to two target 3045 alt 3147
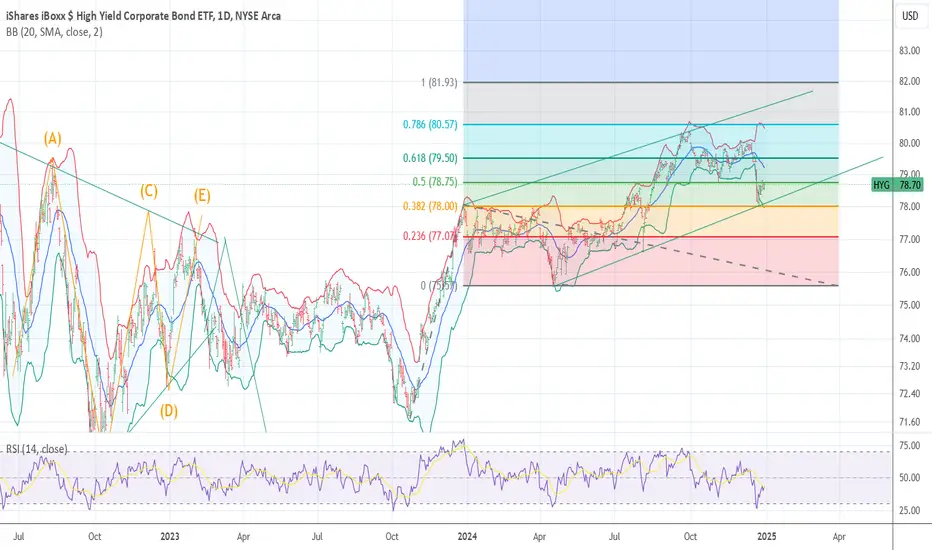
IF you are Bearish SP 500 Your EARLY The chart posted is That of High yield Market ETF HYG we have just finished of the correct in this sector and should see Liquidity coming back into assets One Last Gasp This should raise mags qqq and spy toa new record high as most other indexes struggle to rally back to .618 best of trades WAVETIMER

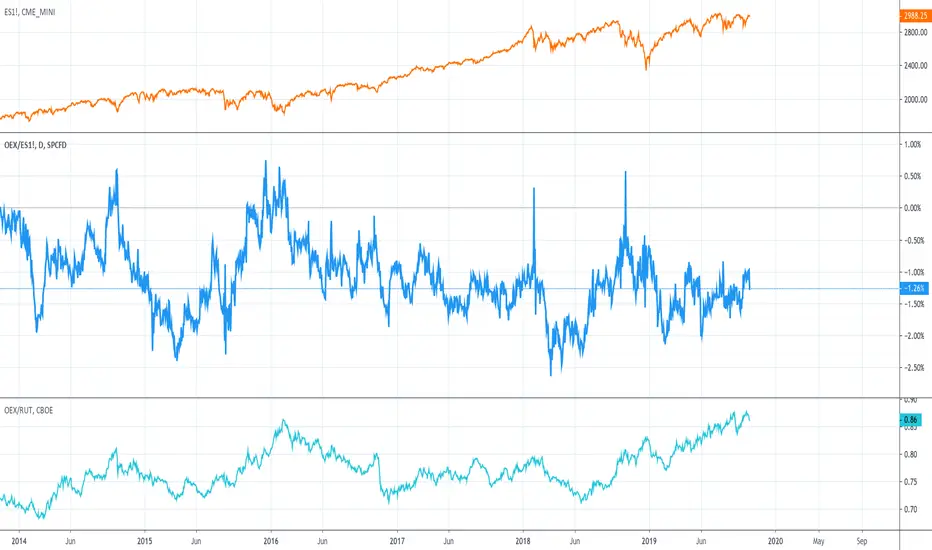
S&P 100 versus all the rest S&P 500 and also Russell 2000S&P 100 versus all the rest S&P 500 and also Russell 2000... Note that in the previous cycle 2003-2007 was a value cycle so the S&P 100 big cap names were underperform the broad market, growth cycles are mostly a concentrated big cap names phenomenon.