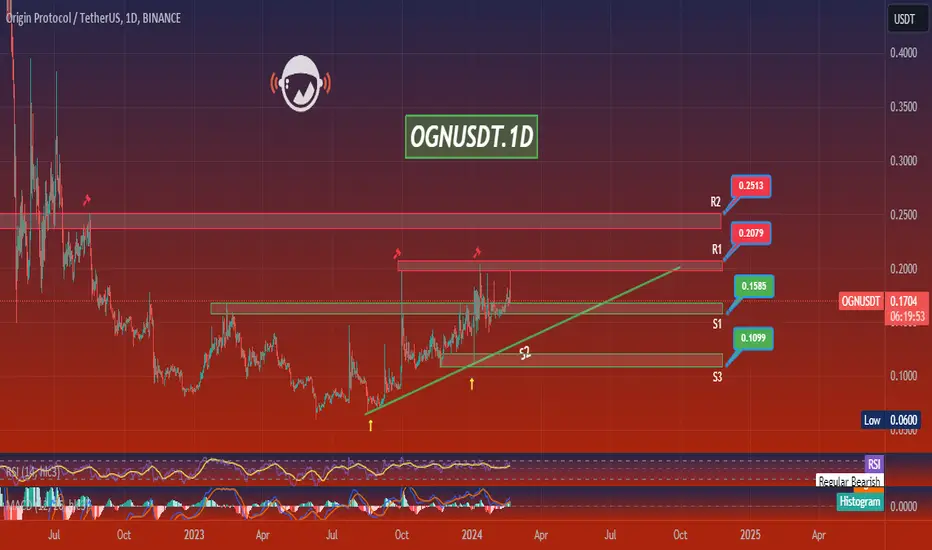
OGNUSDT.1DBased on the provided market data, the OGN/USDT pair is currently priced at 0.17 USDT. The Relative Strength Index (RSI) on the 4-hour, 1-day, and 7-day charts are 47.61, 64.69, and 69.66 respectively. This indicates a neutral to slightly overbought market condition. The Moving Average Convergence Divergence (MACD) on the 4-hour, 1-day, and 7-day charts are 0.0020, 0.0041, and 0.0158 respectively, which also suggests a neutral market trend.
Looking at the Bollinger Bands (Bb), which are 0.1847 for both 4-hour and 1-day charts and 0.1850 for the 7-day chart, the price is currently near the lower band, indicating a potentially undervalued condition.
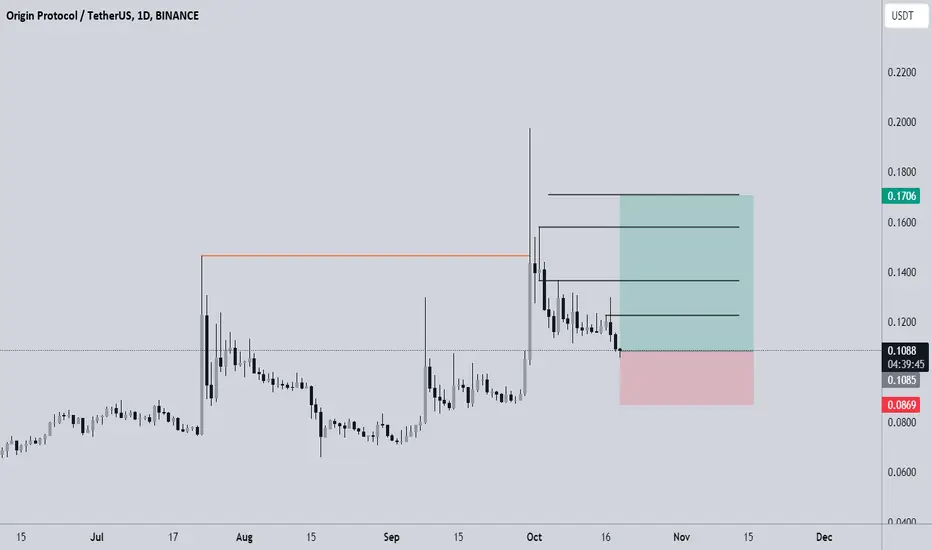
The support levels on the 4-hour chart are 0.1627, 0.1526, and 0.1450 while the resistance levels are 0.1973, 0.2070, and 0.2230. On the 1-day chart, the support levels are at 0.1620, 0.1520, and 0.1407, and resistance levels at 0.1707, 0.2260, and 0.2370. For the 7-day chart, supports are at 0.1430, 0.1047, and 0.084, and resistances are at 0.25, 0.28, and 0.37.
Overall, the market condition for OGN/USDT seems to be neutral to slightly overbought. However, the price is near the lower Bollinger band which could indicate it is undervalued. It might be a good opportunity to buy if the price bounces back from the support levels. However, if the price breaks the support level, it may continue to fall. As always, it's important to consider other market factors and your own risk tolerance when making investment decisions.
OGN
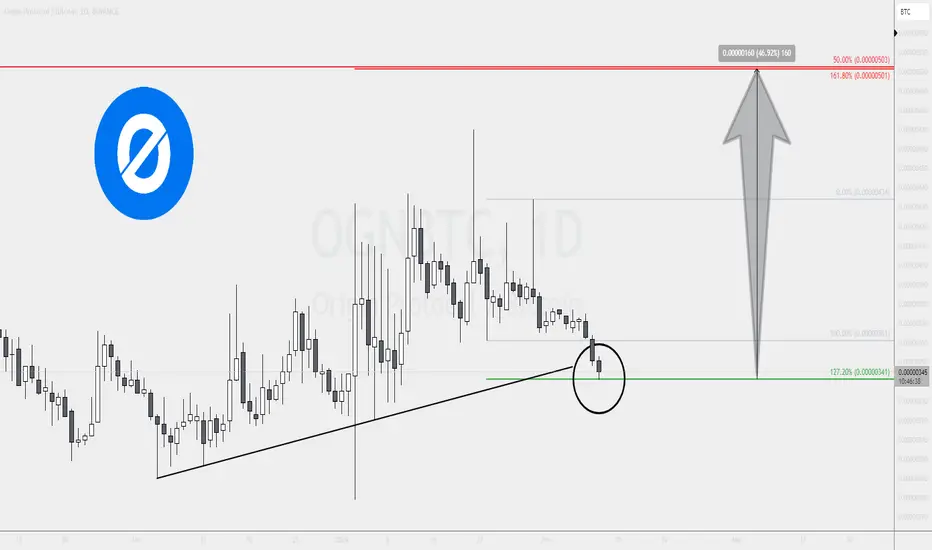
OGNBTC Critical Bounce off Fibonacci and TrendlineToday's analysis centers around a critical question: Is this the bottom for OGNBTC we've been eagerly awaiting?
The charts tell a compelling tale as OGNBTC is currently stress-testing the 127.2% Fibonacci support, showcasing a clear bounce off this level.
Yesterday's resilience demonstrated a bounce off the simple uptrend trendline, with OGNBTC managing to avoid a daily close below the trendline. However, today brings a twist as the price briefly dipped below, only to find stability thanks to the steadfast support of the 127.2% Fibonacci level.
Should this support continue to command respect, a high-probability scenario unfolds—the potential bottoming out of OGNBTC. Envisage a future where we anticipate a nearly 50% surge in OGN price over BTC, marking a significant turnaround in the crypto narrative.
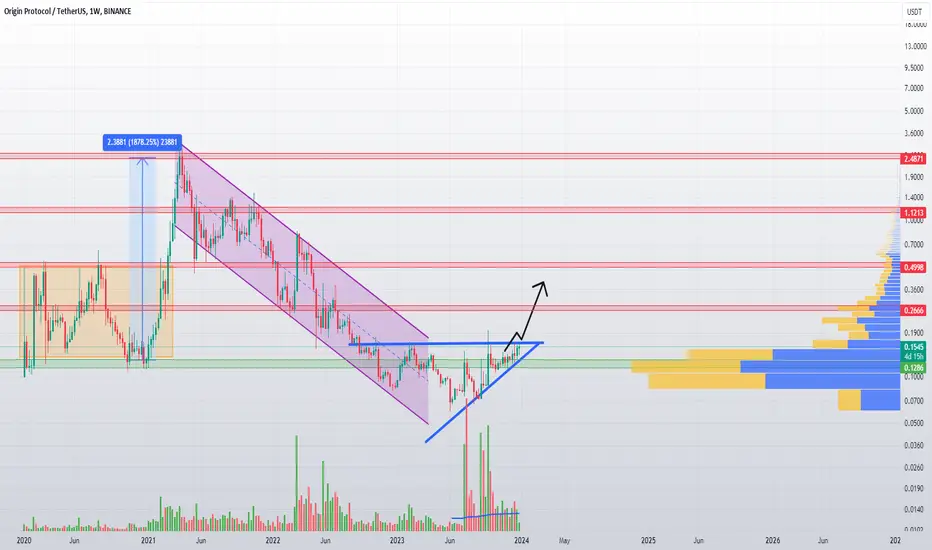
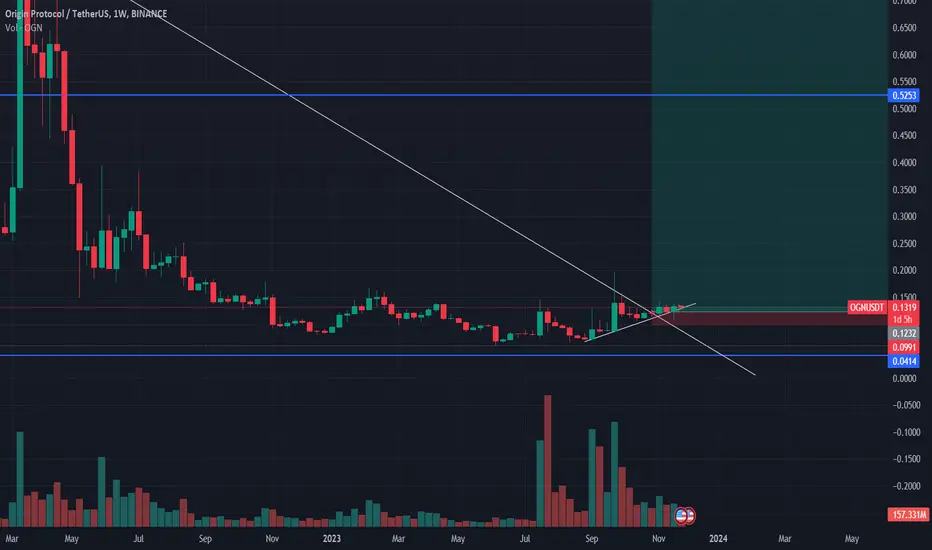
OGNUSDT 1W LONG📈Happy New Year, everyone. Timeframe 1 week. OGNUSDT, after declining in a descending channel by approximately 98%, returned to the previous accumulation zone. There was a stop/surrender zone. Now a rising wedge has formed. Growing volumes. I’m considering entering spot now, as well as going long during a breakout/retest. Marked goals and levels on the chart.
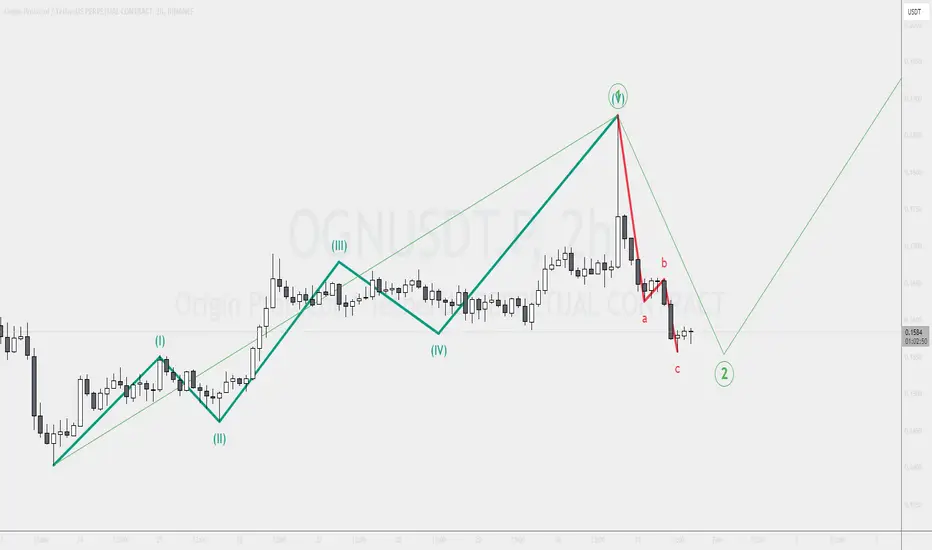
OGNUSDT Elliott Wave CountRight now, OGNUSDT has completed the ABC corrective pattern based on the Elliott Wave theory. We strongly expect a continuation of an emerging uptrend, specifically there should be the next and strongest wave-3 to the upside. We have already shared OGNUSDT in our channel for a major uptrend.
Long setup for OGNUSDT.Pthere are two consolidations that occur forming a descending broadening and falling wedge setup in the picture, the profit target is quite large.

OGNUSDT View on Projected 150% UpsurgeOGNUSDT exhibits a clear uptrend pattern with consistent higher highs (HHs) and higher lows (HLs). The price maintains respect for the uptrend trendline, with the Demand/Supply zone transitioning into a reliable support area.
Our perspective suggests a substantial potential price increase for OGN, positioning it as one of our top coins for investment currently. Not financial advice, but our view indicates the potential for over a 150% surge in the coming months.

OGN/USDT Ready for Next Bull Run? 👀🚀OGN Analysis💎 Paradisers, focus your attention on #OGNUSDT, as it's navigating an intriguing path in the market. The asset indicates a significant potential for a bullish trend from its current demand zone.
💎 A closer examination of #OriginProtocol's recent market activities shows a downward trend. Having encountered resistance at $0.197 and experienced a pullback, OGN is now seemingly ready for a bullish ascent from the demand zone at $0.158. If OGN can maintain its position above this level, it may set its sights on the next key supply level at $0.28.
💎 However, in the ever-changing crypto market, #OGN traders must be ready for a variety of scenarios. If OGN faces difficulties in sustaining its momentum at this demand level, a tactical shift towards a bullish rebound from a lower support level at $0.0919 might be necessary.
💎 A decline below this support level would prompt a strategic reassessment, potentially signaling challenges in maintaining a bullish market direction.
💎 Stay vigilant and adaptable, Paradisers. Your ParadiseTeam is committed to providing you with the latest insights and strategic advice, ensuring you are well-equipped to navigate these market shifts.

OGN on fire soon !OGN / USDT
Price is forming huge IH&S also a breakout-retest from massive falling wedge is spotted
Looks so bullish in HTF
Best of wishes

OGN/USDTNYSE:OGN is looking good in a daily chart, after flipping the zone in red take an entry and then enjoy. Always use stop-loss. Everything is on the chart
Trust
@TheCryptoCity1
#BTC Luna Bitcoin ETFs CRYPTOCAP:SOL CRYPTOCAP:DOT #Avive BCBA:ROSE CRYPTOCAP:MATIC

OGN USDT BULLISH Ognusdt moved too much today we gave signals in our channel for buying from the level of 0.1272 and now its on 0.1485
1. reason for buying is that alts reason is gonna start

OGNUSDTBINANCE:OGNUSDT Long idea
⛔"Daily crypto market analyses I provide are personal opinions & not financial advice. Trading carries risks, so do your own research & seek advisor's help.#DYOR"
Don't forget to like and comment
OGNUSDT SPOTOgnusdt has potential to go top level in upcoming months and it will be good spot buying to gain and double your portfolio , reason for buying is break out of trendline and it is following up trend from last many weeks
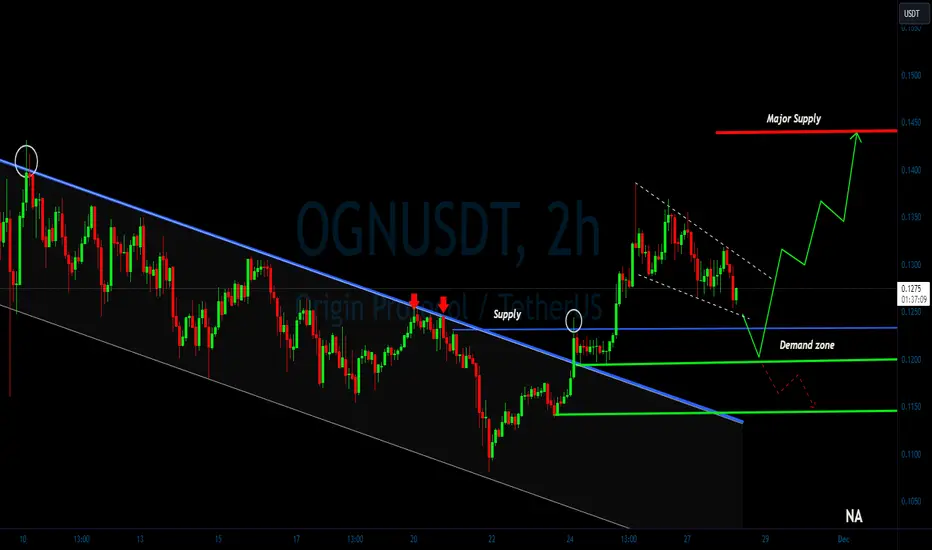
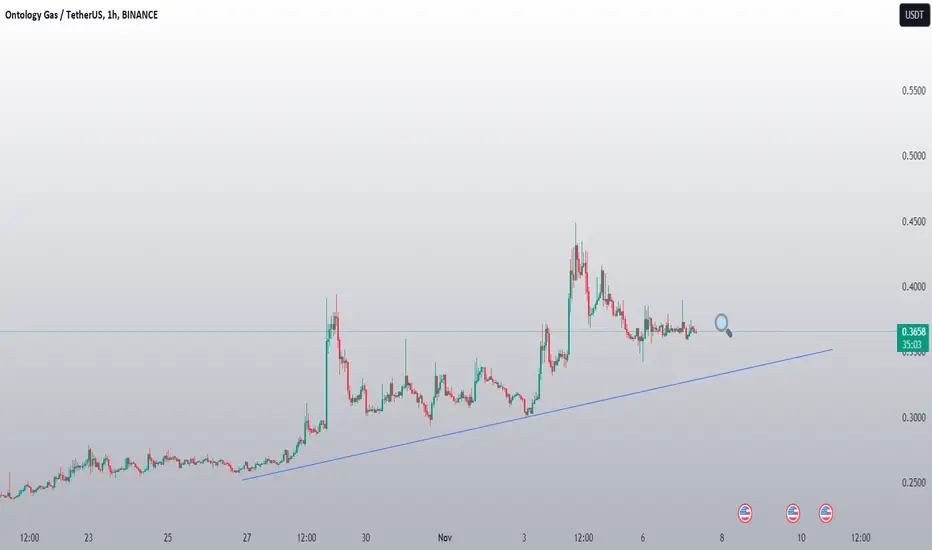
OGN/USDT Upward Move from demand zone? 💫 OGN Today analysis💎 Paradisers, observe OGNUSDT as it showcases a notable pattern, indicating an increased probability of an upward movement from the demand zone.
💎#OntologyGas has consistently followed a descending channel pattern, breaking above it to commence an upward trend. Currently, after experiencing rejection from the upper supply level, It is displaying a heightened likelihood of an upward movement from the lower demand zone. With this ongoing potential for upward momentum, NYSE:OGN is set to target the supply level at $.1438.
💎 Additionally, for #OGN traders, stay vigilant for a potential downward move if it breaks below the demand zone at $.1200.
💎 In this dynamic and constantly shifting market landscape, strategic insight and adept decision-making are key. Crafting a well-rounded trading strategy, which includes effective money management and an in-depth understanding of support and resistance levels, is crucial for achieving successful trading outcomes. 🌴💰
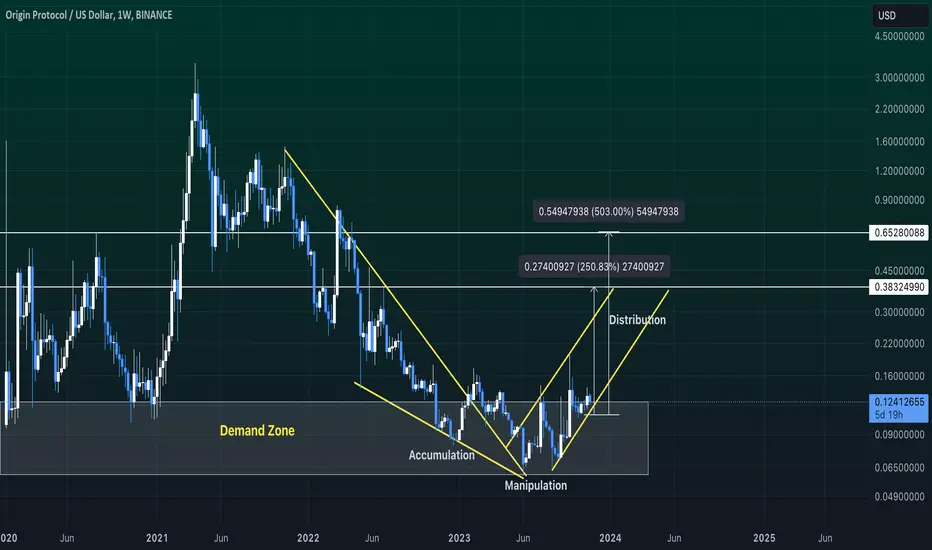
OGN upcoming breakoutOGN is still in the accumulation zone after exiting the manipulation phase.
Entry Zone: 0.10 - 0.11
Short-term Sell Zone: 0.37 - 0.40 (return 250%)
Mid-term sell zone: 0.60 - 0.65 (return 500%)
OGN SHOWS VOLUME INCREASEThank you for reading this update. Please remember that this is not advice
Depending on our study we see that OGN has a good chance of volume increase.
This update depends on the day trading, the price action can increase in the coming time, and the market will show which targets this coin can increase.
* This updates depending on day trade, and it's possible that we can see an increase, and after that a return since it's crypto.
Bulls Arrived For Origin Protocol (OGN)Hi dear members, hope you are well and welcome to the new update on Origin Protocol (OGN).
The recent trade signal for OGN:
Before starting the analysis of Origin Protocol, I would like to share with you my most recent trade signal for OGN, which I shared on 14th Sep 2023. That was a harmonic bullish reversal Gartley move, which Origin Protocol formed on a 4-hour time frame, and recently it has begun a successful bullish reversal form the potential reversal zone of this move.
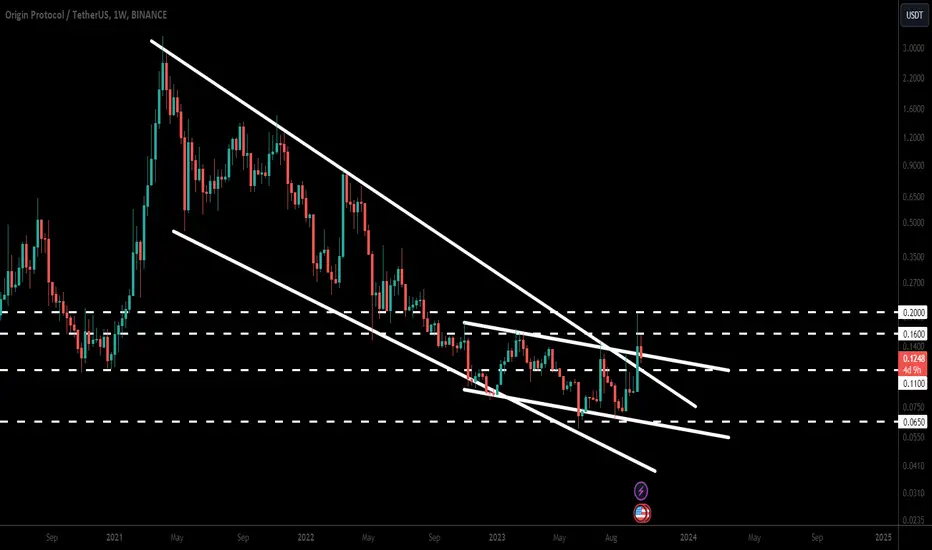
Formation of huge wedge:
on a 7 days time frame chart, the price line of OGN was moving in a huge falling wedge pattern. The resistance of this move was multi years based, because this resistance was found in the month of April 2021. Now recently in the 4th week of September 2023, OGN has broken out the resistance of this big falling wedge pattern.
Big down channel and key resistance:
While the price and of OGN was moving inside the big falling wedge, at the same time it from Oct 2022, it started farming another down channel on the same weekly time frame chart. Now after the breakout from the big wedge, the priceline is struggling to break the resistance of this channel and a key resistance of $0.20.
Targets:
As OGN token has already broken out if very big falling wedge pattern, therefore, now there is a very high probability that soon it may also break out the next down channel as well. The priceline has already spiked very close to the target of the down channel, which is almost at $0.20, and the final technical target for the breakout from a big wedge pattern is approximately at $3.50.
Conclusion:
Origin Protocol is in down trend since April 2021. Now recently it has broken out a very big falling wedge, and If It also breaks out the down channel then it will be a quite firm confirmation that now this long down trend will be completely changed to the up trend.
OGNUSDT Analysis: What's Next For Original Protocol? 👀 💎OGNUSDT is currently anchored within a demand zone, signaling possible upcoming trajectories.
💎Looking back, OGNUSDT experienced a trendline break, steering it downward. Yet, its resistance at the supply zone coupled with the establishment of an equal low has set the stage for a potential bearish turn.
💎Now, as it finds its footing in the demand zone, a sustained momentum could propel OGNUSDT toward the looming resistance. Conversely, if it slips through this zone, it might find a foundation and embark on a bullish journey from the rising trendline.
💎A pivotal element to monitor is the Bullish OB line, which has consistently offered support. If Origin Protocol dips below this line, a decline to the marked region might be on the horizon.
💎Optimize your OGNUSDT trading strategies with ParadiseFamilyVIP. Immerse yourself in detailed insights on Origin Protocol and other promising tokens, and enhance your crypto profits.

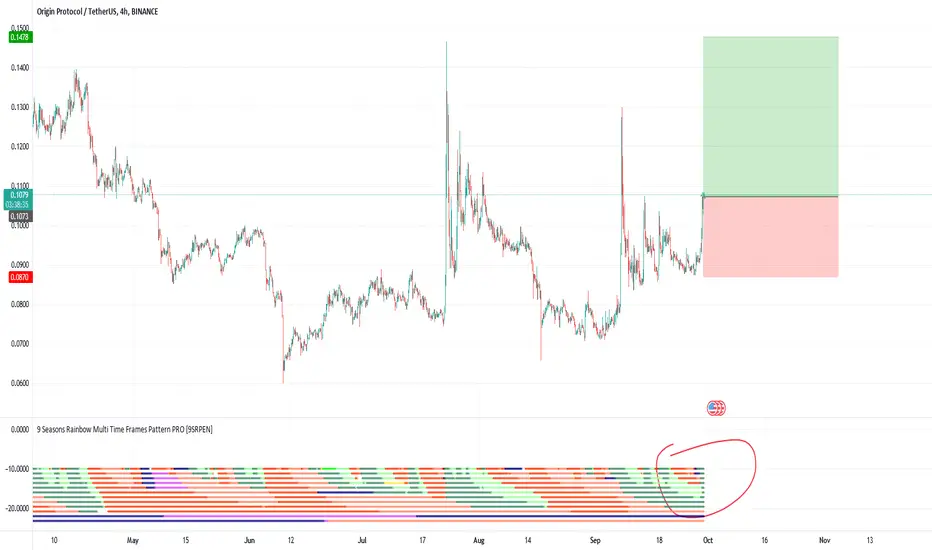
OGN OGNUSDT Origin Protocol Long Opportunity Sep 29Signal: Red - Blue -> Green
Context: Green
Bottom Structure Break out
Risk-Reward: 2
DISCLAIMER
This is only a personal opinion and does NOT serve as investing NOR trading advice.
Please make your own decisions and be responsible for your own investing and trading Activities
OGN buy setup FOR UPCOMING WEEKOGN may pump from 0.09 level to 0.1050 or higher
MARKET looks okay at this moment , so ling will be better this time.

OGN ANALYSIS (1D)The ogn seems to be inside a large diametric. We are now in the f wave of this diametric. The f wave has become a contracting triangle. Now we seem to be in wave c of this contraction triangle. Such moves can almost be expected from ogn.
For risk management, please don't forget stop loss and capital management
Comment if you have any questions
Thank You

OGN/USDT explosive upward journey? 👀 🚀 Origin Protocol
💎Paradisers, take note! #OGNUSDT is currently in a demand zone and appears poised for a bullish ascent👀
💎 Over the past few days, #OGN been trading within a specific range. It previously faced resistance at a short-term bearish order block around the $0.0834 level. Now, with renewed upward momentum, it's likely to challenge that resistance once more.
💎 Keep an eye on the supply zone and bearish order block confirmed on higher time frames the price is expected to address these levels soon. Should the price break below the demand zone and key support, be prepared for a potential -7.18% drop.
💎In the dynamic world of crypto, staying informed and adaptable is key. Stay tuned for more updates and enjoy your trading journey.

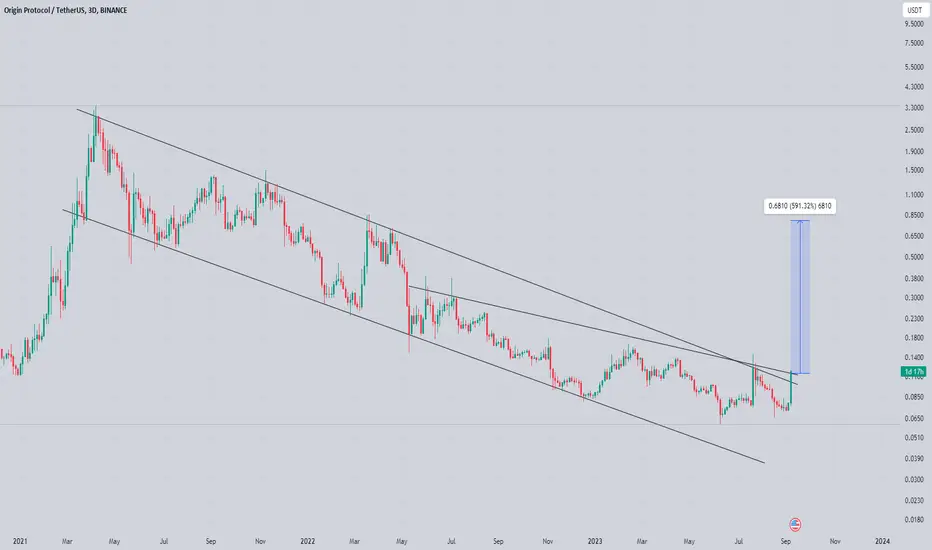
Ogn Looking Bullish Seems Like Getting Ready for Massive Recovery
Formed Text Book Descending Channel In 3 Days Tf And Breaking It With Massive Volume While Testing Another Trendline Once Both Got Cleared Recovery Will Be Massive
Incase Of Successful breakouts Expecting Move towards 0.80$ In Midterm
OGN target 0.134~0.142h time frame
-
OGN creating a symmetrical triangle structure.
Next retesting will be a good entry around 0.101~0.107
Open long once getting support again there.
TP: 0.134~0.14
SL: 0.098
