OGN's Price Surge: Riding the WaveAs the cryptocurrency landscape continuously evolves and expands, the Origin Protocol (OGN) has caught the attention of traders and investors alike with a breathtaking rally. In the past 24 hours, the digital asset has surged by an astounding 61%, establishing its market price at 0.1202. This seismic activity in OGN's price movement has not only turned heads in the market but also ignited a spark of anticipation amongst its followers.
Examining the asset through a four-hour timeframe chart provides a fascinating glimpse into its journey. The Fibonacci retracement levels, a crucial tool for predicting potential support and resistance levels, plots a promising path for OGN. It has effortlessly exceeded its first Fibonacci level at 0.0888 and is now ambitiously eyeing the 1.618 level, which stands at 0.0977.
This bullish rally doesn't seem to show signs of slowing down, as the Origin Protocol could potentially ascend to the 2.618 level at 0.1121 in the near future. If the bullish momentum persists and the 3.618 level at 0.1265 is breached, the 4.236 level at 0.1354 will be the next goalpost on OGN's upward journey.
A glance at the Bollinger Bands reveals that OGN's current trading price is comfortably above the middle band at 0.0815. This middle band could serve as a stronghold of support if the market corrects. The upper band, currently set at 0.1044, has been eclipsed by the recent price movement, reaffirming the strength of the ongoing trend. Meanwhile, the lower band at 0.0585 seems a remote possibility at present.
However, the surge has placed OGN in a precarious position, according to the Relative Strength Index (RSI). With a reading of 93, it's apparent that OGN is in an overbought state. History suggests that assets tend to retreat from such lofty RSI levels, indicating the potential for a future price correction.
Despite the looming shadow of a potential correction, the volume oscillator presents a rather upbeat picture at 57%. The stochastic index echoes this positivity, with a reading of 86%, indicating a robust bullish sentiment permeating the market. The Moving Average Convergence Divergence (MACD) at 0.0054 further attests to this bullish phase, suggesting the market is currently dominated by buyers.
The On-Balance Volume (OBV) presents a final piece to this puzzle. Sitting at an impressive 2.138 billion, the OBV highlights the significant volume flowing into OGN, providing a sturdy foundation for the current bullish phase.
While the meteoric rise of OGN has instilled a sense of exhilaration amongst its followers, caution is advised. The overbought conditions, as indicated by the RSI, suggest that the market could be due for a correction. If the bullish sentiment loses steam and the buying volume dwindles, OGN may experience a price pullback.
However, if the bullish fervor remains unscathed and the influx of volume is sustained, we could witness OGN painting new highs on the charts. As with all investments, risk management is key. Always remember not to invest more than you're willing to lose and to conduct your research before making any investment decisions. After all, in the volatile world of cryptocurrencies, fortune favors the well-prepared.
OGNUSD

OGN Price PredictionOGN price, forming reversal head and shoulder pattern, which the formation it might ends in the middle of march.
Then we can see, bounce from the lows of 0.13 cents until 0.25 cents for the begining of an upside leg.
If we stay above the 0.25 cents as support, we then can see more upside legs froming until 0.37 ~ 0.45 as you can see in the chart.
RSI remaining fro the time being, near oversold area.
This can be good time to buy!

Origin Protocol (OGN) formed bullish BAT for upto 28.50% pumpHi dear friends, hope you are well and welcome to the new update on Origin Protocol (OGN).
Previously we caught more than 106% pump of OGN as below:
Now on a 4-hour time frame, OGN with Bitcoin pair has formed a bullish BAT move.
Note: Above idea is for educational purpose only. It is advised to diversify and strictly follow the stop loss, and don't get stuck with trade

OGN CAN GO UPPERHi, dear traders. how are you ? Today we have a viewpoint to BUY/LONG the OGN symbol.
For risk management, please don't forget stop loss and capital management
When we reach the first target, save some profit and then change the stop to entry
Comment if you have any questions
Thank You

60% for OGNOGN has a beautiful engulfing bullish 2D candle, RSI looks also good, overall situation can be described as a local bottom. I am taking risk there with some position.
MANAGE YOUR RISK,
NOT A FINANCIAL ADVICE

OGNUSDT My favorite cryptocurrency👌❤My prediction is definitely an upward trend for the desired currency.
Friends who want to invest can have this currency in their portfolio.
I emphasize that the analysis was done with several styles and I can safely say that 2023 will be the golden year of the digital currency market.
Origin OGN MonsterIt's been in a hard accumulation for a long time.
Expecting a big pump till 0.42$ at least.
Daily RSI made a plateau, trying to break up.
SL 0.15$
OGNUSDT forecast and idea!Please write any advice or suggestions.
Dear friends, request any cryptocurrency pair, currencies pair for forex, and any index that you want to be analyzed and ask any questions.
Thanks for your attention
OGNUSDT

OGN/USDT - Potential Short ScenarioHello Traders!
OGN price is currently consolidating in a narrow range of $0.1900 - $0.2750.
Using the analysis of higher timeframes, it is possible to assume another wave of decrease. In this case, it is possible to consider medium-term purchases in the range of $0.1100 - $0.1525.
The targets for such purchases will be the levels of $0.2750 and $0.4500.
Good luck and watch out for the market
P.S. This is an educational analysis that shall not be considered financial advice

OGNUSDT 1d ANALYSISThere is a fork in the road between the two.
<1>It is a perspective that goes up with support for a low point that has never been broken.
<2>The view is that it breaks the low point and goes down more after the retest when 1d is completed.

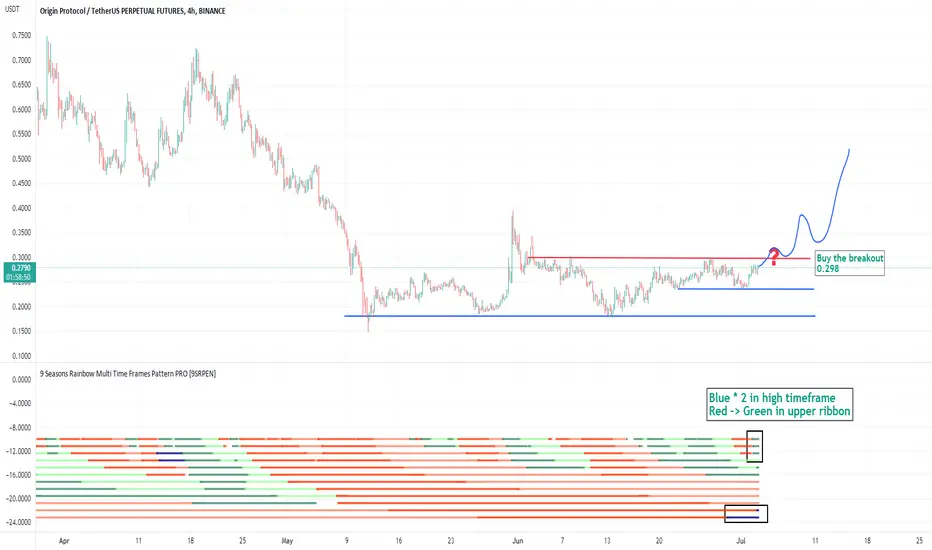
OGN BUY THE BREAKOUTBlue * 2 in high timeframe
Red -> Green in upper ribbon
BUY the breakout
ORIGIN PROTOCAL, OGN, OGNUSD , OGNUSDT , CRYPTO,CRYPTOCURRENCY
DISCLAIMER
This is only a personal opinion and does NOT serve as investing NOR trading advice.
Please make your own decisions and be responsible for your own investing and trading Activities.
OGN/USDT #OGN/USDT 10-20X LONG
OGN/USDT looks good on 4HR time frame moving along rectangular support price has taken reversal several times from this region. Currently in Fib Golden Pocket. POC is also aligning with in the demand zone
◼️Entry: $0.2752 - $0.2681
🟢 Target 1 : 0.2770
🟢 Target 2 : 0.2880
🟢 Target 3 : 0.2988
🟢 Target 4 : 0.3059
🟢 Target 5 : 0.3270
🛑SL : 0.2437
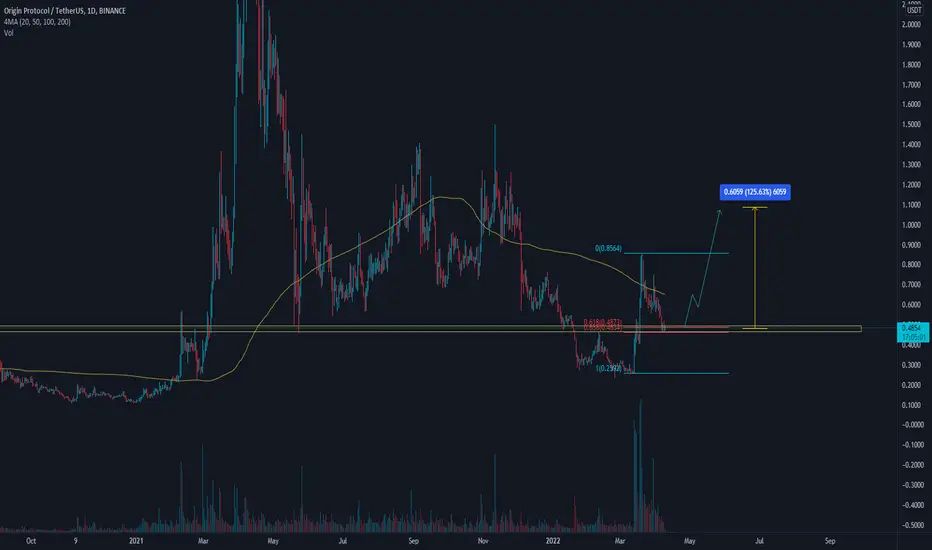
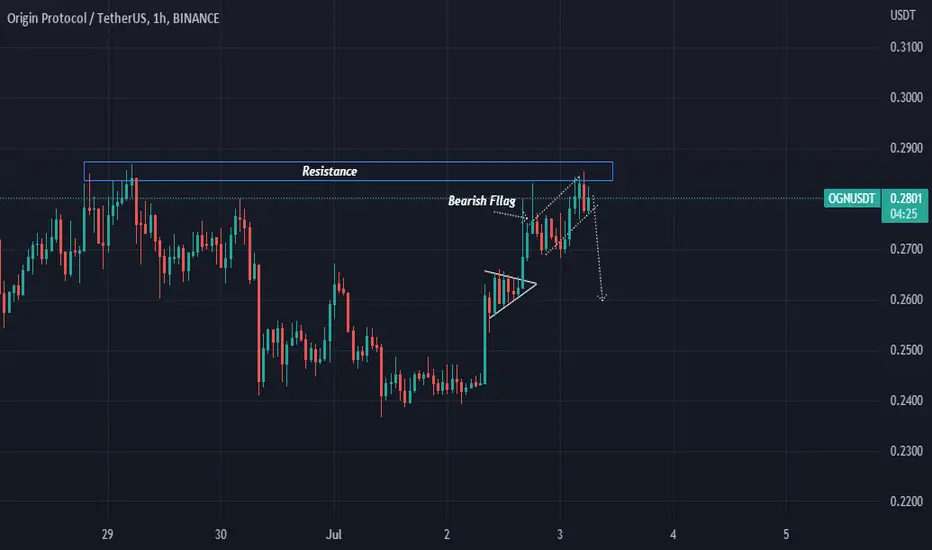
ORIGIN PROTOCOLOGN/USDT Strong Resistance zone forming Bearish Fllag waiting to drop Down in SHORT on this Coin
OGN/USDT BUYING SETUP (SWING) OGN has retest on resistance become support area, potential continue upward movement
very interesting at weekly RSI showing bullish divergence
Just hold i think can 50-100%
Buy zone : 0.238 - .22
Target : 0.2703 - 0.2984 - 0.3284 - 0.3987 - 0.5
Stop : 0.215

OGN is Good on Daily chartHello , Guys Look at chart and decide
OGN is targeting the white targets on the chart specially the Yellow one next days .
It is not a financial advice and plz DYOR.
Good luck

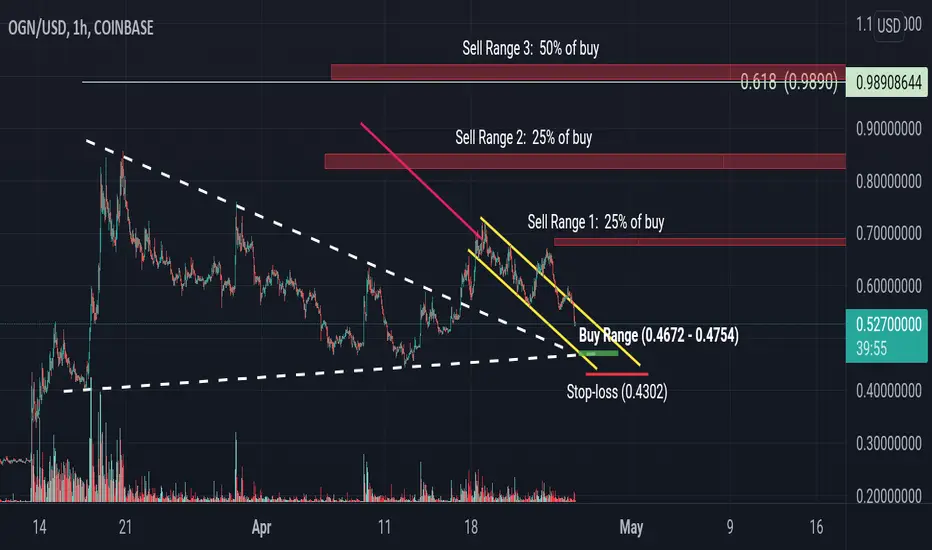
OGNUSD - 1H - Long with +108% potentialGood Morning everyone,
This week I will be sharing a breakdown of a trade I intend to take with Origin (OGN).
With OGN we currently have a couple of exciting things happening amongst multiple timeframes.
The most recent development on the 1Hr chart is the formation of a Distribution Channel, shown on the chart in yellow.
We also have some longer-term trend lines shown as two white, dashed lines on the chart. These can be interpreted any one of many ways. I see either a symmetrical triangle or long term support and resistance trend lines. Whichever way you see them, price action finally broke the resistance on April 17th.
We've had one retest of this resistance line but I believe we will see another very soon.
This now takes us to our buy range. If you notice, this is the intersection of 3 points that consist of patterns/setups that are still in play (the triangle and the distribution). That is why our buy range is set here.
The chart is pretty self explanatory with one important caveat. If the price breaks through the buy range and continues downward then this trade is invalidated and you should hopefully have a stop loss set somewhere around mine. If the price touches the buy range (where you will open your long) and continues back upward, then we have a valid setup. Either way, your stop needs to be set to the same value.
Our first sell point is what I call a shoe-in, meaning it's an easily obtainable level to ensure I take some profits along the way during trades. I set this level just below the most recent resistance price level. So if our trade plays out like we think it will, then obtaining this take profit level is almost guaranteed.
Our second sell point is similar to the first, but it is set just below the more prominent resistance level of the beginning of the triangle (or longer term resistance trend line for others).
Lastly, our top sell point is the 0.618 Fibonacci Retracement from the 1Week timeframe. We chose this level because OGN has been able to hit this goal multiple times. Always incorporate daily or weekly Fibonacci trends in your potential trade setups for more accurate take profit levels.
Now, the recap for the TL;Dr'ers!
The buy range is 0.4664 - 0.4749.
The stop loss is 0.4302.
1st take profit/sell 25% is 0.6750. (+42% profit)
2nd take profit/sell 25% is 0.8224. (+73%)
3rd take profit/sell the last 50% is 0.9890. (+108%)
Happy hunting, you animals!
*** Like what you've read? Check back every week for new updates on trade setups, educational lessons, and more! ***
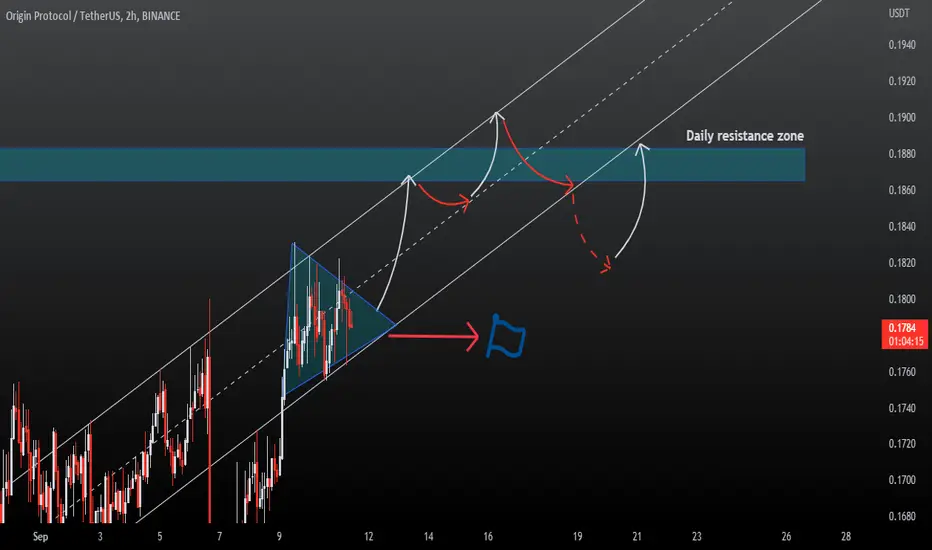
Will OGN continue its uptrend? - Here's the entry levelHere's a quick look at the OGN 2 hr chart. As we can see, the price broke out previously from the bull flag and is now trying push further to the upside. If you didnt catch the immediate breakout form the bull flag, Then the best entry would be when the price breaks above 0.66$ with good amount of volume. Definitely one to keep an eye on!
-------------------------------------------
The idea is: Buy when the price breaks above 14.4$ and take profits at the levels shown in the chart.
Targets:
1. 0.68$
2. 0.72$
3. 0.76$
-------------------------------------------
What Is a Wedge in the context of trading?:
"A wedge is a price pattern marked by converging trend lines on a price chart. The two trend lines are drawn to connect the respective highs and lows of a price series over the course of 10 to 50 periods. The lines show that the highs and the lows are either rising or falling and differing rates, giving the appearance of a wedge as the lines approach a convergence. Wedge-shaped trend lines are considered useful indicators of a potential reversal in price action by technical analysts.
Key Takeaways for Falling wedges:
1. Wedge patterns are usually characterized by converging trend lines over 10 to 50 trading periods.
2. The patterns may be considered rising or falling wedges depending on their direction.
3. These patterns have an unusually good track record for forecasting price reversals."
-------------------------------------------
If you like the content, then make sure to comment and like the post :D
Follow me for daily profitable trading setups
BTC dictates the market. If BTC falls, then Alts will fall as well. Trade safe!

TWH - Which coins have pumped and which have dumped?Traders,
Overall our list is doing excellent! Many coins have pumped and many coins have yet to pump. Only a few have dumped and even the dump is really not that significant other than to take the coins out of prime setup.
These coins have pumped and no longer have high potential. I've had to remove them from my list. Congrats to those of you who were in these trades!
OGN
ZRX
KNC
These coins have pumped and I have left them on the list because they still have more to go. Congrats to those in these trades:
WLUNA
SKL
BAL
SNX
EOS
AAVE
APE
These coins have yet to pump but are positioned to do so soon:
CULT
CHZ
LCX
COMP
FOX
And these are the dumpers:
BCH
SHIB
DOGE
ETC*
ETH**
Quick note: Dump is probably too hard of a word. These coins have simply fallen out of prime setup territory.
* I didn’t take ETC out of the list in the video but I should have. That’s why it’s here.
**I overlooked ETH in the video too. It has fallen below the 50 day ma.

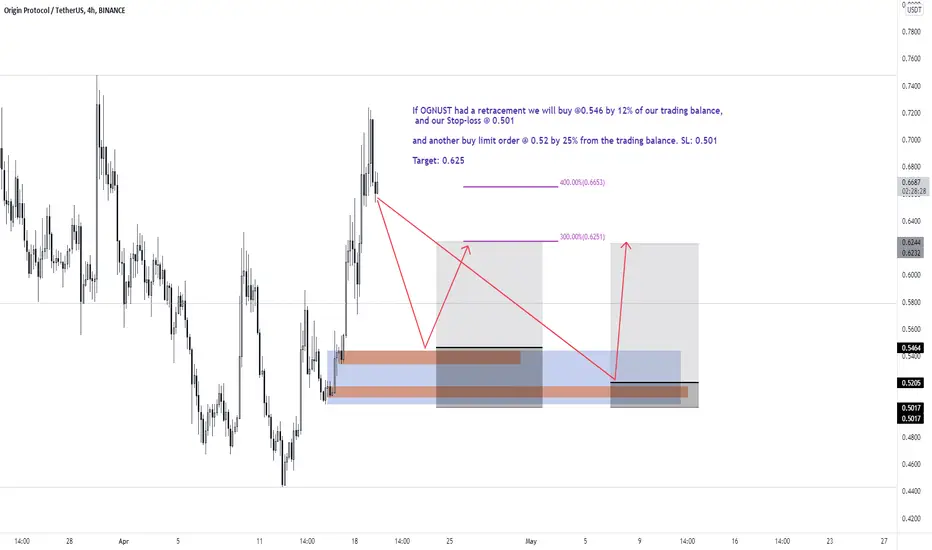
OGNUSDTIf OGNUST had a retracement we will buy @0.546 by 12% of our trading balance,
and our Stop-loss @ 0.501
and another buy limit order @ 0.52 by 25% from the trading balance. SL: 0.501
Target: 0.625
$OGN WILL FLY 👀$OGN broke the bull flag with a big bullish candle supported by volume, we might see a +20% move starting from this week.
Origin was founded in 2017 by successful Silicon Valley entrepreneurs and has a team of experienced engineers from iconic tech companies like YouTube, Google, PayPal, and DropBox.
OGN - LONGHey Guys, my thoughts on OGN. Could be a nice opportunity for a long term trade. I get in after the breakout.
No financial advice!
DYOR!
Happy Trading
OGN/USDT is bullish ! 💎Long OGN on this Fibo level ! 0.618 as support !
Long Entry : 0.48 - 0.47
short term : 0.5556 - 0.5754 - 0.6178
mid term : 0.6488 - 0.7033 - 0.7823 - 0.8546
long term : 0.9444 - 1.03 - 1.08
Enjoy !