USOIL Is Bearish! Short!
Please, check our technical outlook for USOIL.
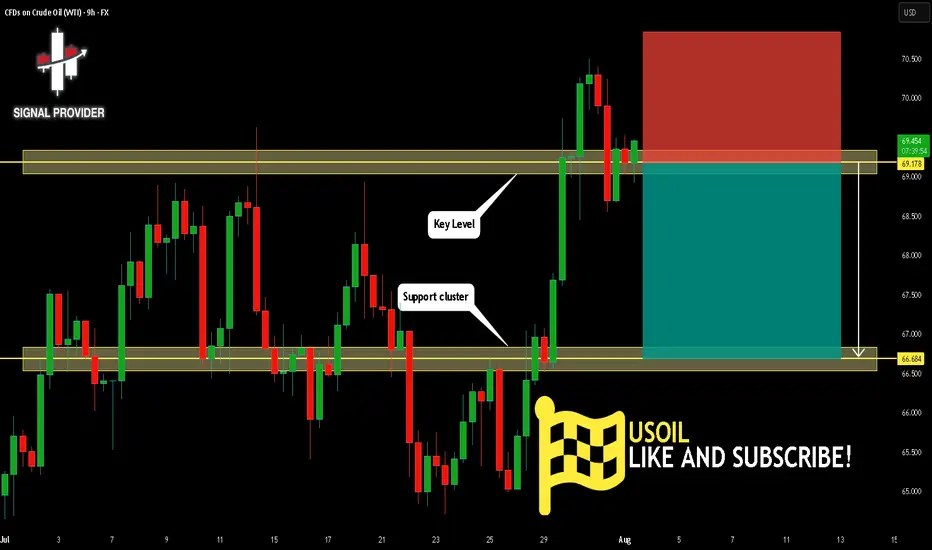
Time Frame: 9h
Current Trend: Bearish
Sentiment: Overbought (based on 7-period RSI)
Forecast: Bearish
The market is approaching a significant resistance area 69.178.
Due to the fact that we see a positive bearish reaction from the underlined area, I strongly believe that sellers will manage to push the price all the way down to 66.684 level.
P.S
The term oversold refers to a condition where an asset has traded lower in price and has the potential for a price bounce.
Overbought refers to market scenarios where the instrument is traded considerably higher than its fair value. Overvaluation is caused by market sentiments when there is positive news.
Disclosure: I am part of Trade Nation's Influencer program and receive a monthly fee for using their TradingView charts in my analysis.
Like and subscribe and comment my ideas if you enjoy them!
Oil
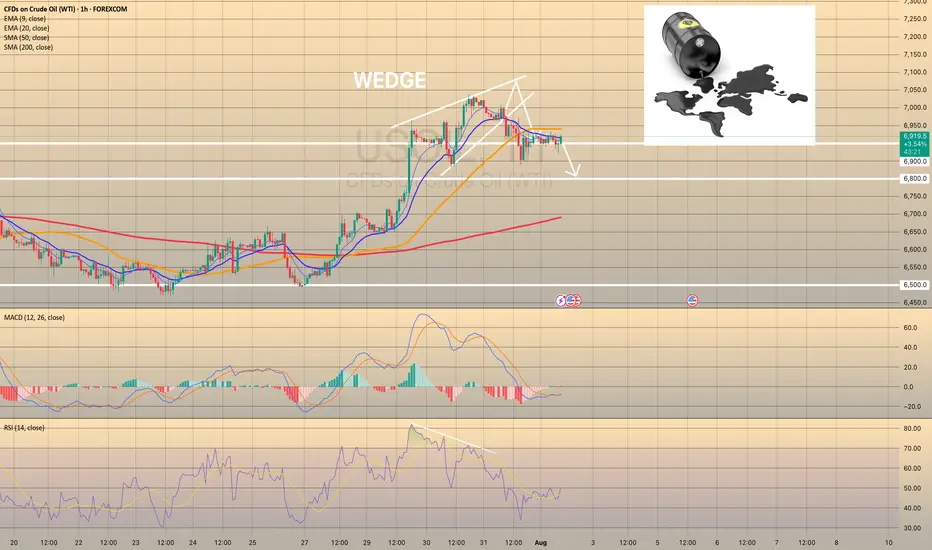
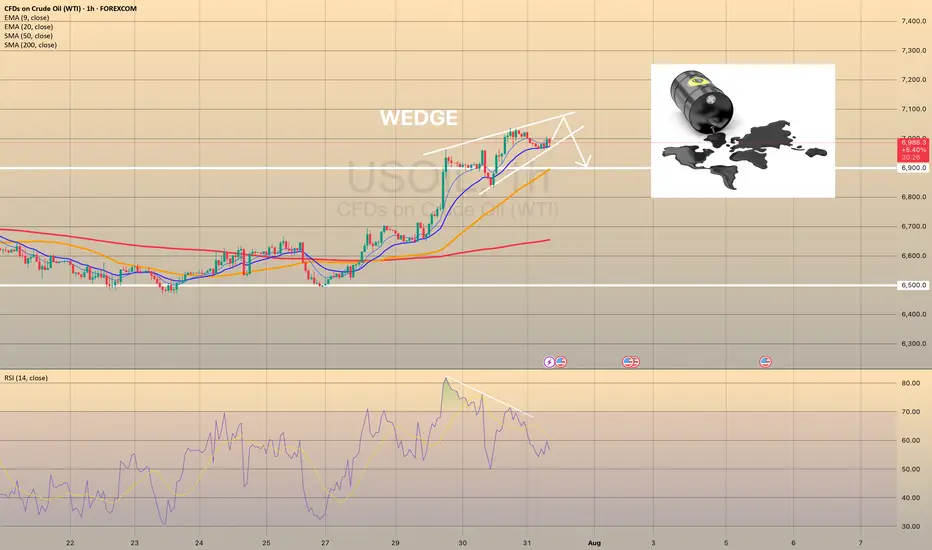
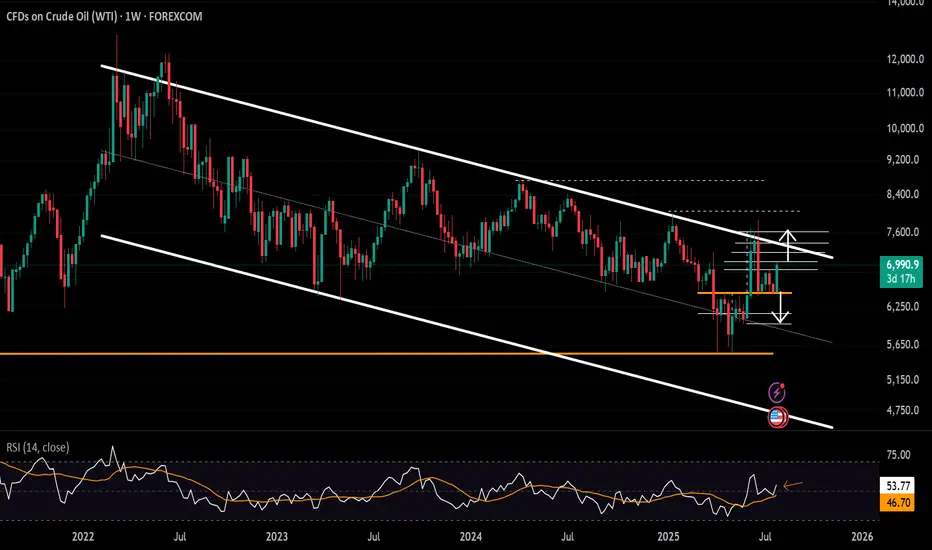
USOIL REACHED THE 6,900.00 SUPPORT LEVEL. WHAT'S NEXT?USOIL REACHED THE 6,900.00 SUPPORT LEVEL. WHAT'S NEXT?
As we told July 31, the price got reversed towards first support level of 6,900.00. Market participants are waiting for the OPEC+ meeting this week, expecting a significant output hike. Currently, the price sits slightly above the support level. Although, the asset trades above this level, considering the current weakness of the asset, further decline is expected. The 6,800.00 support level is the next target here.
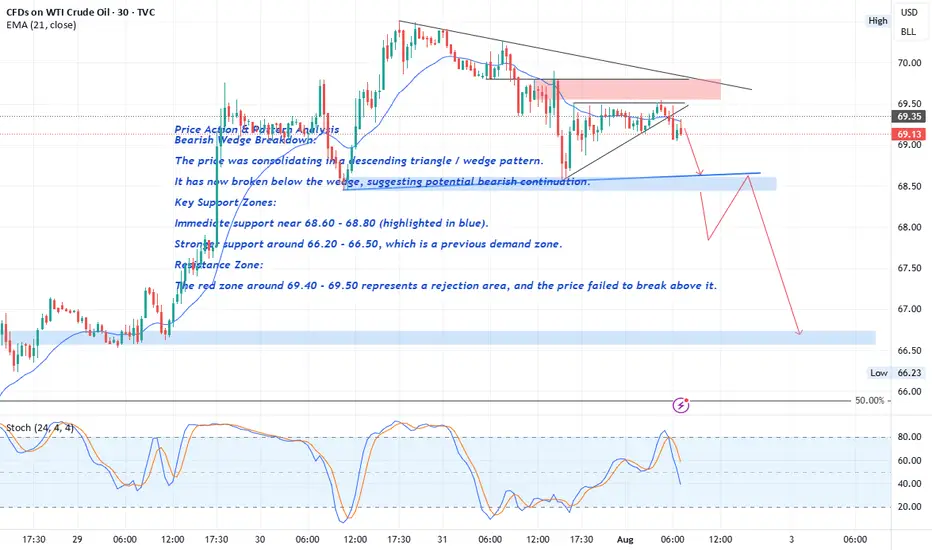
Crude Oil Price Action & Pattern Analysis
Bearish Wedge Breakdown:
The price was consolidating in a descending triangle / wedge pattern.
It has now broken below the wedge, suggesting potential bearish continuation.
Key Support Zones:
Immediate support near 68.60 - 68.80 (highlighted in blue).
FOREXCOM:USOIL
The break of the 68.60 level with a strong bearish candle would serve as confirmation of a Head and Shoulders (H&S) pattern , with solid bearish implications.
Stronger support around 66.20 - 66.50 , which is a previous demand zone.
Resistance Zone:
The red zone around 69.40 - 69.50 represents a rejection area , and the price failed to break above it.
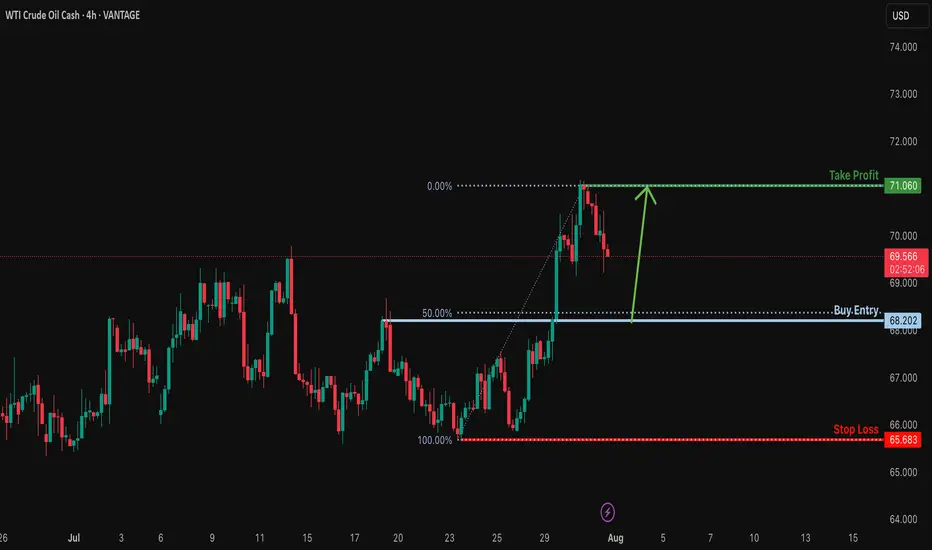
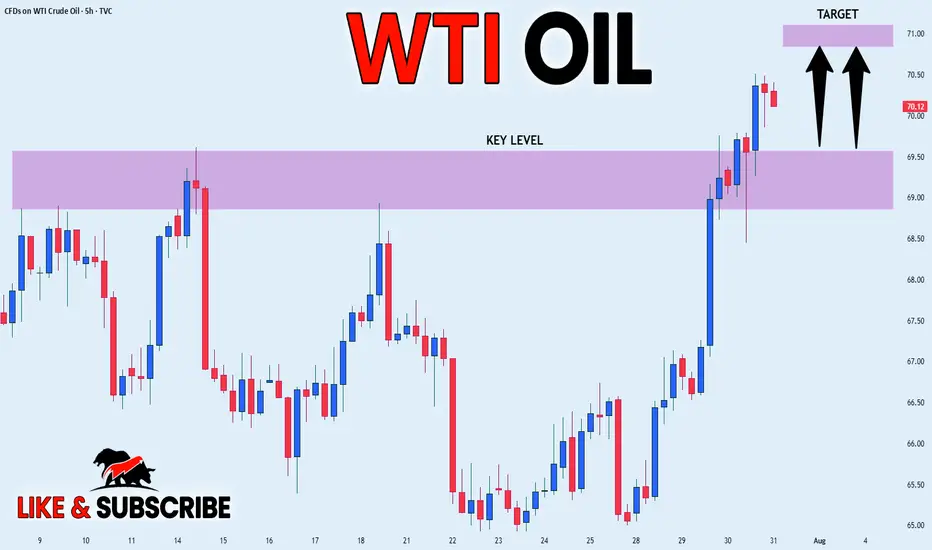
Bullish bounce off 50% Fibonacci support?USOUSD is falling towards the support levle which is a pullback support that aligns with the 50% Fibonacci retracement and could bounce from this level to our take profit.
Entry: 68.20
Why we like it:
There is a pullback support that lines up with the 50% Fibonacci retracement.
Stop loss: 65.68
Why we like it:
There is a multi swing low support.
Take profit: 71.06
Why we like it:
There is a swing high resistance.
Enjoying your TradingView experience? Review us!
Please be advised that the information presented on TradingView is provided to Vantage (‘Vantage Global Limited’, ‘we’) by a third-party provider (‘Everest Fortune Group’). Please be reminded that you are solely responsible for the trading decisions on your account. There is a very high degree of risk involved in trading. Any information and/or content is intended entirely for research, educational and informational purposes only and does not constitute investment or consultation advice or investment strategy. The information is not tailored to the investment needs of any specific person and therefore does not involve a consideration of any of the investment objectives, financial situation or needs of any viewer that may receive it. Kindly also note that past performance is not a reliable indicator of future results. Actual results may differ materially from those anticipated in forward-looking or past performance statements. We assume no liability as to the accuracy or completeness of any of the information and/or content provided herein and the Company cannot be held responsible for any omission, mistake nor for any loss or damage including without limitation to any loss of profit which may arise from reliance on any information supplied by Everest Fortune Group.
Is the surge in crude oil bulls here a comeback?The news-driven support for crude oil's recent rally is almost exhausted, so we'll continue to adopt a buy-low-sell-high strategy today, using a small stop-loss to maximize profits.
Short at $71.20, with a stop-loss at $71.70 and a take-profit at $69.20. (For aggressive shorting, try shorting at $70.95).
The above strategy is Charlie's personal opinion and is for reference only. If you follow suit, please be cautious and use a stop-loss to protect your position. TVC:USOIL FOREXCOM:USOIL TRADU:USOIL TRADU:USOIL
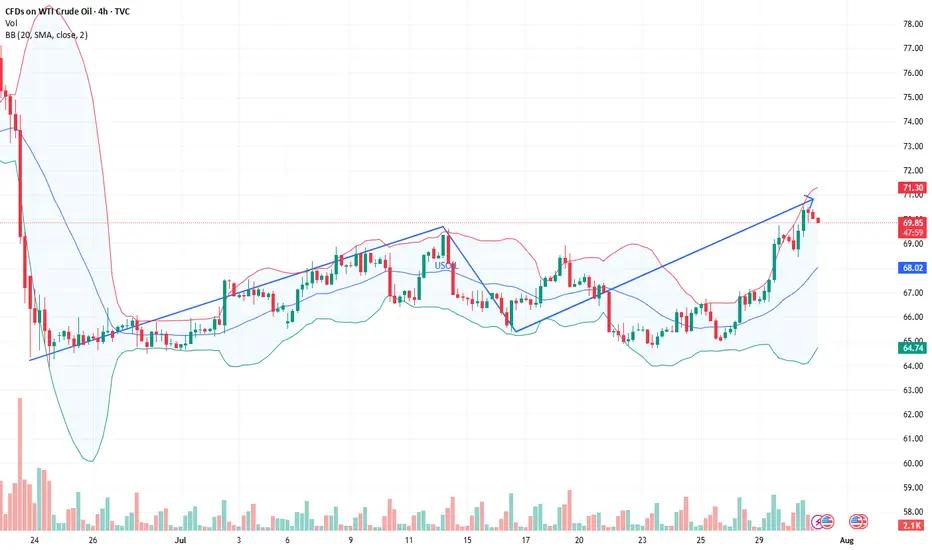
USOIL Technical Analysis – Black Mind Curve Breakout & Reversal🔍 Overall Market Context:
The current USOIL structure is a great example of market shift from compression to expansion, characterized by a breakout of the Black Mind Curve followed by a measured impulse move. This chart is not just reacting technically, but it reflects how institutional smart money manipulates curves, breaks minor structures, and then retests zones to refill orders before continuing directionally.
Let’s break the market psychology and price action phase by phase:
🔄 Phase 1: Black Mind Curve Breakout ✅
The Black Mind Curve represents long-standing supply pressure that had been capping price.
Its breakout marks a shift in market intention, often signaling the end of a distribution phase and beginning of a possible accumulation or re-accumulation.
Price broke above this curve cleanly with strong bullish candles, which also broke minor structure levels, confirming short-term bullish sentiment.
The breakout was also backed by momentum and volume as the market pushed 130+ pips upward—an aggressive impulse that trapped late sellers below.
📉 Phase 2: Retracement to Interchange Zones
Now, we’re in the retracement phase, where price is pulling back toward:
🔹 SR Interchange Zone ($66.80 - $67.30)
This zone was previous resistance, now flipping to support.
In MMC terms, this area is expected to serve as a refill zone where smart money will look to accumulate again after the breakout.
We are watching for confirmation candles or MMC-style reversal patterns here (e.g., inside bar breakouts, demand imbalances).
🔹 Main Zone ($65.80 - $66.50)
If the first zone fails, this is the next key demand base.
It holds historical value from previous accumulation phases (see July 10–25) and aligns with the origin of the last impulse.
Expect a sharper wick or deeper liquidity grab if price moves into this area.
📉 Phase 3: Final Defensive Zone – Major Support ($63.70 - $65.20)
This zone marks the last line of bullish defense.
A move here would mean the bullish structure is being reevaluated or absorbed by sellers.
However, if price hits this level, it could also attract significant institutional demand, setting up for a more powerful long-term leg up.
Reactions here are typically large and volatile, with a risk of fakeouts and fast reversals.
📈 Possible Scenarios (MMC Based Forecasting):
✅ Scenario 1 – Bullish Continuation (Primary Path)
Price finds support inside SR Interchange Zone.
Forms a base (MMC reversal structure) and pushes back to recent highs near $71.
Breakout above $71 opens room for next supply zones between $72.50 - $74.00.
⚠️ Scenario 2 – Deeper Liquidity Grab
Price breaks below SR Interchange and tests Main Zone for a deeper accumulation.
A wick or shakeout may happen before bullish continuation.
This trap zone could give the best R:R entry.
❌ Scenario 3 – Breakdown to Major Support
If both zones fail and bearish pressure sustains, price may revisit Major Support.
That would reset the bullish structure and require fresh MMC assessment.
🧠 MMC Logic at Work:
The curve break symbolizes the shift from supply dominance to a possible demand-led phase.
Minor structure breaks add fuel to trend shift and indicate participation from larger players.
Retracements are not weaknesses—they are refills for those who missed the move.
Smart money uses these zones and flips (SR interchanges) to hide in plain sight.
🎯 Key Takeaway for Traders:
This is a textbook MMC setup that combines:
Curve Breakout + Impulse
Zone Retest + Interchange Logic
Liquidity Engineering before Continuation
Traders should remain patient and observe reactions at each zone. Don’t chase—wait for the market to reveal its hand via MMC entry signals (break-of-structure, bullish engulfings, imbalance fills, etc.)
USOIL BULLS ARE STRONG HERE|LONG
USOIL SIGNAL
Trade Direction: short
Entry Level: 67.26
Target Level: 68.46
Stop Loss: 66.46
RISK PROFILE
Risk level: medium
Suggested risk: 1%
Timeframe: 1h
Disclosure: I am part of Trade Nation's Influencer program and receive a monthly fee for using their TradingView charts in my analysis.
✅LIKE AND COMMENT MY IDEAS✅
Oil prices rebound, maintain bullish attitude
💡Message Strategy
International oil prices continued their upward trend on Thursday, closing higher for the fourth consecutive day, as concerns about growing global supply tightness abounded. Brent crude for September delivery rose 0.4% to $73.51 a barrel, while West Texas Intermediate (WTI) crude for September delivery rose 0.5% to $70.37 a barrel, while the more active Brent October contract rose 0.4% to $72.76 a barrel.
Recently, the market has focused on the statement of US President Trump, who demanded that Russia make "substantial progress" on the situation in Ukraine within 10-12 days, otherwise he would impose 100% secondary tariffs on its trading partners, significantly bringing forward the previous 50-day deadline.
Inventory data suggests a continued struggle between supply and demand. Data from the U.S. Energy Information Administration (EIA) showed that U.S. crude oil inventories unexpectedly rose by 7.7 million barrels to 426.7 million barrels in the week ending July 25, far exceeding expectations for a 1.3 million barrel drop. However, gasoline inventories fell by 2.7 million barrels to 228.4 million barrels, exceeding market expectations for a 600,000 barrel drop.
📊Technical aspects
From a daily perspective, WTI crude oil prices have closed higher for four consecutive days since rebounding from the $66 level. It is currently running stably above the integer mark of $70 per barrel. The short-term moving average system is in a bullish arrangement, and the MACD indicator remains above the zero axis, indicating that the bullish momentum is still strong.
From an hourly perspective, if the price breaks through the previous high of $70.50, it is expected to further rise to the $73.50-$75 range. Conversely, if it continues to fall below the $70 mark, it may trigger short-term profit-taking, and further support will focus on the $68.50 level. Overall, the short-term trend remains bullish.
💰Strategy Package
Long Position:68.00-68.50,SL:67.50,Target:70.50-73.00

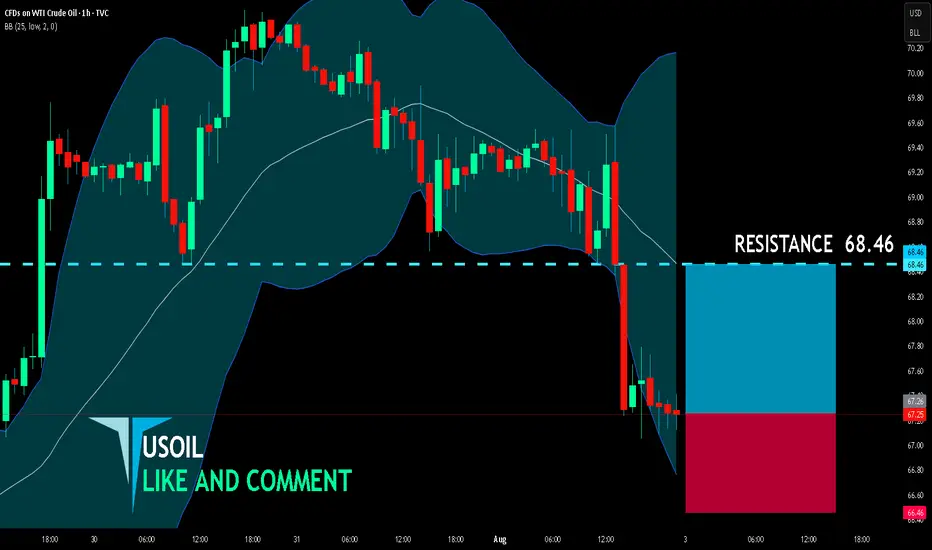
USOIL IS GOING BULLISH. FOR HOW LONG?USOIL IS GOING BULLISH. FOR HOW LONG?
Brent has started this week with a strong bullish momentum and holds near 6-week high on supply fears. President Trump announced plans to impose tariffs on Indian exports and penalize its Russian oil imports. In a parallel move, the US introduced its most extensive sanctions on Iran in seven years. The United States has even offered its oil to the world in exchange for Iranian and Russian oil, but there is evidence that the US production capacity is now at historic highs and is unlikely to grow in the near future.
However, technically oil shows us bearish divergence on RSI and bearish wedge here. The price may reverse towards 6,900.00 as a first target. EIA data showed US crude inventories jumped by 7.7 million barrels last week—the largest increase in six months and defying forecasts for a decline. Market participants are waiting for the OPEC+ meeting this week, expecting a significant output hike.
Crude Oil’s $70 Surge Still Faces 3-Year Channel ResistanceAlthough news points to a crude oil price surge, technical analysis indicates price cap risks remain within the borders of a 3-year descending channel.
Should a clear hold emerge above the $70 barrier, the bullish rebound in price action from the $64.40 zone, in line with the weekly RSI’s rebound off the neutral 50 zone, may extend toward the channel’s upper boundary at $72.40, $74.40, and $77 in more extreme scenarios.
A confirmed hold above the $77–78 zone may shift the primary trend away from bearish dominance and pave the way for longer-term bullish forecasts.
On the downside, if a price drop results in a clean break below the $64 barrier, downside risks may extend toward the mid-zone of the long-standing channel, with potential support levels at $63.20, $61.80, and $59.70, respectively.
Written by Razan Hilal, CMT
USOIL GROWTH AHEAD|
✅CRUDE OIL broke the key
Structure level of 69.50$
While trading in an local uptrend
Which makes me bullish biased
And I think that after the retest of the broken level is complete
A rebound and bullish continuation will follow
LONG🚀
✅Like and subscribe to never miss a new idea!✅
Disclosure: I am part of Trade Nation's Influencer program and receive a monthly fee for using their TradingView charts in my analysis.
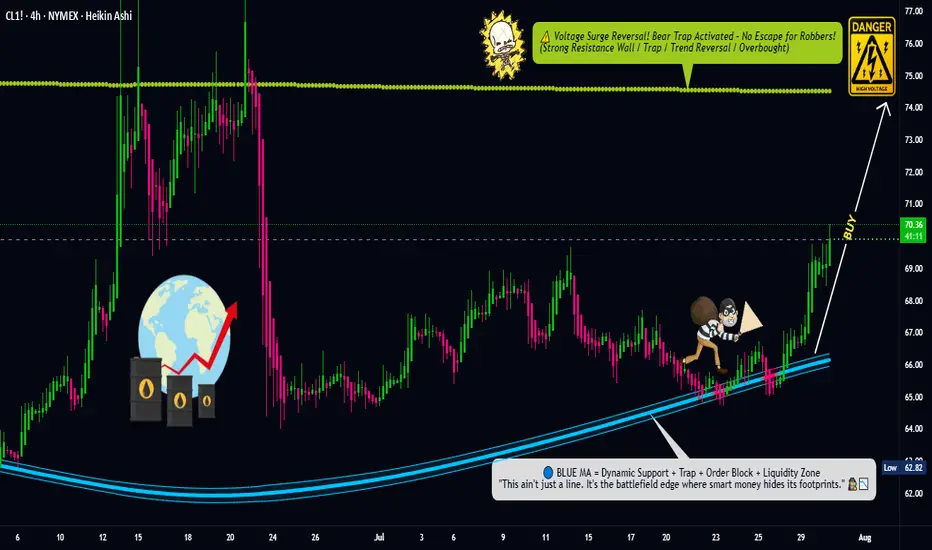
Oil Trap Activated – Limit Orders Set for the Big Score💥🛢️Crude Oil Vault Breach Plan – DCA Heist Begins!🧨💰
🚨Asset: CL1!
📈Bias: BULLISH RAID MODE ON
🎯Target: $74.50
🛡️Stop Loss: $67.50
🔑Entry: ANY LEVEL – Thief stacking limit orders like layers of gold bars 💼⚖️ (DCA Mode Activated)
🕵️♂️Thief Trader is not chasing, we're ambushing 🧠 — scaling in smart with multiple limit traps. The crew never FOMOs, we trap the market 🎯.
💣This is a layered loot plan, not for weak hands. Watch how we load up quietly while market sleeps 😴, then hit hard when the vault cracks open 🔐.
Support this heist by smashing that ❤️LIKE button
💬 Comment your plans below & join the real thief squad
🤝 Together we rob the market — LEGALLY & LOGICALLY
#ThiefTrader #OilHeist #CL1 #BullishTrap #DCA #CrudeOilStrategy #SmartMoneyPlay #MarketRobbery #TeamLoot #NoRetailPanic
CVX & XOM: The Bull case for OilI review the the Daily and Weekly charts on CVX & XOM, showing tradable patterns that they have formed since 2022. These are longer term trading patterns but are still active and fun to watch.

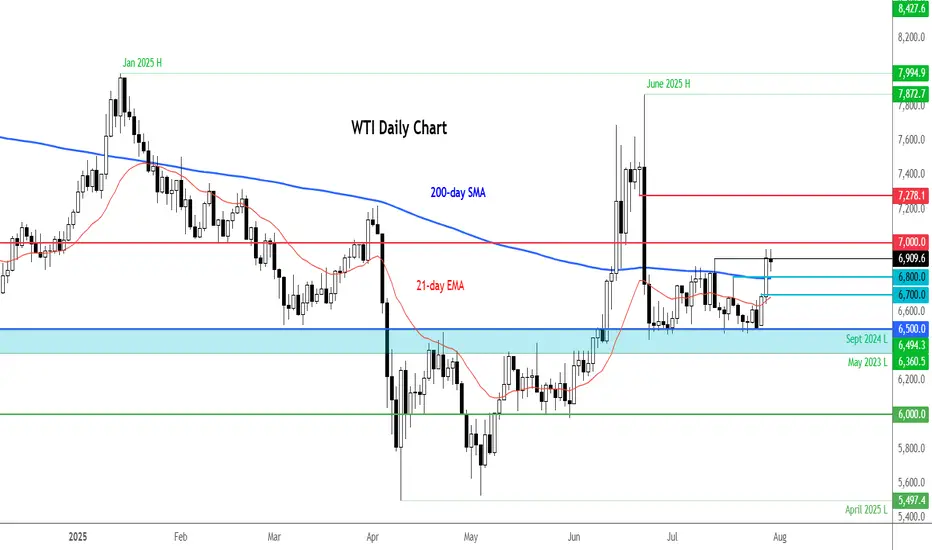
WTI remains supported on Russia sanctions threatIt is worth keeping an eye on the energy markets, given the recent bounce from a key support area around $65.00. With WTI moving back above the 200-day average at $68.00, this is an additional bullish sign from a technical standpoint. This level is now the first support to watch, followed by $67.00 and then that $65.00 key level.
Resistance comes in at $70.00 followed by $72.80.
From a macro point of view, President Trump’s decision to bring forward the deadline for Russia to agree to a ceasefire has ever so slightly heightened the prospect of secondary sanctions being imposed on foreign purchasers of Russian crude — namely China, India, and Turkey. There is a risk we could see a spike in oil prices, if fears of Russian supply being curtailed, intensifies. At the same time, fears about demand have receded with the announcement of a few trade deals by the US and recent economic data from Europe and the US both showing mild strength.
By Fawad Razaqzada, market analyst with FOREX.com.
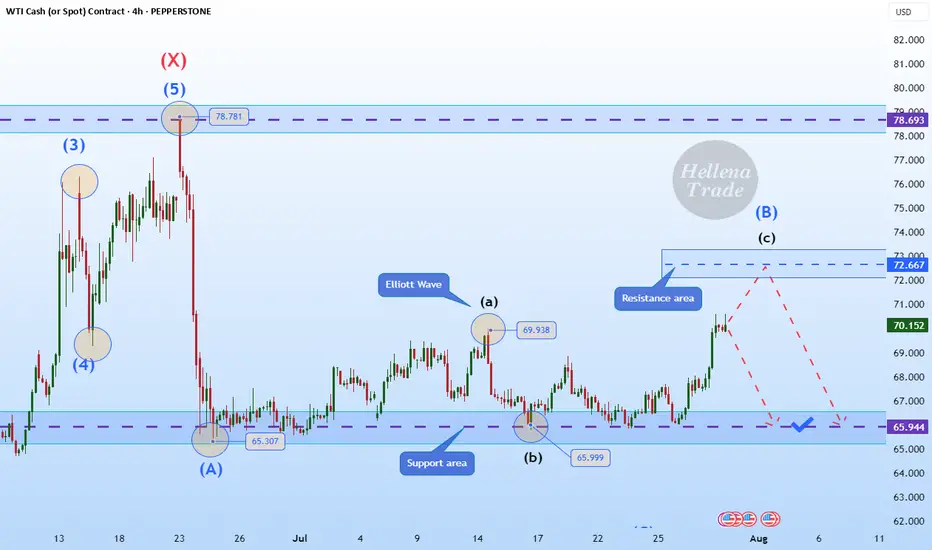
Hellena | Oil (4H): SHORT to support area of 65.944.Colleagues, I previously recommended moving trades to break-even, and for good reason. It is always necessary to hedge and reduce losses—this is part of professional work.
(Breakeven=Risk Free: Move Stop loss to the entry level).
The price has nevertheless shown a stronger correction, and I now believe that the medium-term “ABC” waves have not yet formed, nor has the large “Y” wave.
This means that I expect the completion of wave “B” and then a continuation of the downward movement in wave “C.”
I consider the support area of 65.944 to be the minimum target.
Manage your capital correctly and competently! Only enter trades based on reliable patterns!
Crude oil: Sell around 70.20, target 65.00-64.00Crude Oil Market Analysis:
Yesterday's crude oil market was very strong, with buying driving the market higher. The daily chart ultimately closed with a clear bullish candlestick. Buying on the daily chart is testing the resistance level between 70.00 and 70.60. After two consecutive days of bullish closes, and with clear bullish candlesticks, I predict another surge today. Let's look at the daily chart. The daily chart shows a significant rebound after a significant drop. Today, focus on selling opportunities between 70.00 and 70.60. A break of this level will change the overall selling trend. The strategy remains to sell high and be bearish.
Fundamental Analysis:
Today, focus on the ADP employment data and the EIA crude oil inventory data. The key news will be the interest rate results during the US trading session, along with speeches.
Trading Recommendations:
Crude oil: Sell around 70.20, target 65.00-64.00
Crude oil starts to rise, are you ready?
💡Message Strategy
Oil prices continued their upward trend amid rising geopolitical risks. US President Trump recently issued a tough statement, demanding Russia end the conflict with Ukraine within 10 to 12 days or face secondary sanctions.
Fears that Russian crude oil exports might be disrupted pushed Brent crude oil prices close to $70 per barrel, marking their largest single-day gain in two weeks at 2.3%. Meanwhile, US West Texas Intermediate (WTI) crude oil prices also remained stable around $67.
The intertwined uncertainties of geopolitics and trade policy have complicated market sentiment. Besides the situation between Russia and Ukraine, investors are closely watching the August 1st trade policy deadline set by the United States and the upcoming OPEC+ meeting in early August, which will determine its September crude oil production increase plan.
The industry generally expects that despite tight crude oil inventories in some parts of the world and strong peak season consumption in the Northern Hemisphere, if OPEC+ continues to increase production, oversupply pressure will gradually emerge by the end of the year.
📊Technical aspects
From a technical perspective, the daily chart of US crude oil (WTI) shows a modest upward trend. The current price is trading steadily above its 100-day moving average, indicating continued bullish momentum.
The Relative Strength Index (RSI) remains between 55 and 60, remaining within overbought territory, suggesting further upside potential. A successful break above the key resistance level of $68.50 would open up opportunities towards $70.
💰Strategy Package
Long Position:66.50-67.00,SL:65.50,Target:68.50-69.00
Crude Oil Spikes - Russia / Ukraine / USA sanction? Concerns about the possibility of tighter global oil supplies are supporting crude prices after President Trump warned of "secondary sanctions" if Russia fails to reach a ceasefire in Ukraine within 10 to 12 days.
These sanctions have absolutely burned the shorts in oil and can cause a 3 bar surge on the daily chart if crude breaks this channel.
Keep you eye on the daily 200 MA...if it holds above we should push higher on crude.
FOMC RATE DECISION TOMORROW - Tune into our live stream.

Oil Market Sentiment Shifts After Trump’s Urgent Warning, but...On June 23, 2025, at 9:35 AM, President Donald J. Trump issued a stark warning via social media:
"EVERYONE, KEEP OIL PRICES DOWN. I’M WATCHING! YOU’RE PLAYING RIGHT INTO THE HANDS OF THE ENEMY. DON’T DO IT!"
Since his post, oil prices experienced a notable bullish impulse. From both fundamental and technical perspectives, the market is now approaching a 16-hour supply zone, which could serve as a potential resistance area.
Additionally, I’ve observed a divergence in trader positioning: non-commercial traders increased their short positions significantly last week, while retail traders remain long. This divergence between price action and non-commercial positions suggests a possible shift in momentum, and I am currently eyeing a short setup.
As always, I encourage traders to conduct their own analysis. The trader featured below operates on the D1 timeframe and focuses on scalping, which can be useful for short-term entries.
Stay cautious and keep an eye on how the market reacts near the identified supply zone.
✅ Please share your thoughts about CL1! in the comments section below and HIT LIKE if you appreciate my analysis. Don't forget to FOLLOW ME; you will help us a lot with this small contribution.

USOIL BEST PLACE TO SELL FROM|SHORT
USOIL SIGNAL
Trade Direction: short
Entry Level: 66.83
Target Level: 65.56
Stop Loss: 67.67
RISK PROFILE
Risk level: medium
Suggested risk: 1%
Timeframe: 6h
Disclosure: I am part of Trade Nation's Influencer program and receive a monthly fee for using their TradingView charts in my analysis.
✅LIKE AND COMMENT MY IDEAS✅
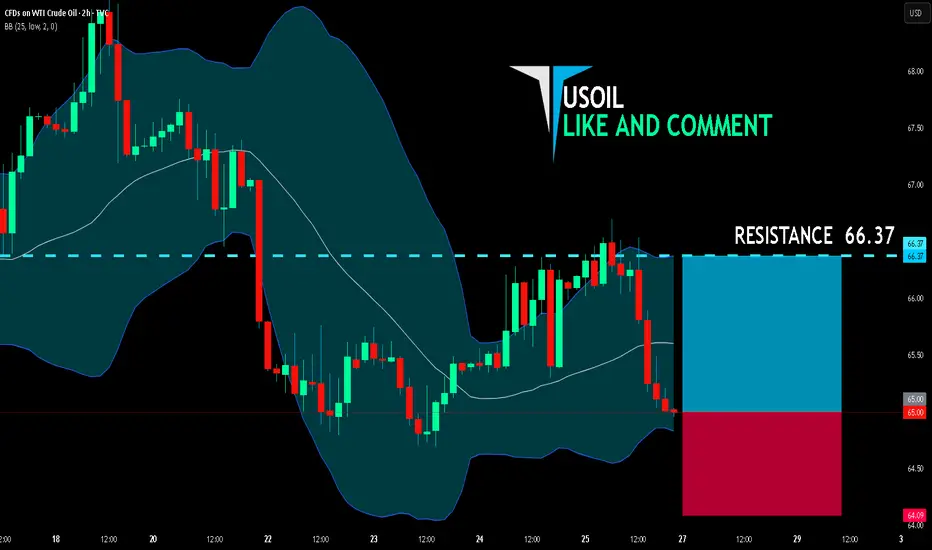
USOIL LONG FROM SUPPORT
USOIL SIGNAL
Trade Direction: long
Entry Level: 65.00
Target Level: 66.37
Stop Loss: 64.09
RISK PROFILE
Risk level: medium
Suggested risk: 1%
Timeframe: 2h
Disclosure: I am part of Trade Nation's Influencer program and receive a monthly fee for using their TradingView charts in my analysis.
✅LIKE AND COMMENT MY IDEAS✅
Crude oil-----sell near 67.50, target 65.00-64.00Crude oil market analysis:
The idea of crude oil today is still bearish. Xiaoyang predicts that it will rebound first and then continue to fall. Consider selling near 67.50 if it rebounds. Crude oil is basically weak if it does not stand above 70.00. Crude oil is a repair market after a big drop. In theory, it will continue to fall after the repair. In addition, pay attention to crude oil inventory data later.
Operation suggestions:
Crude oil-----sell near 67.50, target 65.00-64.00

WTI(20250729)Today's AnalysisMarket news:
After gold prices soared to an all-time high of more than $3,500 an ounce in April, the latest report from the Commodity Futures Trading Commission (CFTC) showed that fund managers have increased their bullish bets to the highest level in 16 weeks.
Technical analysis:
Today's buy and sell boundaries:
66.09
Support and resistance levels:
68.13
67.37
66.87
65.30
64.80
64.04
Trading strategy:
If the price breaks through 66.87, consider buying, the first target price is 67.37
If the price breaks through 66.09, consider selling, the first target price is 65.30
