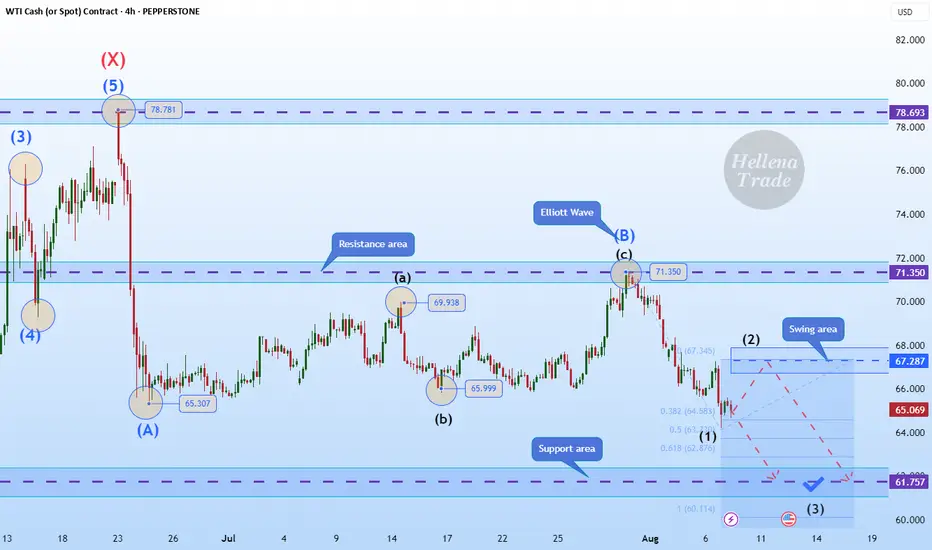
Hellena | Oil (4H): SHORT to support area of 61.937 (Fibo lvl).Hello, colleagues!
Well, I think that the previous scenario is still relevant and the “ABC” correction is developing according to the scenario.
At the moment, I see a five-wave structure in the downward wave “C”. I expect a small correction to the area of 67.287, then a continuation of the downward movement to the area between 61.8% and 100% of the levels of Fibonacci extension - the support area of 61.937.
Manage your capital correctly and competently! Only enter trades based on reliable patterns!
Oil(wti)
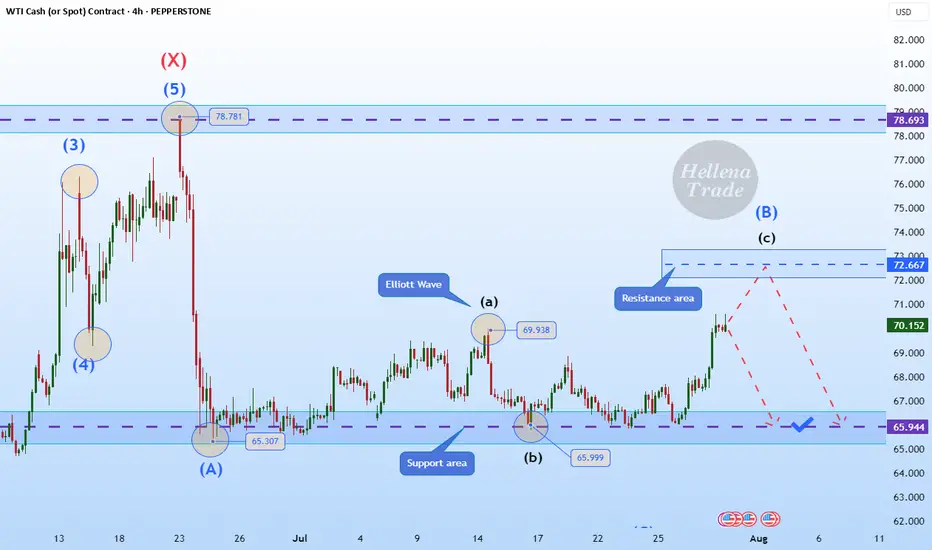
Hellena | Oil (4H): SHORT to support area of 65.944.Colleagues, I previously recommended moving trades to break-even, and for good reason. It is always necessary to hedge and reduce losses—this is part of professional work.
(Breakeven=Risk Free: Move Stop loss to the entry level).
The price has nevertheless shown a stronger correction, and I now believe that the medium-term “ABC” waves have not yet formed, nor has the large “Y” wave.
This means that I expect the completion of wave “B” and then a continuation of the downward movement in wave “C.”
I consider the support area of 65.944 to be the minimum target.
Manage your capital correctly and competently! Only enter trades based on reliable patterns!
Crude Oil Spikes - Russia / Ukraine / USA sanction? Concerns about the possibility of tighter global oil supplies are supporting crude prices after President Trump warned of "secondary sanctions" if Russia fails to reach a ceasefire in Ukraine within 10 to 12 days.
These sanctions have absolutely burned the shorts in oil and can cause a 3 bar surge on the daily chart if crude breaks this channel.
Keep you eye on the daily 200 MA...if it holds above we should push higher on crude.
FOMC RATE DECISION TOMORROW - Tune into our live stream.

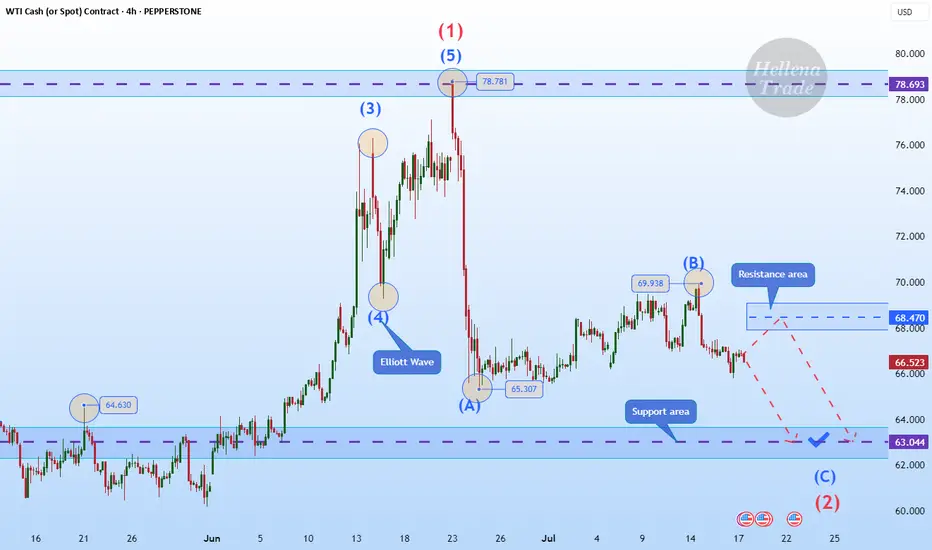
Hellena | Oil (4H): SHORT to support area of 63.000.Colleagues, I believe that wave “B” has formed at the level of 69.938, and now we expect the downward movement to continue with the aim of completing wave ‘C’ of the middle order and wave “2” of the higher order in the support area of 63,000.
It is quite possible that the price could reach the 60,000 level, but I think that for now it is worth focusing on the nearest targets.
Manage your capital correctly and competently! Only enter trades based on reliable patterns!
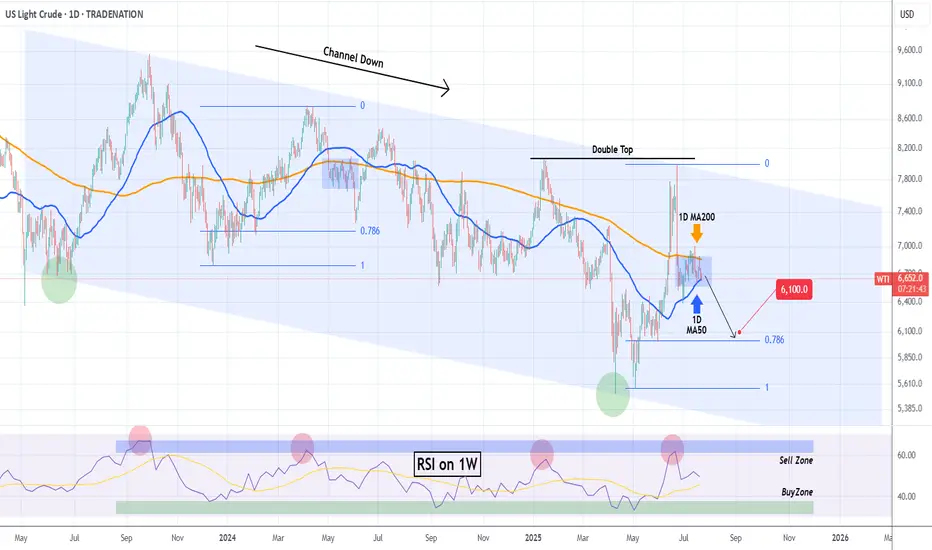
WTI OIL Extreme 1D MA50-200 squeeze to deliver break-out!WTI Oil (USOIL) has been consolidating for almost the past 30 days within the 1D MA50 (blue trend-line) and 1D MA200 (orange trend-line). The squeeze is now so tight that the trend will be revealed soon with a break-out.
Based on the 2-year Channel Down, that should be bearish, resembling the May 2024 consolidation that broke downwards and almost hit the 0.786 Fibonacci retracement level. Notice also the similar Sell Zone rejection on the 1W RSI.
As a result, we expect WTI to decline and target $61.00.
-------------------------------------------------------------------------------
** Please LIKE 👍, FOLLOW ✅, SHARE 🙌 and COMMENT ✍ if you enjoy this idea! Also share your ideas and charts in the comments section below! This is best way to keep it relevant, support us, keep the content here free and allow the idea to reach as many people as possible. **
-------------------------------------------------------------------------------
Disclosure: I am part of Trade Nation's Influencer program and receive a monthly fee for using their TradingView charts in my analysis.
💸💸💸💸💸💸
👇 👇 👇 👇 👇 👇
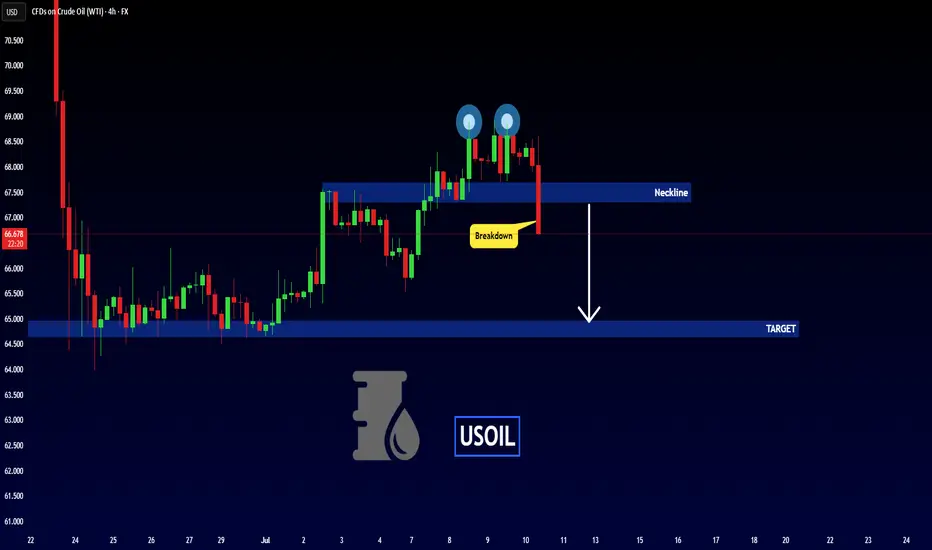
USOIL - Bearish Double TOPHello Traders !
The USOIL failed to create a new higher high.
The price formed a double top pattern.
Currently, The neckline is broken !
So, I expect a bearish move📉
________________
TARGET: 64.970🎯
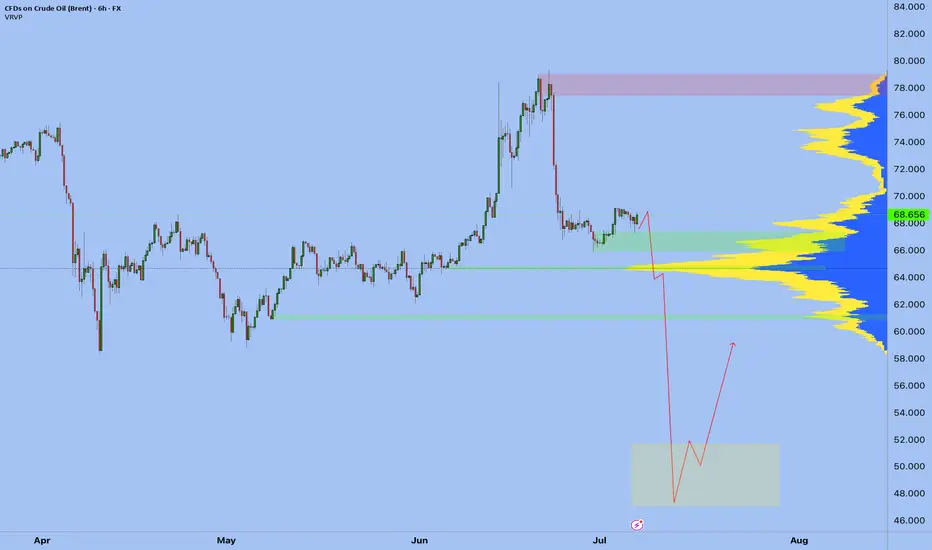
Crude oil $ukoil - Final falling oil has been a barometer of the financial market for the last decades.
I look at the formations and I see that we will see a renewal of the bottom in the coming months, I will not say the reasons, you just need to wait a little.
I've been talking about the fall for a long time, but it's not over yet.
After the final fall, I expect a renewal of the highs, due to the worsening situation in the Middle East, this will be after September
Best Regards EXCAVO
Sudden Oil Spike - what you need to know!Iran suspended cooperation with the U.N. nuclear watchdog, amid a surprise build in US crude inventories.
Iran’s move added a modest risk premium to prices, though analysts noted that no actual supply disruptions have occurred.
$66 is a key level for WTI crude to hold above.
If it can maintain this area, we will likely see higher price. $66 is a multi year trendline of support going back to 2021.
Energy stocks / XLE basket is showing some bullish divergence, perhaps indicating this oil move has legs.

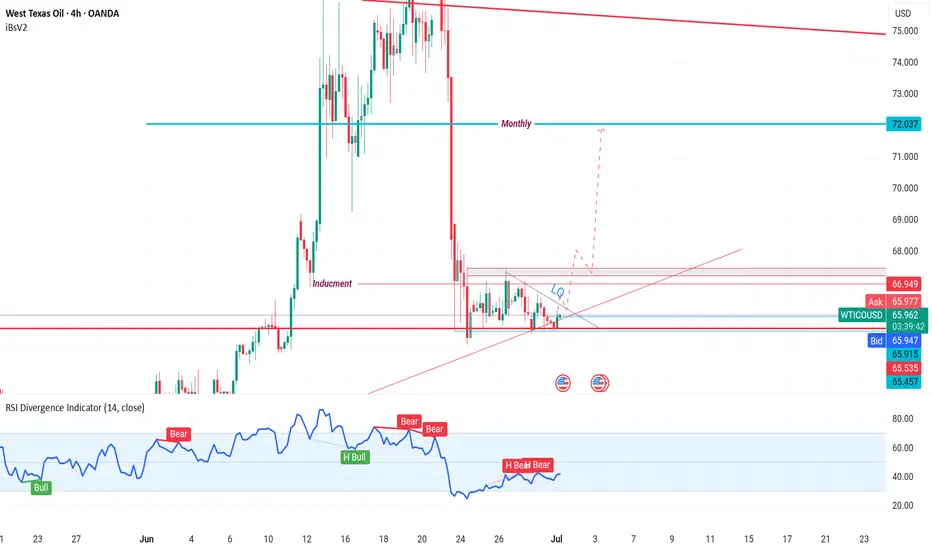
WTI on high time frame
"Hello traders, focusing on WTI crude oil, the price surged to $78 but sharply retreated to the $65 zone. Over the last five days, the price has consolidated. I believe that the signals from the recent 4-hour candle suggest a potential move towards higher prices, with the next target possibly being around $72. I will be monitoring the price action around $72 closely for a potential rejection or continuation towards even higher prices."
If you need further assistance or have additional insights to share, feel free to let me know.
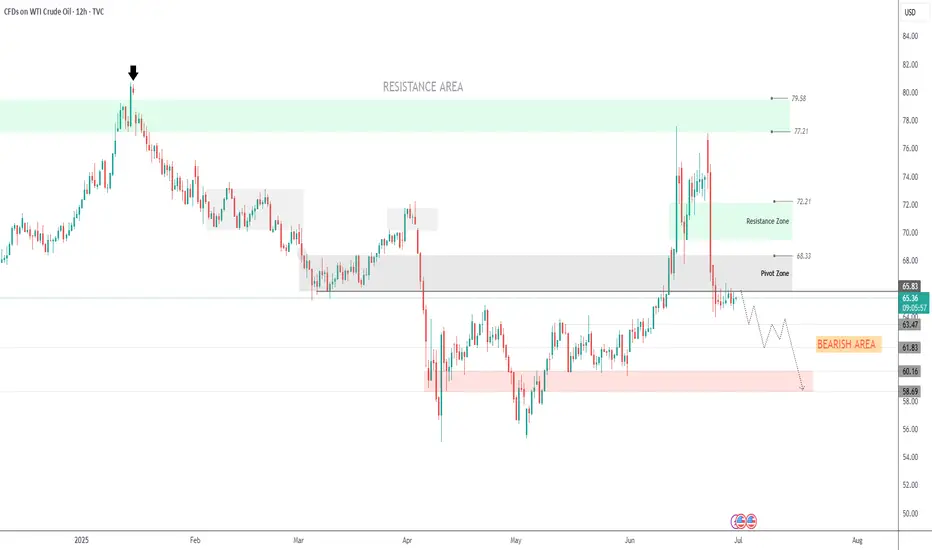
OIL |Bearish Pressure Builds as OPEC+ Prepares Fresh Output Hike OIL | Market Overview
Oil prices edged lower on Monday despite strong seasonal demand, as the market prepares for an increase in supply. OPEC+ is set to raise production by 411,000 barrels per day starting Tuesday, marking the fourth monthly increase in output. Another similar hike is reportedly under consideration for August, which may further pressure prices.
Technical Outlook
The price remains within the bearish zone and is expected to continue its decline as long as it trades below the pivot level at 65.83.
A daily candle close above 65.83 is required to confirm a potential bullish reversal.
Until then, the bearish trend remains intact, targeting 63.47, 61.83, and potentially 60.16.
Key Levels
Pivot: 65.83
Support: 63.47 / 61.83 / 60.16
Resistance: 68.33 / 69.55
Is the oil market signalling de-escalation?After an initial 6% spike at the open, U.S. crude oil futures reversed sharply—falling into negative territory—as markets priced in the possibility that Iran's latest retaliation may be more symbolic than escalatory.
According to President Donald Trump, Iran gave advance notice before launching missiles at a U.S. base in Qatar, allowing defences to intercept the attack and resulting in no reported casualties.
While Tehran publicly described the strike as “devastating and powerful,” the lack of impact on the ground and the pre-warning have fuelled speculation that Iran was aiming to save face without triggering a broader conflict.
The swift reversal in oil prices reflects that sentiment. For now, the market appears to be signaling that escalation may pause here.
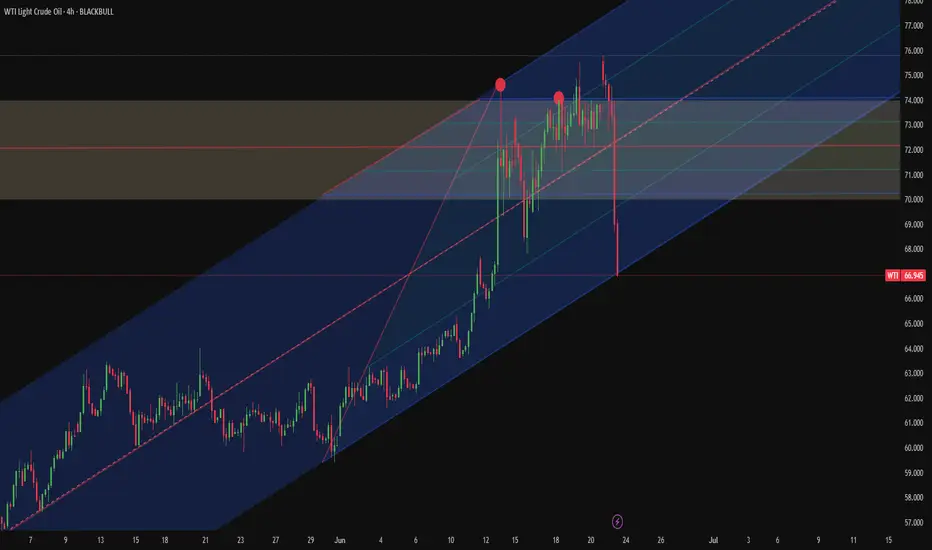
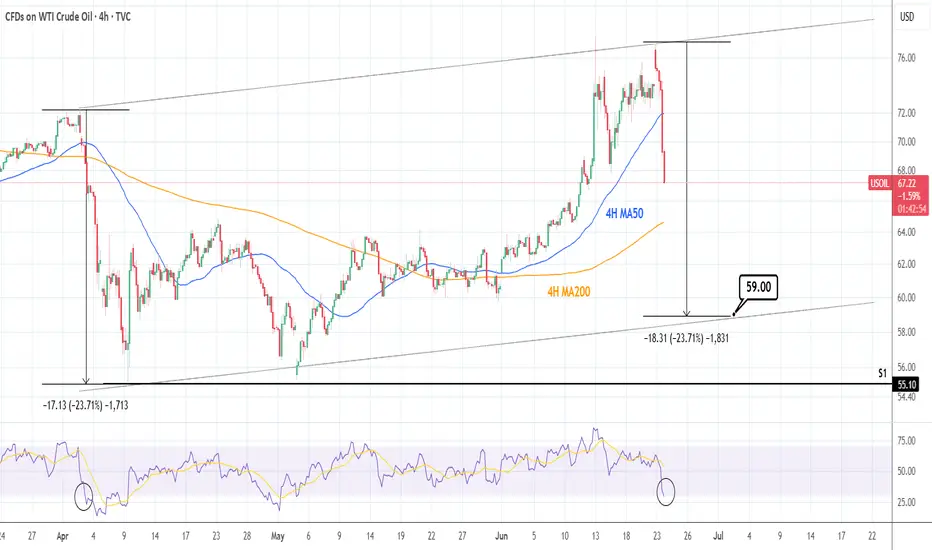
WTI CRUDE OIL: Massive 4H MA50 bearish breakout.WTI Crude Oil has turned neutral again on its 1D technical outlook (RSI = 48.933, MACD = 2.900, ADX = 47.682) as it just broke with force under the 4H MA50. Every time this has taken place in the recent past, a strong downtrend followed. The last such selling sequence dropped by -23.71%. The 4H RSI is on the exact same spot as then. We are bearish, TP = 59.00.
See how our prior idea has worked out:
## If you like our free content follow our profile to get more daily ideas. ##
## Comments and likes are greatly appreciated. ##
Middle East Tension: Read This Before You Trade today⚔️🕊️💣 Middle East Tension: Read This Before Markets close for the Weekend 🌍🔥✌️
Video:
Hey traders,
Today’s landscape is delicate and raw: we stand between a possible US strike on Iran and a chance for leaders to step back from the edge. Many are asking: Should I bet on gold? Should I short the indices? Should I buy oil?
Here’s my honest read, straight from today’s video (which I highly recommend you watch for full context 📺):
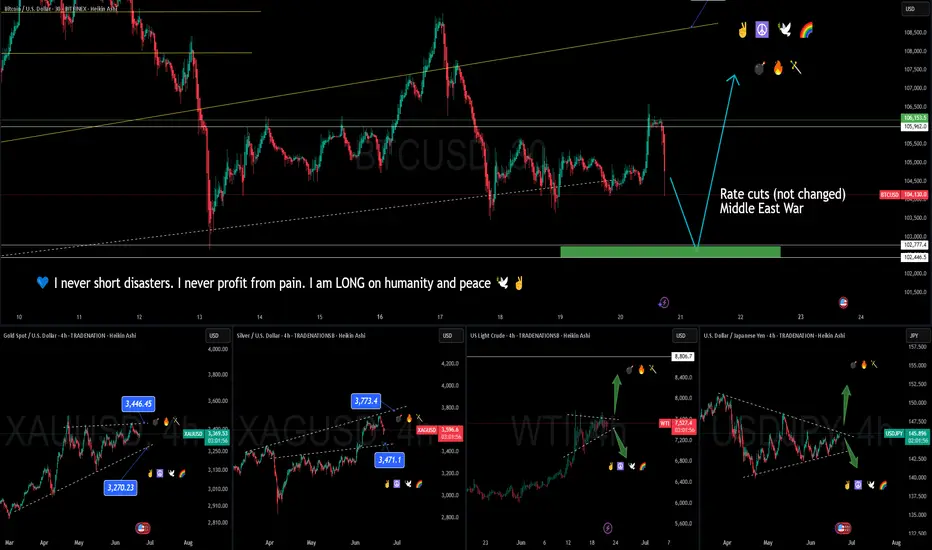
👉 Bitcoin (BTC)
Still ranging sideways. The last move hit my resistance zone perfectly. For now, BTC keeps its cool — but watch out: global fear can spark sudden moves, or the opposite, a liquidity crunch.
👉 Gold & Silver
Yes, they’re classic safe havens — but don’t fall for the textbook trap. When true chaos strikes, big players often sell profitable gold positions to cover losses elsewhere. So an initial spike is possible, but deep pockets can reverse it fast. This is why I’m cautious: I do not expect a guaranteed pump on gold or silver.
👉 Crude Oil (WTI)
The chart says it all: any strike in the Middle East fuels oil prices fast. But as I’ve always said — I do not long oil during human tragedy. Ethics over easy pips.
👉 Indices & USDJPY
Gaps are likely. Risk assets may get hammered if bombs fall. If leaders choose dialogue instead, expect a risk-on rebound. The USD stays a wildcard: trust in the US remains, but shocks test that trust.
👉 Airlines Pausing Flights?
Yes — major airlines are avoiding the Gulf. That alone signals how real this risk is.
✅ My plan is clear:
I never short disasters. I never profit from pain. I am LONG on humanity and peace. I’d rather lose a trade than wish for blood in the streets.
I do have some carefully calculated positions open tonight — fully risk-managed and small-sized. If Monday gaps bless me, fine. If peace wins and my trades lose? Even better.
👉 Watch the full video for my live charts, context, and unfiltered thoughts.
This text is just a recap — the full idea is already posted as a video.
Stay sharp. Stay ethical. Protect your capital and your soul — one good trade is never worth your humanity.
One Love,
The FXPROFESSOR 💙
Disclosure: I am happy to be part of the Trade Nation's Influencer program and receive a monthly fee for using their TradingView charts in my analysis. Awesome broker, where the trader really comes first! 🌟🤝📈
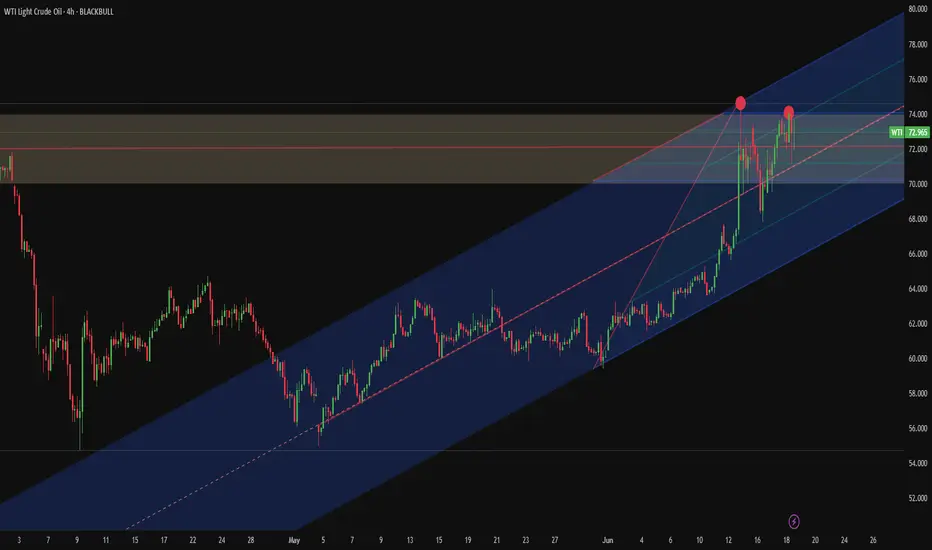
Strait of Hormuz risk priced in—or not yet?Iran has repeatedly threatened to block the Strait of Hormuz during periods of heightened tension with the U.S., notably in 2011, 2018, and 2020. The Strait is considered the world’s most critical oil chokepoint, with nearly 20 million barrels passing through daily.
Several banks warn that a full closure could push crude prices above $120–$150 per barrel, or higher if the disruption is prolonged. Still, most analysts view a complete shutdown as unlikely, since Iran also depends on the Strait to export its own oil.
Technically, recent WTI candles suggest that the risk premium may be fading. Price action near $74 shows hesitation, raising the risk of a developing double top—particularly if support at $70 fails. Unless tensions escalate materially, such as the U.S. becoming more directly involved, WTI may consolidate between $70–$74.
Massive Oil Move Incoming? Only One Thing Can Stop ItOIL – Overview
Oil Rallies to 5-Month High as Israel-Iran Tensions Escalate
Oil prices surged to a five-month high early Wednesday amid escalating conflict between Israel and Iran. The ongoing airstrikes between the two nations, along with reports that the Trump administration is considering military involvement, have intensified concerns over a broader regional war.
Since Israel launched a surprise strike on Iran last week targeting nuclear sites, oil has risen nearly 10%, fueled by fears of potential supply disruptions. President Trump has publicly called for Iran's "unconditional surrender," signaling heightened geopolitical risk.
Despite the ongoing conflict, Iran's oil exports remain largely unaffected, and the country has not yet disrupted shipping through the Persian Gulf — a critical route supplying around 20% of global oil demand. However, markets remain on edge over the potential for further escalation that could directly impact supply.
Technical Outlook:
Oil maintains bullish momentum as long as it trades above 72.21, with upside targets at:
➡️ 77.21
➡️ 79.50 — key breakout level
➡️ 85.40 — next resistance zone
➡️ Potential extension to 88.40 if momentum continues
🔻 A shift to bearish sentiment is only likely if negotiations begin between Iran and Israel, signaling potential de-escalation.
Key Levels:
• Pivot: 73.20
• Resistance: 77.21 / 79.50 / 85.40
• Support: 69.55 / 68.33 / 66.03
Caution: Any signs of de-escalation or negotiations between Iran and Israel could quickly reverse the trend.

Crude Oil Challenges 2-Year ChannelAmid rising summer demand, an inverted head and shoulders breakout from oversold 2020 levels, and the recent outbreak of war between Israel and Iran, crude oil has tested the upper boundary of the declining channel originating from the 2022 highs. This test comes as supply risks for the coming month intensify.
This upper boundary aligns with the $77 resistance level. A confirmed breakout and sustained hold above this level could shift momentum more decisively to the bullish side, potentially paving the way for a retest of the $80 and $83.50 levels.
On the downside, if oil fails to maintain its gains and resumes a pullback, key support zones are located around $69, $66, and $64, reestablishing bearish dominance within the channel.
— Razan Hilal, CMT
Israel VS Iran War: Oil Spike!Tensions between Israel and Iran have escalated dramatically, with both nations engaging in direct military strikes. Israel launched Operation Rising Lion, targeting Iran’s nuclear infrastructure, missile factories, and military personnel. In response, Iran retaliated with missile attacks on Israel, hitting Tel Aviv and wounding civilians
The conflict stems from long-standing hostilities, particularly over Iran’s nuclear program, which Israel views as an existential threat. The situation has drawn international attention, with the United States distancing itself from Israel’s actions while maintaining strategic interests in the region.
The escalation has raised concerns about a wider regional war, with analysts warning of unintended consequences and further retaliation. The global markets have also reacted, with oil prices surging amid uncertainty.

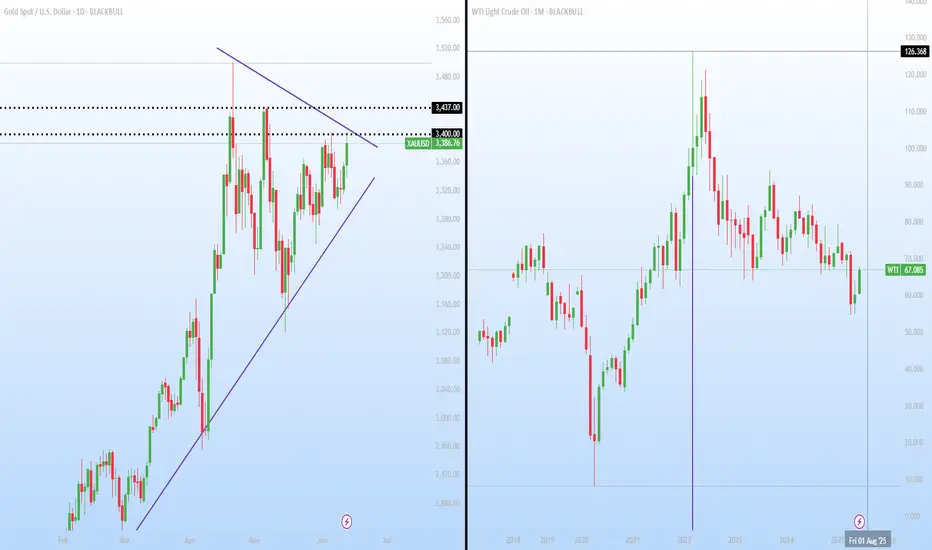
Iran tensions rise: a setup brewing for gold and oil Geopolitical tensions surrounding Iran might fuel safe-haven demand for gold.
A break above $3,403 might open the door for a test of the May high at $3,437. However, price action over the last two sessions potentially indicates that buyers are reluctant to drive spot prices above $3,400.
At the same time, analysts are suggesting that oil could climb toward $120 if Israel takes military action against Iran. “I don’t want to say it’s imminent, but it looks like something that could very well happen,” President Trump said during a White House event.
Meanwhile, cooler-than-expected US CPI and PPI prints have potentially strengthened expectations that the Federal Reserve could begin cutting interest rates by September, with a second cut possibly following before year-end.
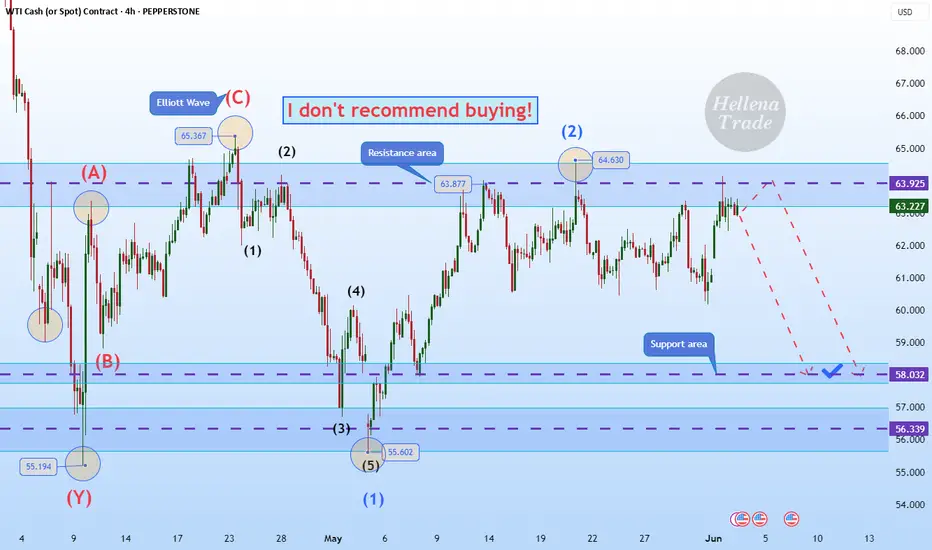
Hellena | Oil (4H): SHORT to support area of 58.00.Colleagues, the previous forecast did not meet expectations for too long, and the price has been in a prolonged sideways movement.
In this regard, I decided to slightly revise the waves and make a new forecast.
At the moment, I believe that the price will resume its downward movement in the medium-term wave “3.” The complex configuration of the correction makes it difficult to fully understand whether it is a combined correction or a five-wave movement.
In either case, I expect the price to reach the support area of 58.00.
Manage your capital correctly and competently! Only enter trades based on reliable patterns!
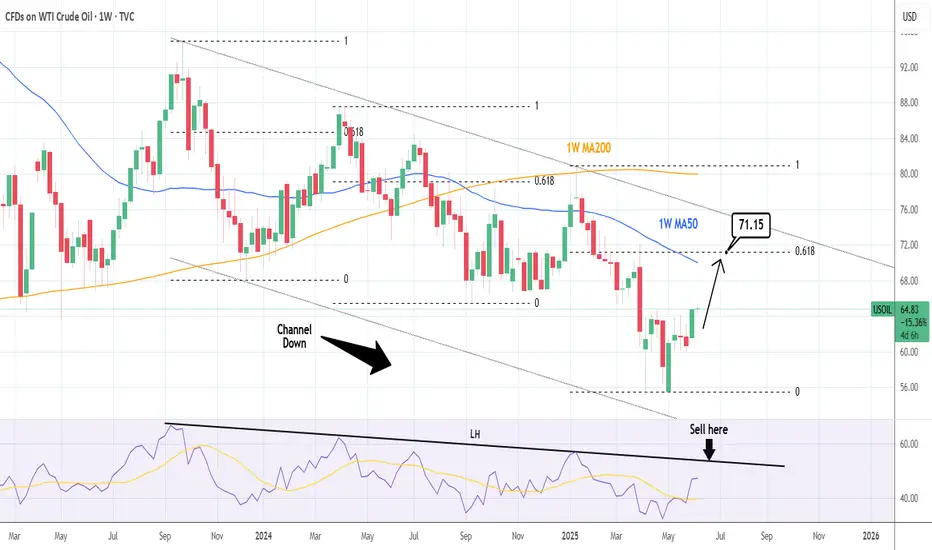
WTI CRUDE OIL: Channel Down needing to fill its top. Bullish.WTI Crude Oil turned bullish on its 1D technical outlook (RSI = 62.137, MACD = 0.740, ADX = 26.844), having completed a very strong 1W candle last week. This is the continuation of the May 5th bottom rebound. All prior such rebounds have filled at least the 1W MA50, having touched the 0.618 Fibonacci retracement level. The 1W RSI LH trendline gives a good sense of where to sell, but since the 0.618 Fib is the guide, the target is TP = 71.15.
## If you like our free content follow our profile to get more daily ideas. ##
## Comments and likes are greatly appreciated. ##
WTI CRUDE OIL: Going for a LH rejection. Sell signal.WTI Crude Oil is practically neutral on its 1D technical outlook (RSI = 55.991, MACD = 0.160, ADX = 24.748) as it's on the 3rd straight day of flat consolidation on the 1D MA50. The last time it did this was on April 2nd, which resulted in a LH rejection to the S1 level. As the presence of the R1 level (64.90) is just above, we expect the market to get rejected and aim for the S1 again (TP = 56.00).
## If you like our free content follow our profile to get more daily ideas. ##
## Comments and likes are greatly appreciated. ##

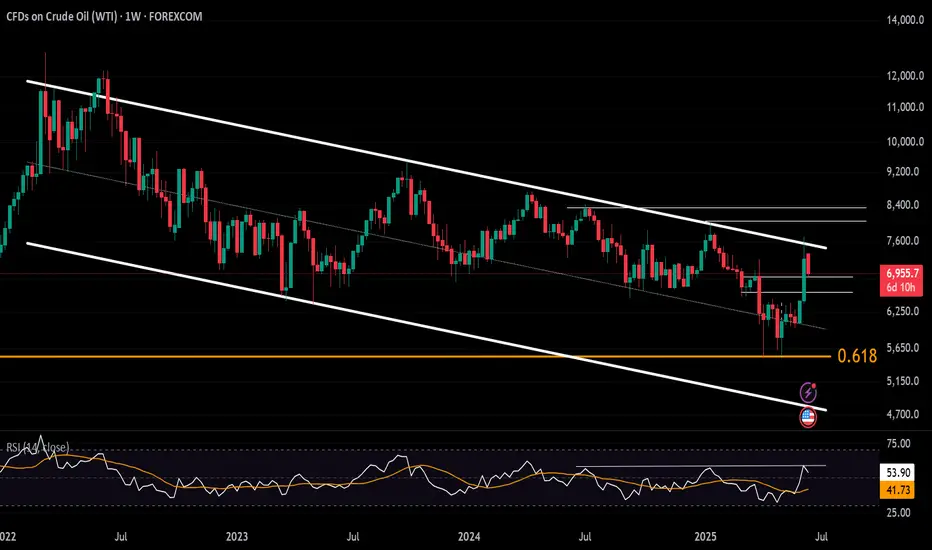
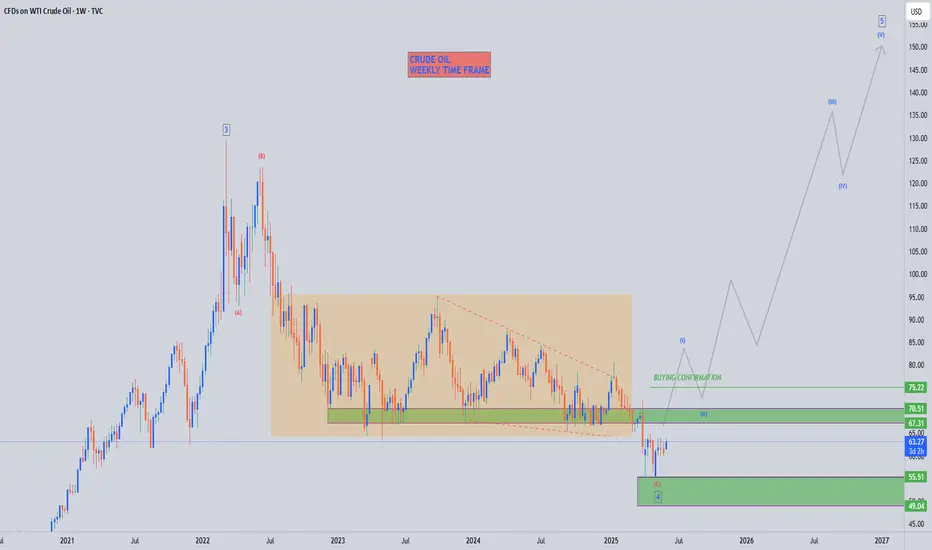
CRUDE OIL TO HIT $160?!Oil prices broke down lower in the past few weeks, after a much needed LQ grab, following a 2 year consolidation. We’ve seen a ‘5 Wave Complex Correction’, which should now be followed by price recovery.
Wait for buyers to BREAK ABOVE our ‘buying confirmation’ level, followed a by a retest before buying, otherwise leave it❗️
WTI OIL The perfect scalping Rectangle.WTI Oil (USOIL) has been trading within a 3-week Rectangle pattern since the May 13th High and yesterday it got rejected on its top. This is a technical sell signal, with it natural target being the bottom of the pattern at $60.70.
-------------------------------------------------------------------------------
** Please LIKE 👍, FOLLOW ✅, SHARE 🙌 and COMMENT ✍ if you enjoy this idea! Also share your ideas and charts in the comments section below! This is best way to keep it relevant, support us, keep the content here free and allow the idea to reach as many people as possible. **
-------------------------------------------------------------------------------
Disclosure: I am part of Trade Nation's Influencer program and receive a monthly fee for using their TradingView charts in my analysis.
💸💸💸💸💸💸
👇 👇 👇 👇 👇 👇
