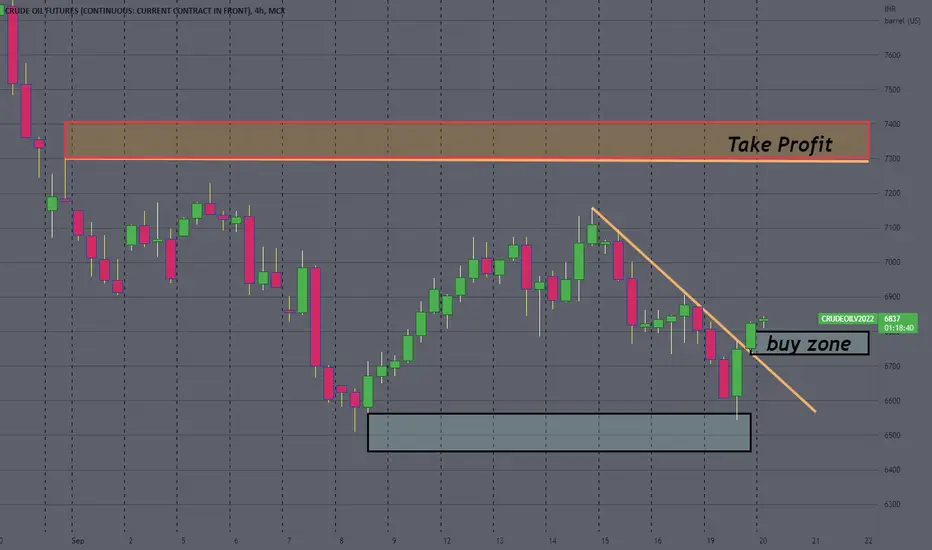
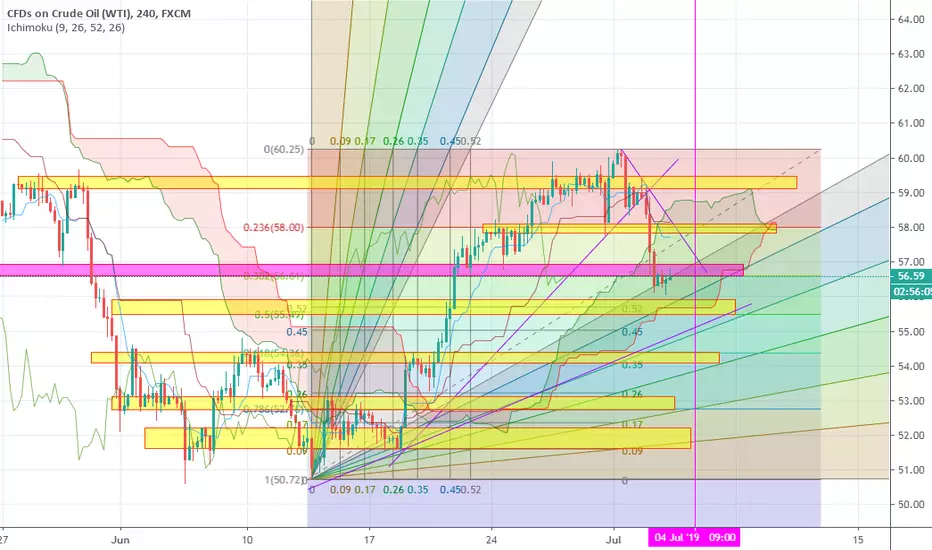
WTI - Positioning for Upside After Anticipated CorrectionThe US Light Crude 4-hour chart shows price action currently oscillating near the $68,60 level after recovering from early March lows. The recent price structure suggests we may see a short-term pullback before a stronger upward move develops. The chart indicates a potential bullish scenario with price expected to eventually rally toward the blue reaction zone (around $69,00-$69,50) after a possible retracement. This anticipated upside move is supported by the higher lows forming since mid-March and the overall recovery pattern from the $65,67 support level (marked by the red line). A prudent approach would be monitoring for reversal signs at lower levels before positioning for the higher probability move toward the blue reaction zone, with the orange resistance at $70,77 serving as the ultimate target if bullish momentum accelerates.
Disclosure: I am part of Trade Nation's Influencer program and receive a monthly fee for using their TradingView charts in my analysis.
Oil-trade

WTI - High Probability of Continued Downtrend US Light Crude's 4-hour chart suggests a high probability that price will continue with the dominant downtrend and eventually break below recent lows. Currently trading around $67.17, crude oil has been in a persistent decline since late February, forming a series of lower highs and lower lows. The chart's projected path indicates a potential corrective bounce within the blue box area (approximately $68.50-$69.50), characterized by zigzag movements that would likely form a complex correction before resuming the bearish trend. This anticipated bearish continuation targets the horizontal red support line at around $65.77, with potential for moves below this level as indicated by the downward arrow. Recent failed attempts to sustain rallies and the steep decline from the $74.00 area reinforce the bearish outlook, suggesting that any upward movements should be viewed as selling opportunities within the larger downtrend.
Disclosure: I am part of Trade Nation's Influencer program and receive a monthly fee for using their TradingView charts in my analysis.

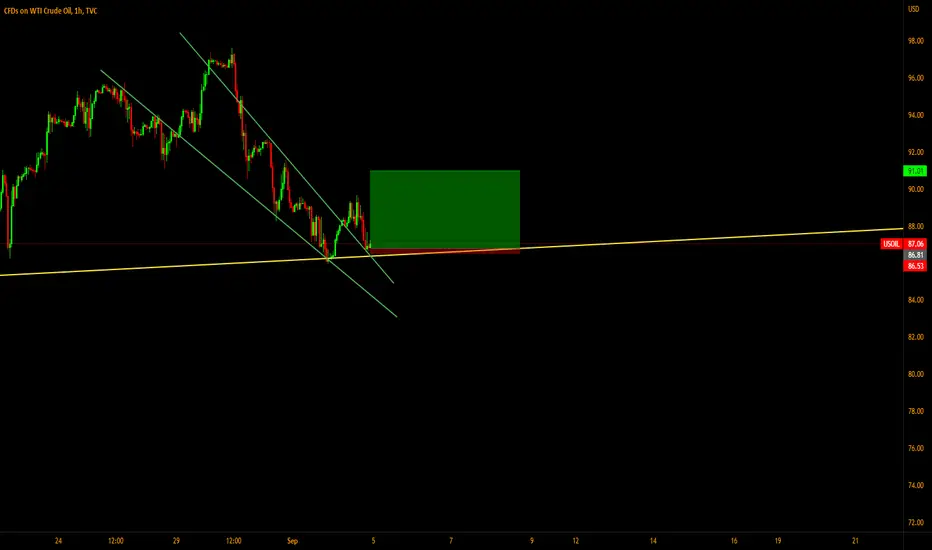
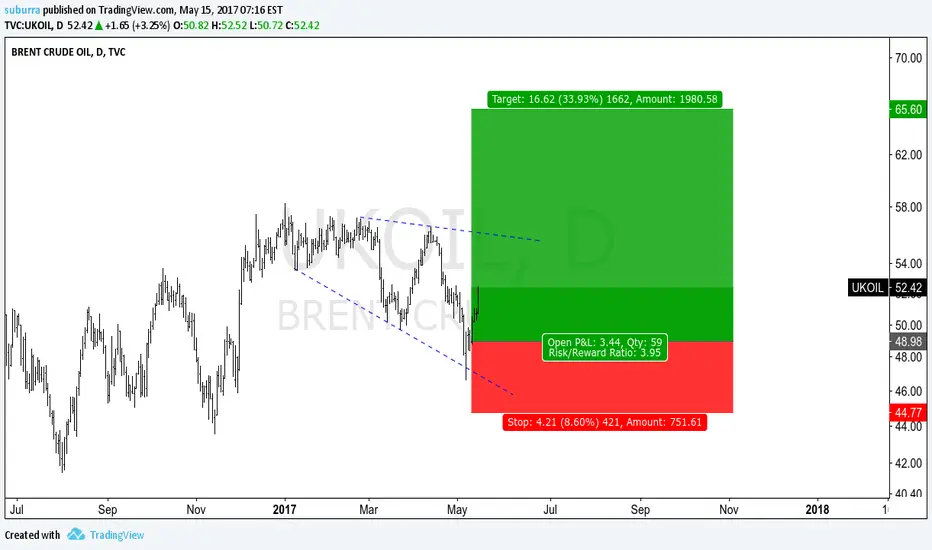
bcousdprice in supply zone and i think this is good for be short
i think this is good opportunity because more than 3 risk to reward ratio
hope enjoy trading
dont forget like if you agree and comment below your opinion
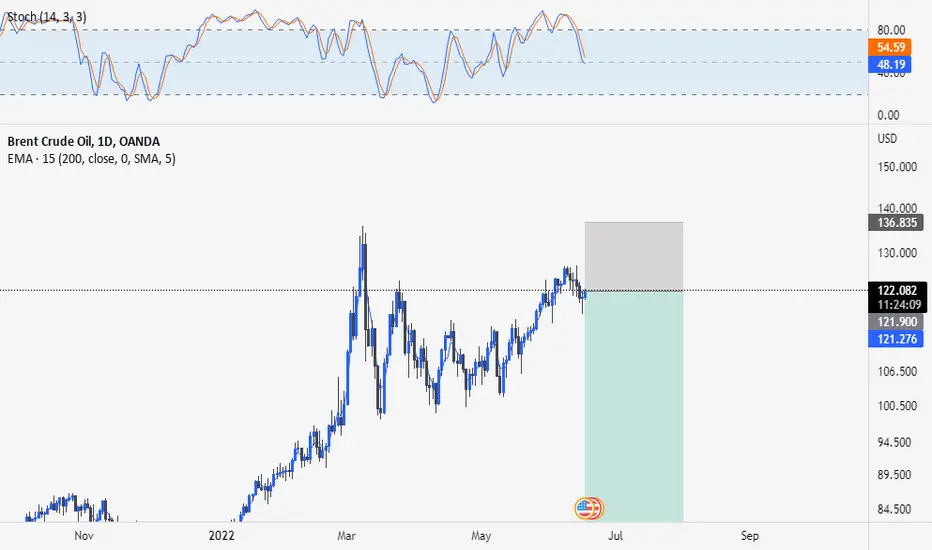
OIL DAILY SAY = more down possible but upper fibo61% is targetwe know oil is very very very veryyyyyyyy trendy market and go against trend is very dangerous agree?
wait near 71$ low and after pinbar comes on 1h-4h-daily chart pick buy with sl in low and try hold it 2-3 week ,,,technical say oil upper target is 85 then 100 $
predict = we predict oil fair price is 50$,,,,aftter 2-3 uptrend wave it can go down wild so dont open big size and without SL
good luck
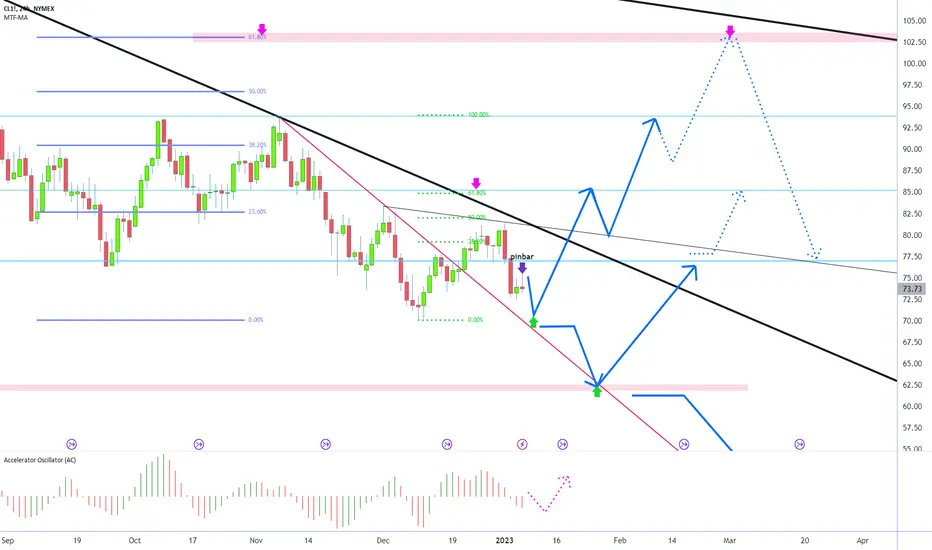
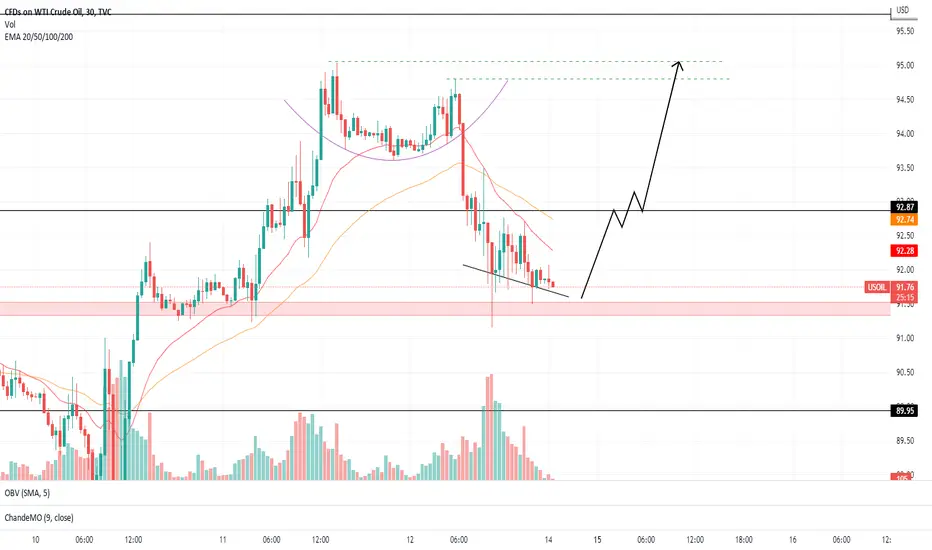
CRUDE OIL Live Trading Crude Oil futures Prediction. Hold longs for a few days. Trendline break. Double bottom set up. FOMC coming out. it has potential.
3 Steps to take before entering a trade3 simple and important steps that is required for entering a trade
👤 Sadegh Ahmadi: @SDQ_Crypto
❤️ If you apperciate my work , Please LIKE and COMMENT , It Keeps me motivated to do better❤️

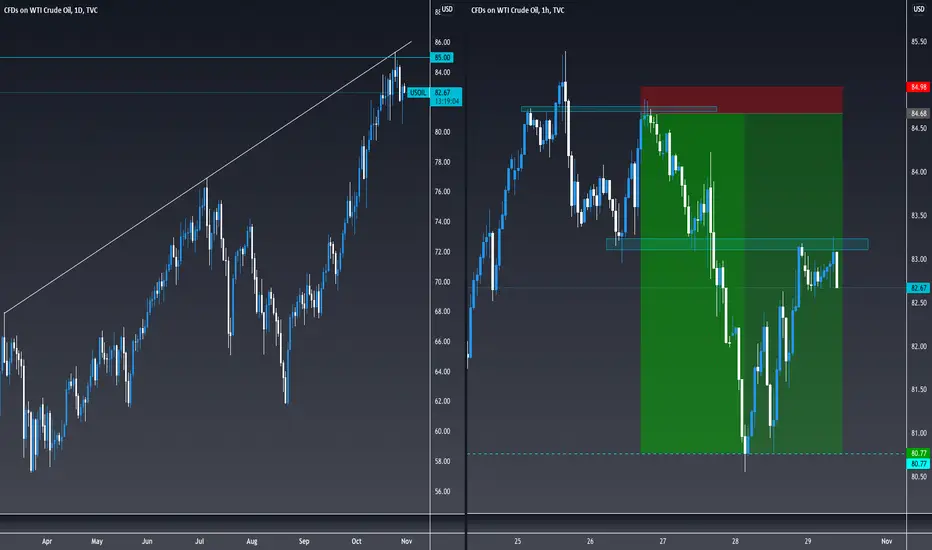
USOIL 13% GainTVC:USOIL
Trade of the month for me, USOIL shorts, targets were based off price needing to come and take out this double bottom, to grab liquidity before then pushing higher and is playing out perfectly!
I will also be breaking this one down on my Youtube channel over the weekend! Youtube: Aaron Luce
Have a great weekend everyone! :)
analysis NAS100Hello traders, here are some predictions on nas100. Thanks for reading!
BOS= break of structure

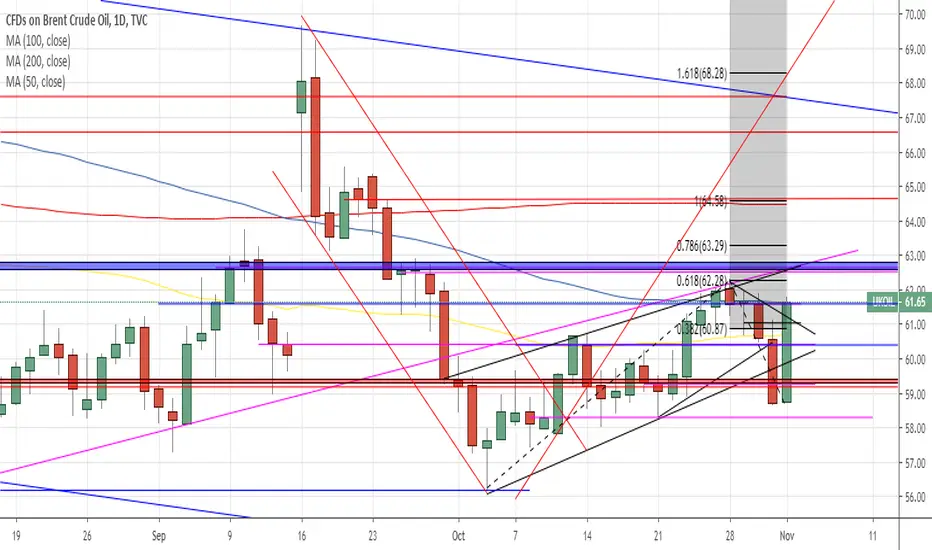
ukoil bullish trendline after double buttom for 04.11.2019ukoil bullish trendline after double buttom. bullish buy to takeprofit 64.48
#USOILSupport and resistance are specified;
The price has fallen in the purple range and should wait and see which side will move;
Time limit is specified;
We have to wait and wait for the move;
Downtrend has been on the back;
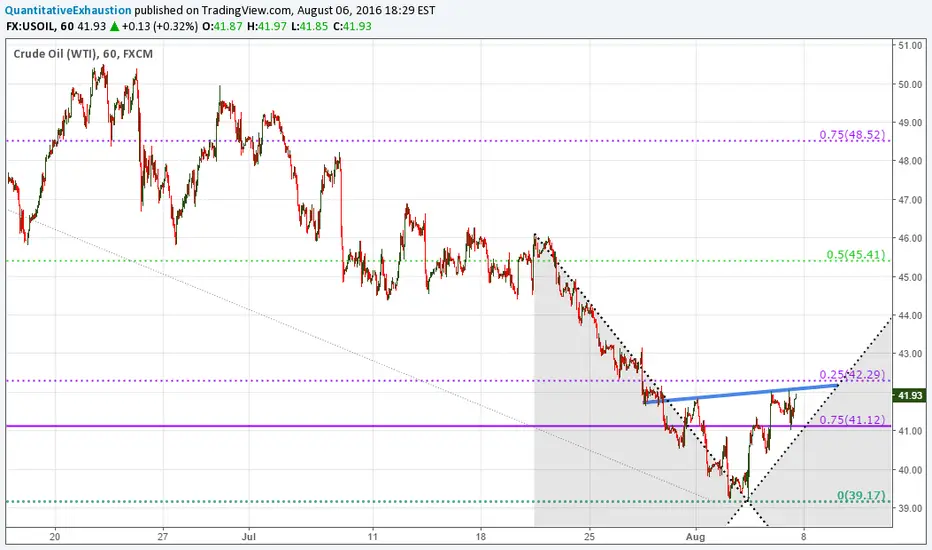
US OIL Trade Plan Switched Oil holding (UWTI) near 40 and looking to hold long till target is reached $45.40. As you can see I have mapped out important support and resistance area using a 50% high/low method. Pivots and S/R was drawn from recent June through August High/Low as well as 2008 high to Feb. 11 this year low.
I will follow up with a short position (DWTI) when 45.40 area target is reached. I don't expect oil to go further than 42 after reaching 45.4 target. After short position, I will later look for a long position and a big move -- 56 area.