Oil
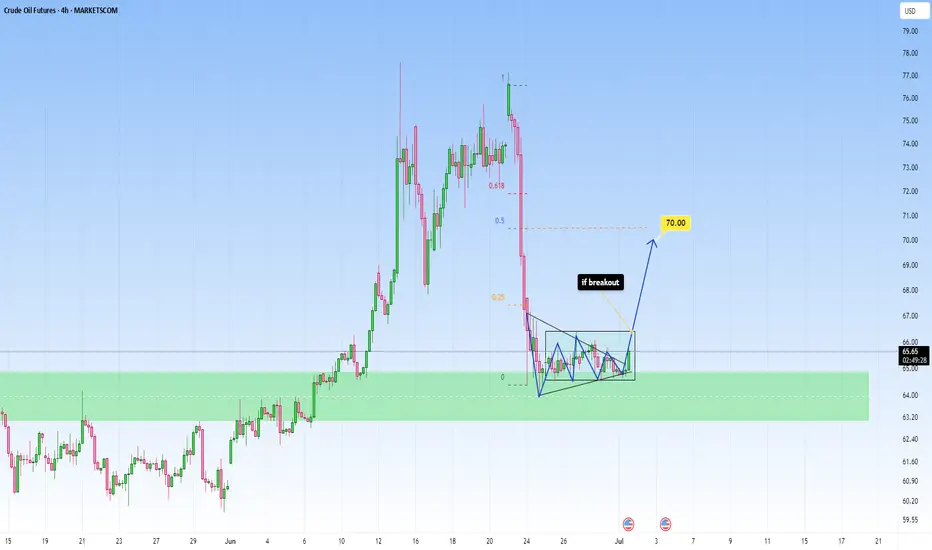
OIL fell sharply, opportunity for upside target of 70$OIL fell sharply and has now been in a contraction for a while, I am taking it into account for a potential breakout, as it shows tightening price action, which reflects market indecision.
Price action has now coiled into a symmetrical triangle, this is often a classic continuation or reversal pattern, and it’s building pressure for a potential breakout. So, if we do get a clean breakout above this pattern, with strong bullish candles, volume, or bullish divergence, that’s your confirmation cue.
This is totally achievable. It aligns beautifully with the 0.25 to 0.5 Fibonacci retracement zone from the recent swing high to low. It’s not just a psychological round number, it’s technically supported.
If the lower boundary of the triangle is broken with momentum, you’ve got to step back. No trade is better than a bad one. Watch how price interacts with the zone. If it loses it, you could be looking at a deeper leg down, potentially revisiting deeper support levels from prior bullish structure.
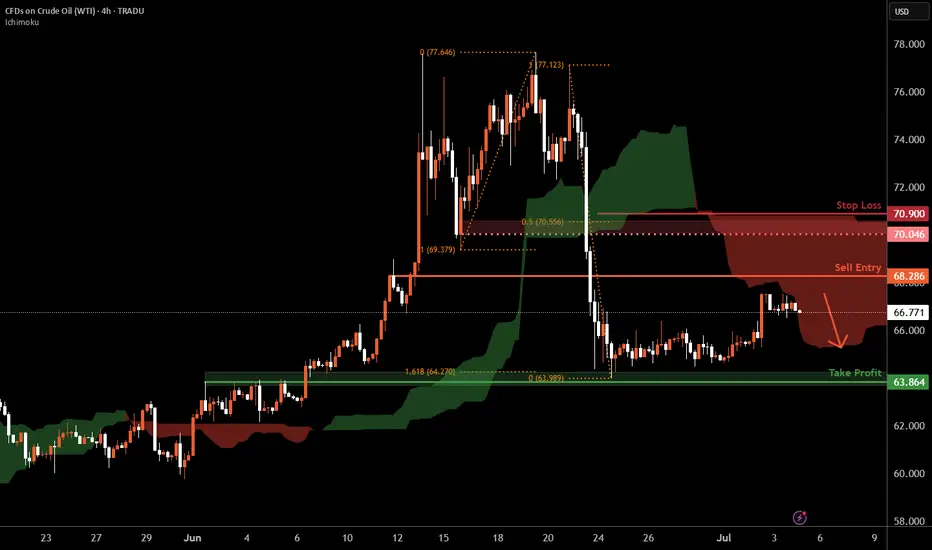
WTI Oil H4 | Potential bearish reversalWTI oil (USOIL) could rise towards a pullback resistance and potentially reverse off this level to drop lower.
Sell entry is at 68.28 which is a pullback resistance.
Stop loss is at 70.90 which is a level that sits above the 50% Fibonacci retracement and a pullback resistance.
Take profit is at 63.86 which is a pullback support that aligns closely with the 161.8% Fibonacci extension.
High Risk Investment Warning
Trading Forex/CFDs on margin carries a high level of risk and may not be suitable for all investors. Leverage can work against you.
Stratos Markets Limited (tradu.com ):
CFDs are complex instruments and come with a high risk of losing money rapidly due to leverage. 63% of retail investor accounts lose money when trading CFDs with this provider. You should consider whether you understand how CFDs work and whether you can afford to take the high risk of losing your money.
Stratos Europe Ltd (tradu.com ):
CFDs are complex instruments and come with a high risk of losing money rapidly due to leverage. 63% of retail investor accounts lose money when trading CFDs with this provider. You should consider whether you understand how CFDs work and whether you can afford to take the high risk of losing your money.
Stratos Global LLC (tradu.com ):
Losses can exceed deposits.
Please be advised that the information presented on TradingView is provided to Tradu (‘Company’, ‘we’) by a third-party provider (‘TFA Global Pte Ltd’). Please be reminded that you are solely responsible for the trading decisions on your account. There is a very high degree of risk involved in trading. Any information and/or content is intended entirely for research, educational and informational purposes only and does not constitute investment or consultation advice or investment strategy. The information is not tailored to the investment needs of any specific person and therefore does not involve a consideration of any of the investment objectives, financial situation or needs of any viewer that may receive it. Kindly also note that past performance is not a reliable indicator of future results. Actual results may differ materially from those anticipated in forward-looking or past performance statements. We assume no liability as to the accuracy or completeness of any of the information and/or content provided herein and the Company cannot be held responsible for any omission, mistake nor for any loss or damage including without limitation to any loss of profit which may arise from reliance on any information supplied by TFA Global Pte Ltd.
The speaker(s) is neither an employee, agent nor representative of Tradu and is therefore acting independently. The opinions given are their own, constitute general market commentary, and do not constitute the opinion or advice of Tradu or any form of personal or investment advice. Tradu neither endorses nor guarantees offerings of third-party speakers, nor is Tradu responsible for the content, veracity or opinions of third-party speakers, presenters or participants.
Crude oil moves up alternately during the day
💡Message Strategy
WTI crude oil prices snapped a three-day winning streak and were trading around $66.00 a barrel in early European trading Thursday. Crude oil prices fell as rising U.S. crude inventories heightened concerns about weak demand in the United States, the world's largest oil consumer.
📊Technical aspects
From the daily chart level, crude oil fluctuates upward in the medium term and tests around 78. The K-line closes with a large real negative line, which has not yet destroyed the moving average system and is still supported. The medium-term objective upward trend remains unchanged.
However, from the perspective of momentum, the MACD indicator crosses downward above the zero axis, indicating that the bullish momentum is weakening. It is expected that the medium-term trend of crude oil will fall into a high-level oscillation pattern.
The short-term trend of crude oil (4H) fluctuated and consolidated for two trading days. The oil price repeatedly crossed the moving average system, and the objective trend direction fluctuated. From the perspective of the primary and secondary rhythms, the current rhythm is a secondary oscillation rhythm. According to the law of primary and secondary alternation, the subjective trend still maintains an upward direction. In terms of momentum, there are signs of weakening upward momentum, and it is expected that the crude oil trend will continue to be mainly upward.
💰Strategy Package
Long Position:65.50-66.00,SL:64.50,Target:69.00-70.00
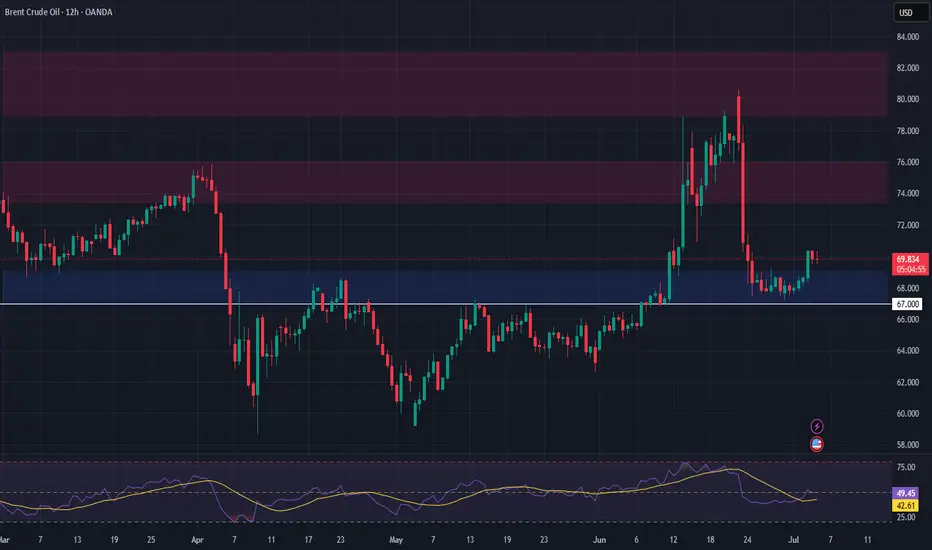
Brent Crude Oil Long Swing Setup – Support Break at Key LevelBrent Crude Oil OANDA:BCOUSD has broken to the next key support level after a cease-fire announcement in the Middle East. A long position is considered only if support holds at $69.00.
📌 Trade Setup:
• Entry Zone: $69.00
• Take Profit Targets:
🥇 $73.50 – $76.00
🥈 $79.00 – $83.00
• Stop Loss: Daily close below $67.00
#BrentCrude #OilTrading #ForexTrading #LongPosition #SupportLevel #TradeSetup #CrudeOil #MarketAnalysis #TradingOpportunities #Commodities #OilMarket #Investing #PriceAction #OilPrices #TradingStrategy #ForexCommunity #InvestmentOpportunities #MarketUpdate
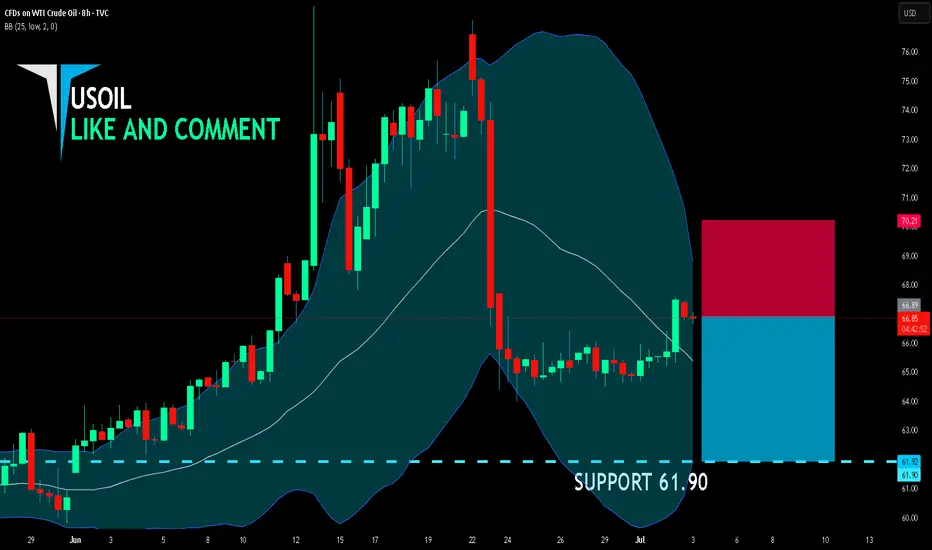
USOIL BEARS ARE GAINING STRENGTH|SHORT
USOIL SIGNAL
Trade Direction: short
Entry Level: 66.89
Target Level: 61.90
Stop Loss: 70.21
RISK PROFILE
Risk level: medium
Suggested risk: 1%
Timeframe: 8h
Disclosure: I am part of Trade Nation's Influencer program and receive a monthly fee for using their TradingView charts in my analysis.
✅LIKE AND COMMENT MY IDEAS✅
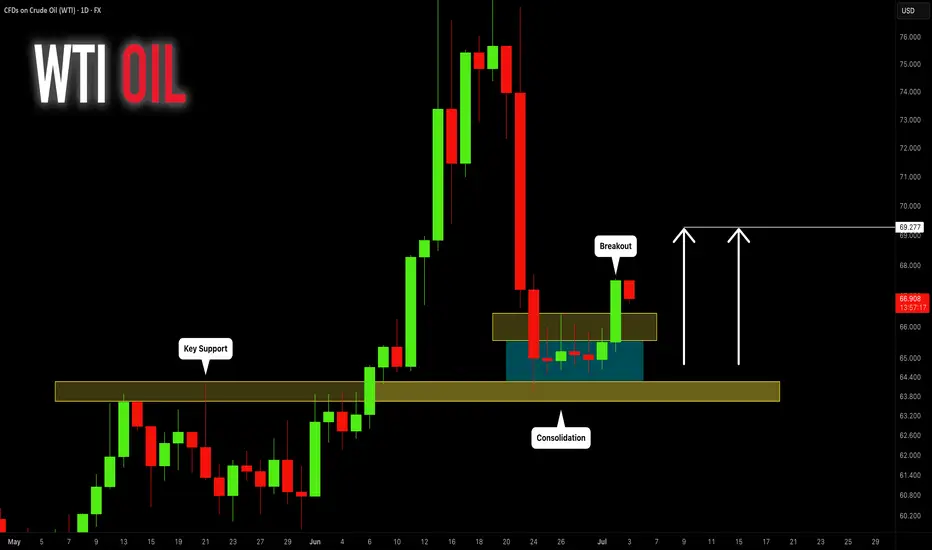
CRUDE OIL (WTI): Consolidation is Over
Crude Oil was consolidating for 6 trading days in a row
after a test of a key daily support.
The yesterday's Crude Oil Inventories data made the market bullish
and the price successfully violated a minor resistance of a sideways movement.
We can expect that the market will grow more.
Next resistance - 69.27
❤️Please, support my work with like, thank you!❤️
USOIL is Nearing the Daily TrendHey Traders, in tomorrow's trading session we are monitoring USOIL for a buying opportunity around 64.30 zone, USOIL is trading in an uptrend and currently is in a correction phase in which it is approaching the trend at 64.30 support and resistance area.
Trade safe, Joe.

Sudden Oil Spike - what you need to know!Iran suspended cooperation with the U.N. nuclear watchdog, amid a surprise build in US crude inventories.
Iran’s move added a modest risk premium to prices, though analysts noted that no actual supply disruptions have occurred.
$66 is a key level for WTI crude to hold above.
If it can maintain this area, we will likely see higher price. $66 is a multi year trendline of support going back to 2021.
Energy stocks / XLE basket is showing some bullish divergence, perhaps indicating this oil move has legs.

USOIL:Narrow trading strategy
USOIL: There is no update in the past two days, because the oil price still continues to fluctuate in a narrow range, and the space for volatility is gradually reduced, which is not very different from our overall trading idea. The original long target of 65.9-66.4 can be adjusted to 65.8-66.2 with the reduction of the space for volatility. It is expected that the trend will come out this week, and we will adjust our thinking then.
Friends who do not trade at present can refer to the interval trading strategy within a day:
BUY@64.7-65
TP: 65.8 to 66.2
SELL@65.8-66.2
TP: 64.7-65
More detailed strategies and trading will be notified here ↗↗↗
Keep updated, come to "get" ↗↗↗
USOIL:Today's trading strategy
Oil prices have been sideways for the fourth trading day, volatility began to narrow, the market is brewing a new round of trend, short-term range 64-66.4. Today you can sell high and buy low around a narrow range.
Trading Strategy:
BUY@64.7-65.1
TP: 65.9-66.4
SELL: 66-66.4
TP: 65.1-64.5
More detailed strategies and trading will be notified here ↗↗↗
Keep updated, come to "get" ↗↗↗
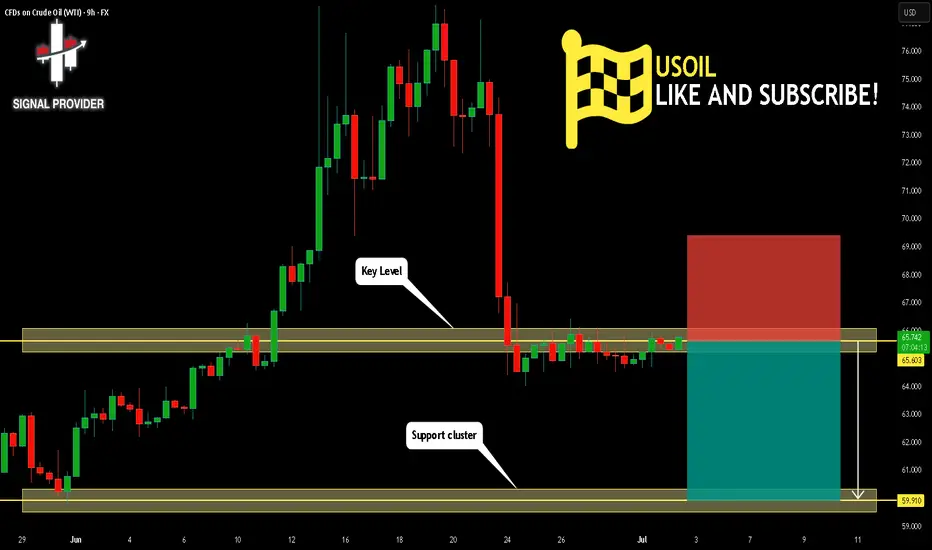
USOIL Will Fall! Sell!
Take a look at our analysis for USOIL.
Time Frame: 9h
Current Trend: Bearish
Sentiment: Overbought (based on 7-period RSI)
Forecast: Bearish
The market is testing a major horizontal structure 65.603.
Taking into consideration the structure & trend analysis, I believe that the market will reach 59.910 level soon.
P.S
The term oversold refers to a condition where an asset has traded lower in price and has the potential for a price bounce.
Overbought refers to market scenarios where the instrument is traded considerably higher than its fair value. Overvaluation is caused by market sentiments when there is positive news.
Disclosure: I am part of Trade Nation's Influencer program and receive a monthly fee for using their TradingView charts in my analysis.
Like and subscribe and comment my ideas if you enjoy them!
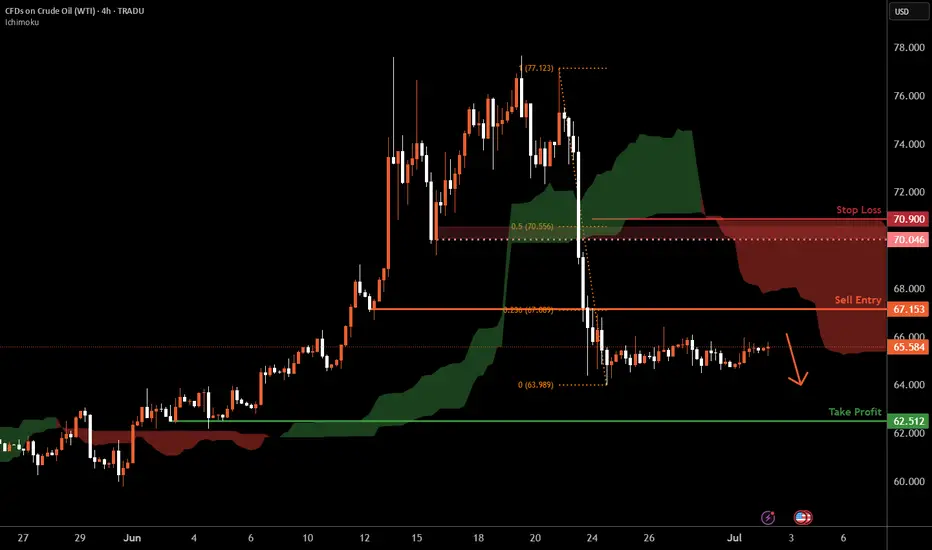
WTI Oil H4 | Potential bearish reversalWTI oil (USOIL) is rising towards a pullback resistance and could potentially reverse off this level to drop lower.
Sell entry is at 67.15 which is a pullback resistance that aligns with the 23.6% Fibonacci retracement.
Stop loss is at 70.90 which is a level that sits above the 50% Fibonacci retracement and a pullback resistance.
Take profit is at 62.51 which is a swing-low support.
High Risk Investment Warning
Trading Forex/CFDs on margin carries a high level of risk and may not be suitable for all investors. Leverage can work against you.
Stratos Markets Limited (tradu.com ):
CFDs are complex instruments and come with a high risk of losing money rapidly due to leverage. 63% of retail investor accounts lose money when trading CFDs with this provider. You should consider whether you understand how CFDs work and whether you can afford to take the high risk of losing your money.
Stratos Europe Ltd (tradu.com ):
CFDs are complex instruments and come with a high risk of losing money rapidly due to leverage. 63% of retail investor accounts lose money when trading CFDs with this provider. You should consider whether you understand how CFDs work and whether you can afford to take the high risk of losing your money.
Stratos Global LLC (tradu.com ):
Losses can exceed deposits.
Please be advised that the information presented on TradingView is provided to Tradu (‘Company’, ‘we’) by a third-party provider (‘TFA Global Pte Ltd’). Please be reminded that you are solely responsible for the trading decisions on your account. There is a very high degree of risk involved in trading. Any information and/or content is intended entirely for research, educational and informational purposes only and does not constitute investment or consultation advice or investment strategy. The information is not tailored to the investment needs of any specific person and therefore does not involve a consideration of any of the investment objectives, financial situation or needs of any viewer that may receive it. Kindly also note that past performance is not a reliable indicator of future results. Actual results may differ materially from those anticipated in forward-looking or past performance statements. We assume no liability as to the accuracy or completeness of any of the information and/or content provided herein and the Company cannot be held responsible for any omission, mistake nor for any loss or damage including without limitation to any loss of profit which may arise from reliance on any information supplied by TFA Global Pte Ltd.
The speaker(s) is neither an employee, agent nor representative of Tradu and is therefore acting independently. The opinions given are their own, constitute general market commentary, and do not constitute the opinion or advice of Tradu or any form of personal or investment advice. Tradu neither endorses nor guarantees offerings of third-party speakers, nor is Tradu responsible for the content, veracity or opinions of third-party speakers, presenters or participants.
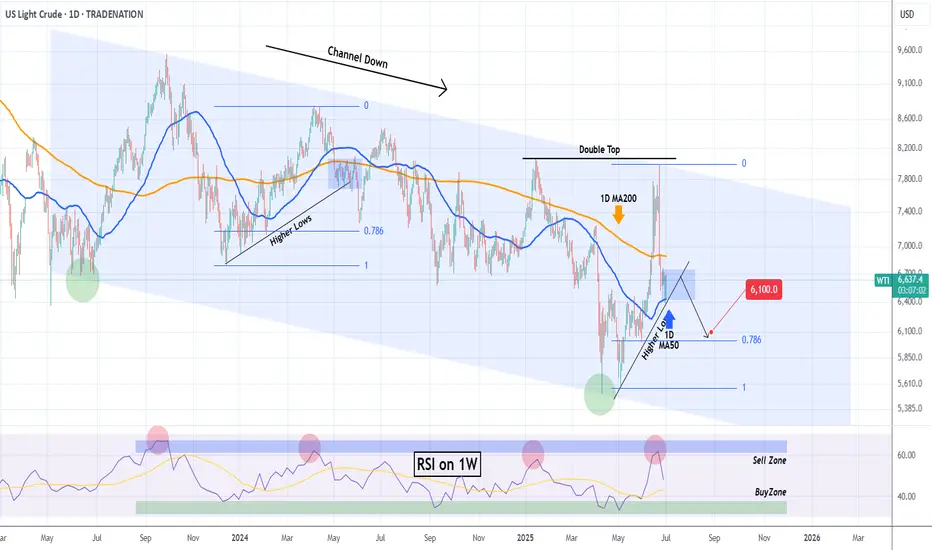
WTI OIL This is the only Support right now.WTI Crude Oil (USOIL) is so far holding its 1D MA50 (blue trend-line), the natural medium-term Support, following a quick price deflation after the Israel - Iran de-escalation.
In our opinion, the trend-line that currently matters most though, is the Higher Lows coming straight from the May 05 Low. If broken, we expect a quick test of the 0.786 Fibonacci retracement level, as it resembles the December 2023 - May 2024 Higher Lows trend-line.
Even the 1W RSI is similar among the two fractals, and it has to be said that both are part of the 2-year Channel Down pattern.
So if the Higher Lows trend-line breaks, we can target $61.00.
-------------------------------------------------------------------------------
** Please LIKE 👍, FOLLOW ✅, SHARE 🙌 and COMMENT ✍ if you enjoy this idea! Also share your ideas and charts in the comments section below! This is best way to keep it relevant, support us, keep the content here free and allow the idea to reach as many people as possible. **
-------------------------------------------------------------------------------
Disclosure: I am part of Trade Nation's Influencer program and receive a monthly fee for using their TradingView charts in my analysis.
💸💸💸💸💸💸
👇 👇 👇 👇 👇 👇
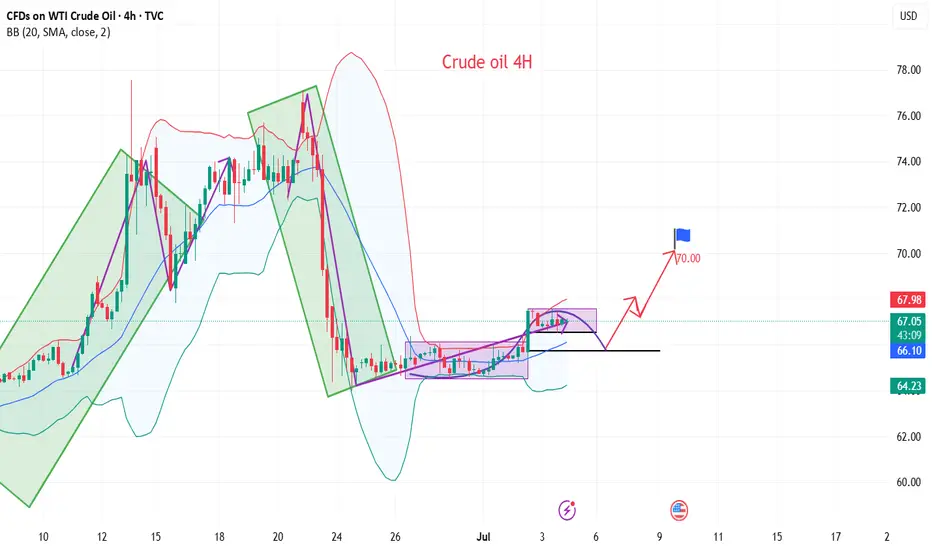
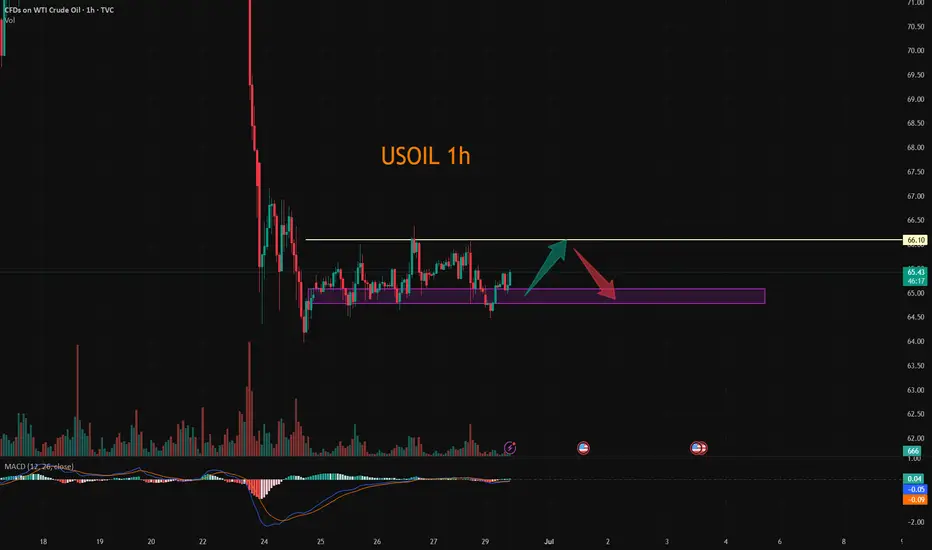
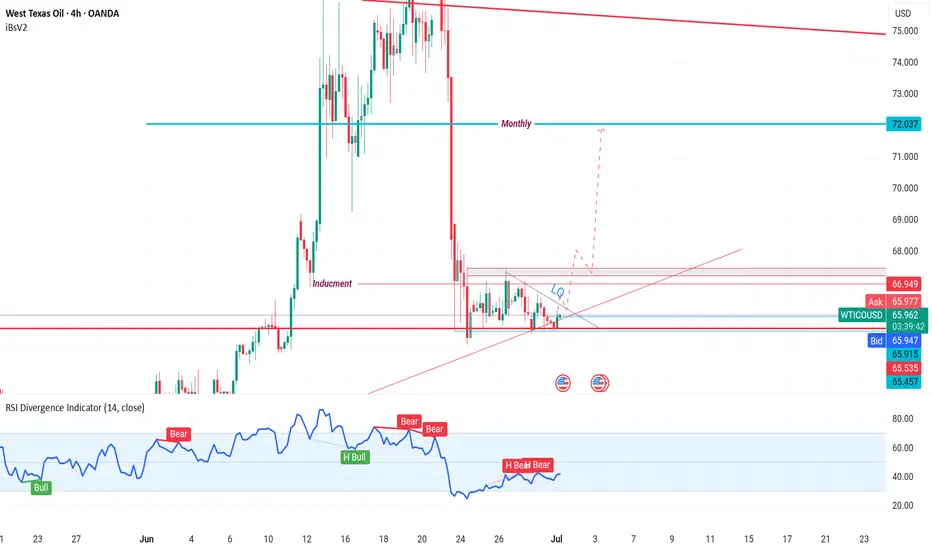
WTI on high time frame
"Hello traders, focusing on WTI crude oil, the price surged to $78 but sharply retreated to the $65 zone. Over the last five days, the price has consolidated. I believe that the signals from the recent 4-hour candle suggest a potential move towards higher prices, with the next target possibly being around $72. I will be monitoring the price action around $72 closely for a potential rejection or continuation towards even higher prices."
If you need further assistance or have additional insights to share, feel free to let me know.
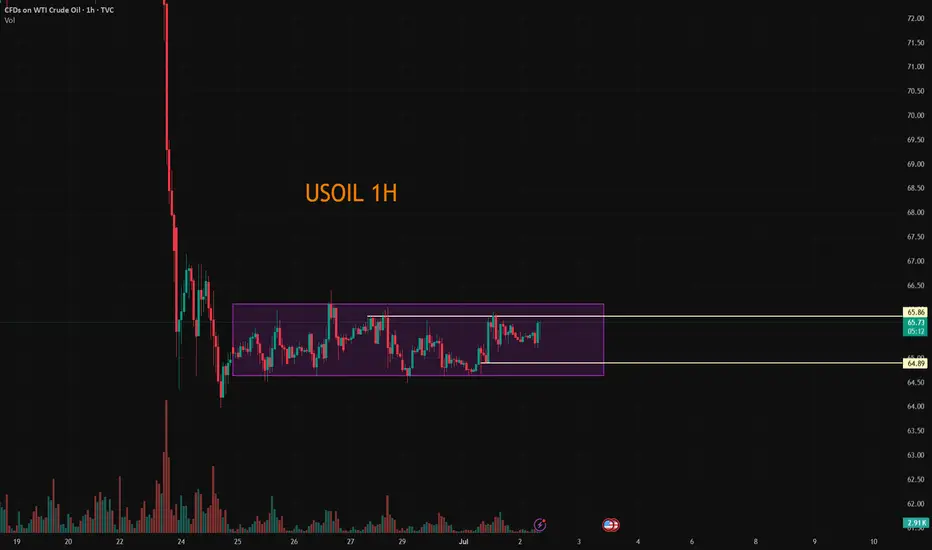
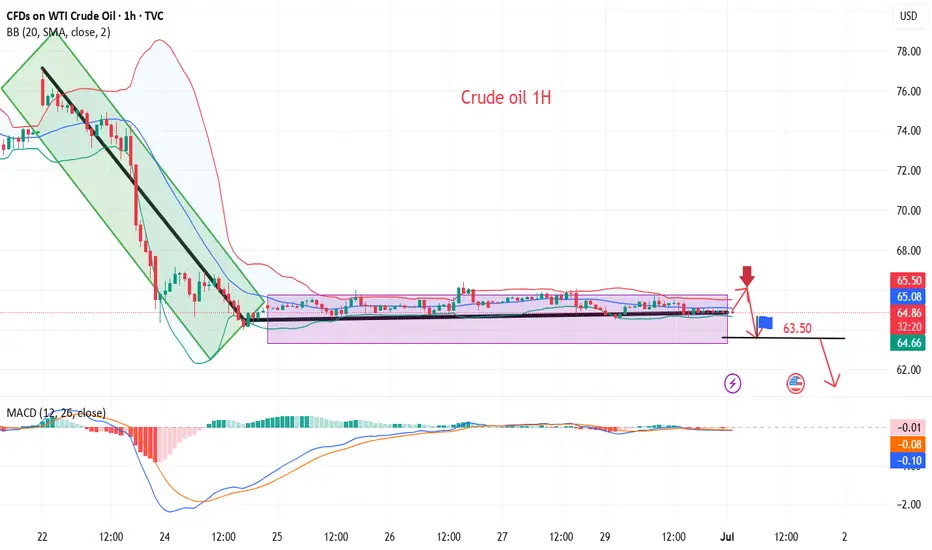
#USOIIL #WTI 1H📈 #USOIL 1H Buy Setup – Liquidity Sweep in Play
Crude Oil is consolidating after a sharp decline, forming a potential setup for a liquidity sweep below the current range, followed by a bullish reversal. We're anticipating a fakeout move to grab sell-side liquidity before price targets the Fair Value Gap (FVG) and premium supply zone above.
🟩 Buy Limit: 64.50 / 64.00
🎯 Targets: 70.00 → 72.00+
❌ Stop Loss: 63.00
This setup offers high risk-to-reward potential if the liquidity sweep plays out as expected. Monitor price action closely at the buy zone.
#CrudeOil #WTI #SmartMoney #TradingStrategy

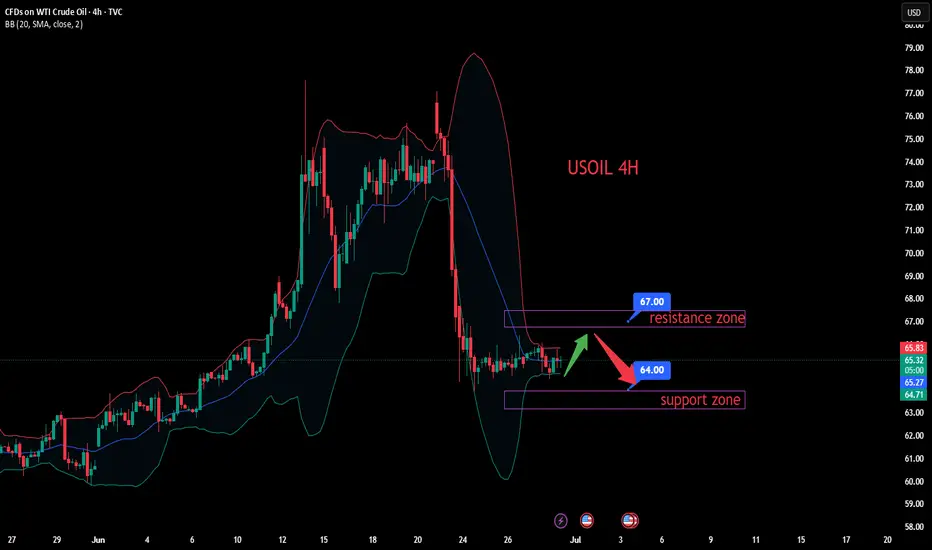
Crude oil continues to correct, short-term ideas
💡Message Strategy
WTI crude oil prices recovered from a two-week low but remained about $12 below the previous Monday's high as upside was limited by Middle East peace and expectations that OPEC+ countries will agree to increase supply again this week.
📊Technical aspects
From the daily chart level, crude oil fluctuates upward in the medium term and tests around 75. The K-line closes with a large real negative line, which has not yet destroyed the moving average system and is still supported. The medium-term objective upward trend remains unchanged.
However, from the perspective of momentum, the MACD indicator crosses downward above the zero axis, indicating that the bullish momentum is weakening. It is expected that the medium-term trend of crude oil will fall into a high-level oscillation pattern.
The short-term trend of crude oil (1H) continues to fluctuate in a narrow range, and the oil price falls back to the lower edge of the range. Pay attention to the support strength of 64. In terms of momentum, the MACD indicator is at the zero axis position, and the long and short forces are equal. It is expected that the trend of crude oil will maintain a fluctuating consolidation pattern during the day.
💰Strategy Package
Short Position:65.50-66.50,SL:67.50,Target: 64.00-63.00
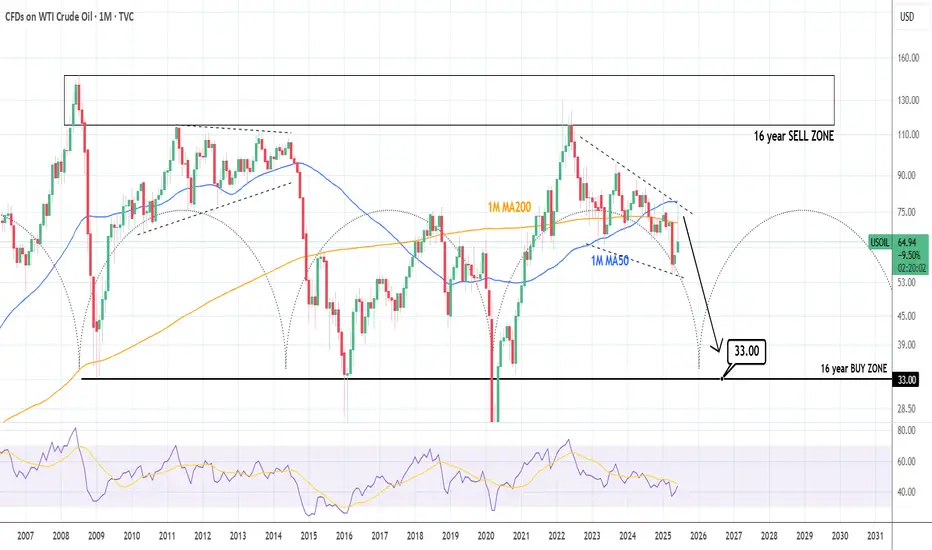
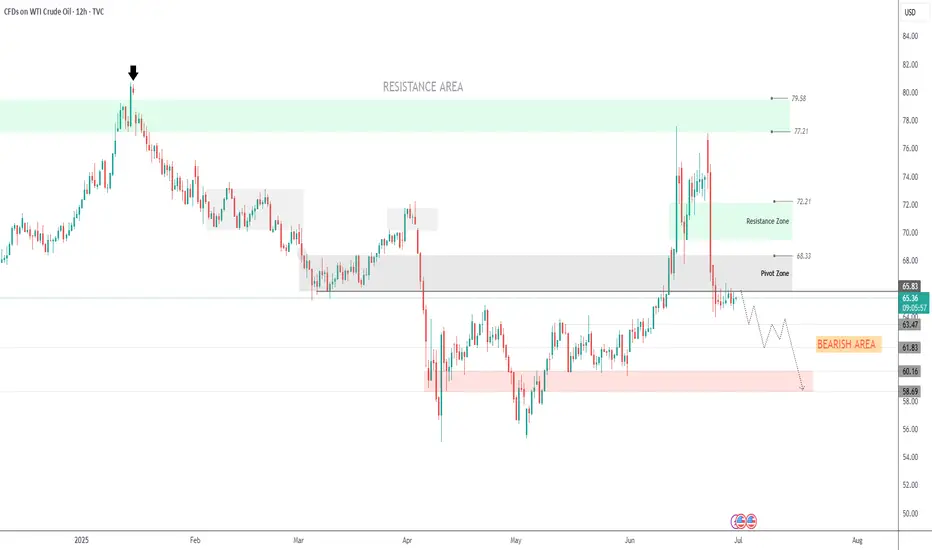
WTI CRUDE OIL: Brutal collapse expectedWTI Crude Oil has turned bearish again on its 1D technical outlook (RSI = 44.990, MACD = 0.310, ADX = 38.289) and is expected to accelerate the effect as based on the 16 year Cycles, late 2025 and most of 2026 should experience a price collapse. The most optimal Buy Zone starts at $33.00, it could go lower but that's a solid base from which to expect a bounce back above $110.00 by 2028.
## If you like our free content follow our profile to get more daily ideas. ##
## Comments and likes are greatly appreciated. ##
Latest Long - Short Trading Recommendations for Crude OilDuring Monday's Asian trading session, international oil prices fell, primarily due to the combined impact of eased geopolitical tensions in the Middle East and expectations of OPEC+ production increases, which raised market supply outlooks. Although the two major benchmark oil prices recorded their largest weekly decline since March 2023 last week, they are still set to post consecutive monthly gains for June, with increases exceeding 5% each. The market had previously surged due to Middle East tensions. Since Israel struck Iranian nuclear facilities on June 13, the situation rapidly deteriorated, and the U.S. subsequently air-raided Iranian nuclear targets, pushing Brent prices to briefly surge above $80 per barrel. Current oil price movements are clearly constrained by a dual influence of geopolitics and supply expectations. While geopolitical conflicts have temporarily eased, the long-term stability of the Middle East situation remains uncertain. On the other hand, the game between OPEC+'s orderly production increase and insufficient U.S. shale oil production momentum will determine the direction of oil price fluctuations in the coming months. Against the backdrop of a moderate global economic recovery, oil prices maintaining a range of $60-70 per barrel may become a short-term norm.
you are currently struggling with losses,or are unsure which of the numerous trading strategies to follow,You have the option to join our VIP program. I will assist you and provide you with accurate trading signals, enabling you to navigate the financial markets with greater confidence and potentially achieve optimal trading results.
Trading Strategy:
sell@66.3-66.9
TP:63.1-63.3
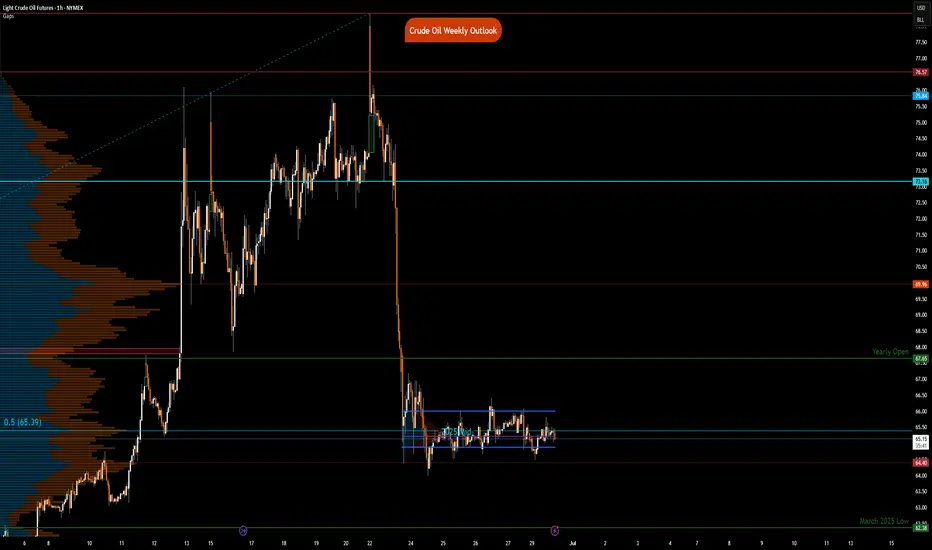
Crude Oil Weekly OutlookNYMEX:CL1! NYMEX:MCL1!
With Nasdaq futures hitting all-time highs, our attention now turns to Crude Oil, which has seen a sharp pullback over the past week.
All-time highs in equity indices present a unique challenge:
There are no historical reference points—no prior price or volume data to lean against. Traders typically turn to tools like Fibonacci extensions, measured moves, or rely on market-generated information and emerging intraday levels before making decisions.
What Has the Market Done?
Crude Oil Futures (CL) posted a record drop last week, falling sharply from a Sunday open high of $78.40 to a Monday close low of $64.38—a $14.02 decline.
This sharp sell-off followed developments suggesting a potential Iran–Israel ceasefire and the end of a two-week conflict, prompting markets to rapidly unwind the geopolitical risk premium.
What is it trying to do?
CL Futures have since consolidated around the 2025 mid-range. The market appears to be in a balancing phase, digesting the removal of war-related premiums and recalibrating based on fundamentals.
How Good of a Job Is It Doing?
Having effectively priced out war risk, the market is now refocusing on fundamentals.
The global demand outlook is improving, driven in part by progress in trade deals.
OPEC’s June Monthly Oil Market Report (MOMR) forecasts global oil demand growth of 1.3 mb/d for 2025.
This transition from headline risk to fundamental drivers indicates market maturity and resilience, albeit within a still-volatile regime.
What Is More Likely to Happen From Here?
Today marks the final trading day of the month, and seasonal demand will become increasingly relevant.
Summer weather and travel activity are expected to drive demand for jet fuel and gasoline.
These seasonal tailwinds, if sustained, could help stabilize price action around key technical zones.
Key Levels:
yOpen: 67.65
pHi: 66.09
pIB Hi: 66
2025 mid-range: 65.39
pLow: 64.80
Overnight Low: 64.55
Naked VPOC: 64.50
Scenario 1: Continued Consolidation (Balance Holds)
Crude oil maintains range-bound behavior.
Strategy: “Outside-in” trading—fade moves at range extremes until new directional information emerges.
Scenario 2: Break from Balance
If directional conviction builds, price could break the current consolidation.
Upside target: Yearly open near $67.65.
Downside risk: March 2025 low if $64.40 fails.
All intraday levels noted above should be monitored for structure and participation.
USOIL:Sharing of the Latest Trading StrategyAll the trading signals last week have resulted in profits!!! Check it!!!👉👉👉
Fundamental Analysis:
The ceasefire agreement between Israel and Iran has eased tensions in the Middle East, the primary factor behind the recent decline in oil prices. Meanwhile, market rumors suggest the U.S. may ease sanctions on Iran, which—if realized—would raise expectations of increased crude supply and further pressure oil prices.
Additionally, OPEC+ plans to continue increasing production by 411,000 barrels per day in July, with supply growth expectations exerting long-term downward pressure on oil.
Technical Analysis (4-Hour Chart):
USOIL prices have pulled back from highs and currently hover near $65.20, approaching the S2 pivot point at around $64.69 and the 4-hour 200-period moving average. The prior appearance of a long candlestick may signal short-term support.
Notwithstanding, the current market remains in a bearish trend, so the strategy prioritizes buying on rebounds.
Trading Strategy:
Sell@67-66
TP:65-64
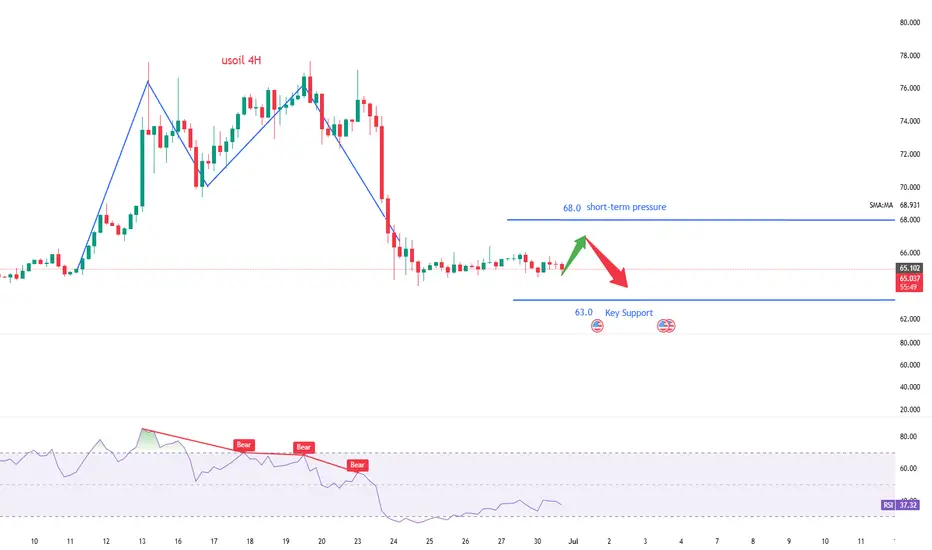
OIL |Bearish Pressure Builds as OPEC+ Prepares Fresh Output Hike OIL | Market Overview
Oil prices edged lower on Monday despite strong seasonal demand, as the market prepares for an increase in supply. OPEC+ is set to raise production by 411,000 barrels per day starting Tuesday, marking the fourth monthly increase in output. Another similar hike is reportedly under consideration for August, which may further pressure prices.
Technical Outlook
The price remains within the bearish zone and is expected to continue its decline as long as it trades below the pivot level at 65.83.
A daily candle close above 65.83 is required to confirm a potential bullish reversal.
Until then, the bearish trend remains intact, targeting 63.47, 61.83, and potentially 60.16.
Key Levels
Pivot: 65.83
Support: 63.47 / 61.83 / 60.16
Resistance: 68.33 / 69.55
Market Analysis: Oil Slides — Traders Eye Macro TriggersMarket Analysis: Oil Slides — Traders Eye Macro Triggers
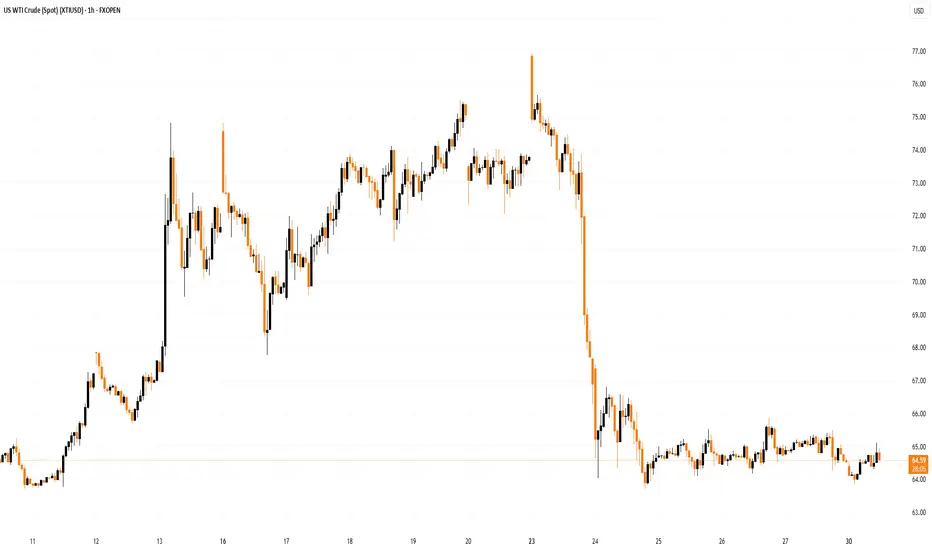
WTI Crude oil is down over 15% and remains at risk of more losses.
Important Takeaways for WTI Crude Oil Price Analysis Today
- WTI Crude oil extended losses below the $68.00 support zone.
- A major bearish trend line is forming with resistance near $65.60 on the hourly chart of XTI/USD at FXOpen.
Technical Analysis of WTI Crude Oil Price
On the hourly chart of WTI Crude Oil at FXOpen, the price struggled to continue higher above $77.00 against the US Dollar. The price formed a short-term top and started a fresh decline below $72.00.
There was a steady decline below the $70.00 pivot level. The bears even pushed the price below $68.00 and the 50-hour simple moving average. Finally, the price tested the $63.70 zone. The recent swing low was formed near $63.69, and the price is now consolidating losses.
On the upside, immediate resistance is near the $65.60 zone. There is also a major bearish trend line forming with resistance near $65.60. The next resistance is near the $66.80 level or the 23.6% Fib retracement level of the downward move from the $76.93 swing high to the $63.69 low.
The main resistance is $70.30 and the 50% Fib retracement level. A clear move above the $70.30 zone could send the price toward $71.90.
The next key resistance is near $76.90. If the price climbs further higher, it could face resistance near $78.00. Any more gains might send the price toward the $80.00 level.
Immediate support is near the $63.70 level. The next major support on the WTI Crude Oil chart is near $62.00. If there is a downside break, the price might decline toward $60.00. Any more losses may perhaps open the doors for a move toward the $55.00 support zone.
This article represents the opinion of the Companies operating under the FXOpen brand only. It is not to be construed as an offer, solicitation, or recommendation with respect to products and services provided by the Companies operating under the FXOpen brand, nor is it to be considered financial advice.