USOIL TVC:USOIL :
if it break above the purple line and shows a accumulation. so I am going to buy it.
but if it doesn't I will not open trade on it.
Oil
Risk On! Buy Stock Indices, Sell Gold, Silver.In this Weekly Market Forecast, we will analyze the S&P 500, NASDAQ, DOW JONES, Gold and Silver futures, for the week of June 29 - July 4th..
Stock Indices are pointed to the all time highs. Take advantage of the "risk on" environment while it lasts!
Gold and Silver have seen the outflows and profit taking... so look for lower prices this week.
Oil ... be patient. After a huge dump in prices when the tensions eased up between Israel/US and Iran, price is moving sideways in consolidation. I suspect lower prices to come, but I urge patience! Wait for the signature of price to show it intends to move lower. A sweep of the range highs and a run of the range lows right after... is the signal to sell.
Enjoy!
May profits be upon you.
Leave any questions or comments in the comment section.
I appreciate any feedback from my viewers!
Like and/or subscribe if you want more accurate analysis.
Thank you so much!
Disclaimer:
I do not provide personal investment advice and I am not a qualified licensed investment advisor.
All information found here, including any ideas, opinions, views, predictions, forecasts, commentaries, suggestions, expressed or implied herein, are for informational, entertainment or educational purposes only and should not be construed as personal investment advice. While the information provided is believed to be accurate, it may include errors or inaccuracies.
I will not and cannot be held liable for any actions you take as a result of anything you read here.
Conduct your own due diligence, or consult a licensed financial advisor or broker before making any and all investment decisions. Any investments, trades, speculations, or decisions made on the basis of any information found on this channel, expressed or implied herein, are committed at your own risk, financial or otherwise.

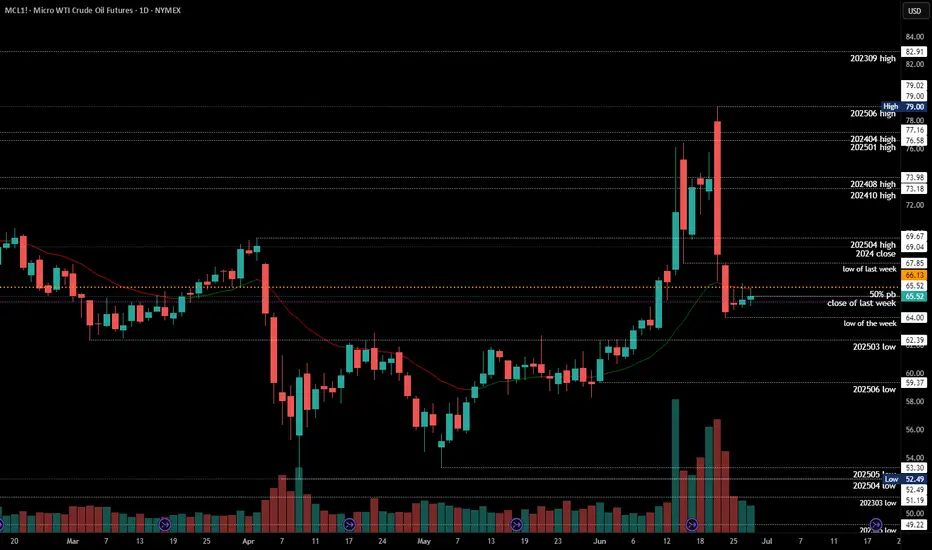
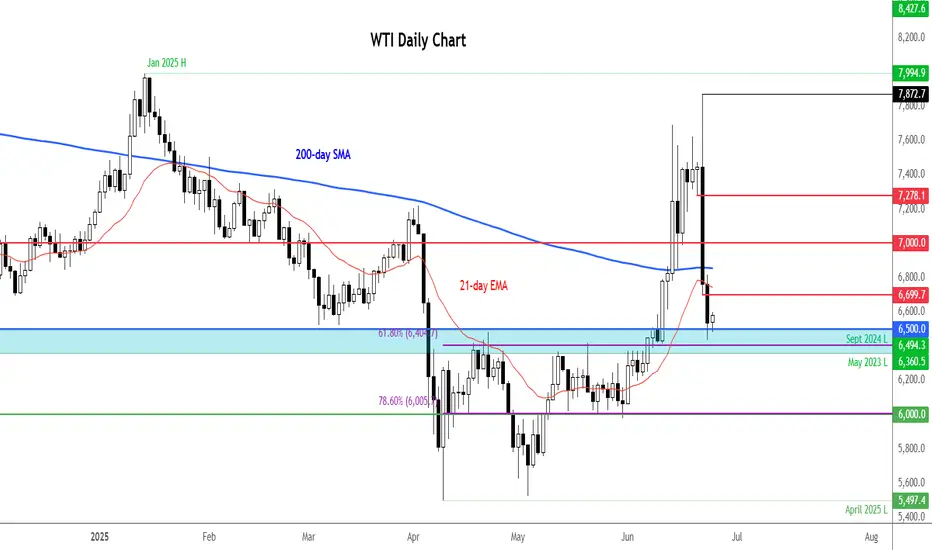
#202526 - priceactiontds - weekly update - wti crude oil futuresGood Day and I hope you are well.
#mcl1 - wti crude oil futures
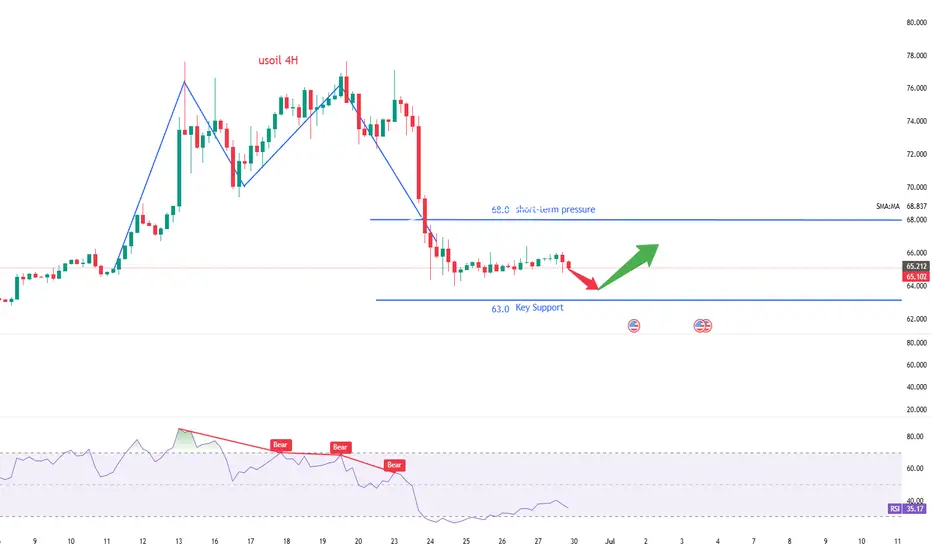
comment: Yeah I don’t know about this one. Your guess is as good as mine. I could even see this touching 63 before going higher again. Most erratic and extreme price action the past 2 weeks, so maybe wait a bit before jumping the train here.
current market cycle: trading range
key levels: 63 - 80
bull case: Bulls don’t have much. They could not close one decent bar at the high since 2025-06-11 and despite all the bull spikes, we only sold afterwards and are back below 65 where the extreme breakout happened. Best guess here is that we stay above 63 and go sideways. Sideways up to where? No idea. Could be 68, could be 70.
Invalidation is below 63
bear case: Too extreme. Both sides have to take quick profits or the next spike will take them away again. So most likely sideways in a range until a newsbomb hit again. Range could be 63 - 68.
Invalidation is above 79
short term: Neutral. Not touching this unless someone threatens me with a gun.
medium-long term - Update from 2025-06-22: Let’s leave this as “todo” for now. No read on this and I won’t make stuff up just to post something.
Gold | Oil | Dollar | Silver | Natural Gas Price Forecast.Gold | Oil | Dollar | Silver | Natural Gas Price Forecast.
NYMEX:NG1! COMEX:GC1! AMEX:UNG COMEX:SI1!

Bulls on the Loose: US Oil Spot/WTI Heist Strategy! 🚨💰 THE OIL VAULT HEIST: US OIL SPOT/WTI TRADING STRATEGY 💸🔫
🌟Hi! Hola! Ola! Bonjour! Hallo! Marhaba!🌟
Dear Money Makers & Robbers 🤑💰💸✈️
Based on our 🔥Thief Trading style analysis🔥 (both technical and fundamental), here’s the master plan to heist the US Oil Spot/WTI Energy Market. Follow the blueprint carefully—this strategy focuses on long entries, with a daring escape planned near the high-risk Red ATR line Zone where bearish robbers and consolidation traps await. 🏆💸 Take your profit and treat yourself, fellow traders—you earned it! 💪🏆🎉
🕵️♂️ Entry 📈
💥 The vault is wide open! Time to swipe that bullish loot—heist is on!
Place buy limit orders within the 15 or 30-minute timeframe, near swing lows/highs for pullback entries.
🛑 Stop Loss 🛑
📍 Thief’s SL—recent swing low and below the moving average (4H timeframe) for day/swing trades.
📍 Adjust SL based on risk, lot size, and number of orders.
🎯 Target
🏴☠️💥 69.000 (Aim for the big loot!) OR escape before the target
🔥 Market Heist Overview
The UK Oil Spot/Brent market is currently showing bullishness 🐂, driven by key factors—perfect for a day/scalping trade robbery! ☝☝☝
📰 Additional Tools & Analysis
📊 Get the Fundamental, Macro, COT Report, Quantitative Analysis, Sentiment Outlook, Intermarket Analysis, Future Targets—check our bi0 liinks 👉👉👉🔗🔗
⚠️ Trading Alert: News Releases & Position Management
📰 News can rattle the vault! 💥
✅ Avoid new trades during news releases.
✅ Use trailing stop-loss orders to protect profits.
💖 Supporting our heist plan?
💥 Smash the Boost Button 💥 to empower the robbery team.
Let’s make money every day in this market with the Thief Trading Style! 🏆💪🤝❤️🎉🚀
👀 Stay tuned for the next robbery plan, thieves! 🤑🐱👤🤗🤩

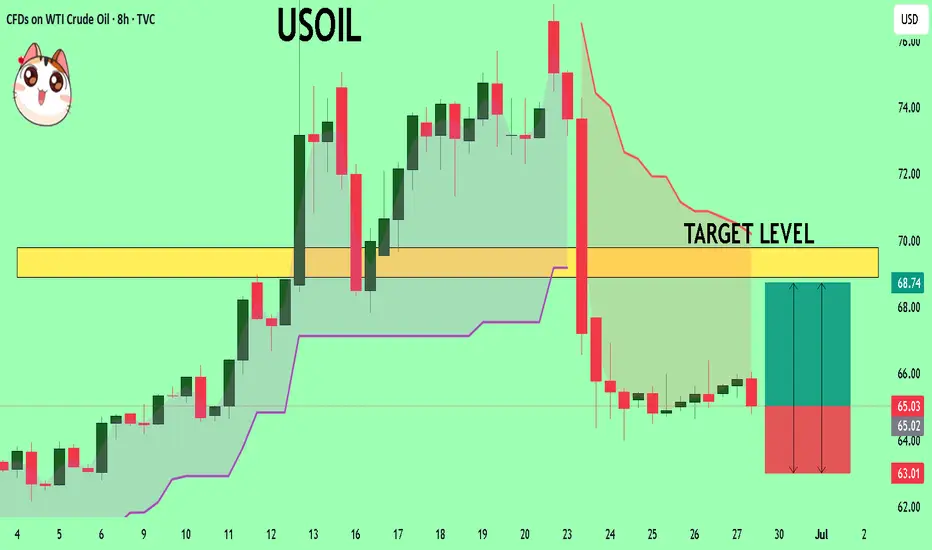
USOIL The Target Is UP! BUY!
My dear friends,
USOIL looks like it will make a good move, and here are the details:
The market is trading on 65.03 pivot level.
Bias - Bullish
Technical Indicators: Supper Trend generates a clear long) signal while Pivot Point HL is currently determining the overall Bullish trend of the market.
Goal - 68.89
Recommended Stop Loss - 63.01
About Used Indicators:
Pivot points are a great way to identify areas of support and resistance, but they work best when combined with other kinds of technical analysis
Disclosure: I am part of Trade Nation's Influencer program and receive a monthly fee for using their TradingView charts in my analysis.
———————————
WISH YOU ALL LUCK
USOIL HEIST ALERT: Thief Entry Loaded – Target Locked!🚨 The Ultimate US OIL / WTI Heist Plan – Thief Trading Style 🎯💸
Hey Money Makers, Hustlers, Market Bandits! 🌍
Hola, Ola, Bonjour, Hallo, Marhaba! 👋🌟
We’re back with a slick WTI energy market heist based on our 🔥Thief Trading Style🔥—powered by a mix of technical & fundamental strategies. The vault is wide open and the bullish loot awaits!
🗺️ Strategy Brief:
We’re aiming for a clean bullish getaway near the high-risk MA zone—where traps are set and bearish robbers lurk. Watch out for overbought zones, trend reversals, and consolidation ambushes.
📈 Entry Point:
“The vault is open! Enter the bullish heist at will.”
Look to place Buy Limit Orders around swing highs/lows or pullback levels on the 15m–30m timeframe.
🛑 Stop Loss:
Set your Thief SL around the recent swing low using the 3H timeframe (example: 60.300).
Adjust based on your risk appetite, lot size, and number of entries.
🎯 Target: 65.200
That's where we celebrate the score, traders! 🥂💸
📊 Heist Justification (Fundamentals + Sentiment):
The WTI market is currently bullish, fueled by a mix of:
✅ Macro economics
✅ COT data
✅ Seasonal trends
✅ Intermarket signals
✅ Inventory & storage dynamics
📌 For full analysis and future target breakdowns, check the linkk in our profilee 🔗👀
⚠️ Important Alert – Manage Your Risk During News:
🚫 Avoid fresh entries during major news releases
✅ Use trailing stops to protect running gains
Stay sharp, stay safe.
💥 Hit the Boost Button if you support the Thief Strategy!
Join the crew, ride the wave, and let’s rob the market like pros 💼🕶️💰
📅 Stay tuned for the next master plan. Another heist is always around the corner.
Until then – steal smart, win big! 🐱👤🔥

Analysis of Crude Oil's Opening Market Strategy on MondayWTI crude oil futures stabilized for the second consecutive day, maintaining fluctuations within the broad range of Tuesday and oscillating around the key level of $65.12. A sustained break below this level would confirm the resurgence of selling pressure, and a breach of $64.00 could trigger a decline toward $61.90. On the upside, if the price holds above $65.12, it may drive a short-term rebound to $67.44, and if momentum strengthens, it could further test $71.20.
Crude oil prices remain range-bound, but downward pressure is building. Robust U.S. demand provides support, yet macroeconomic caution and uncertainties over OPEC+ intentions are suppressing market sentiment. A decisive break below $65.12 would confirm the bearish trend, with bears targeting $61.90. Conversely, if this level holds, neutral-to-bullish logic remains valid, though upside potential remains constrained unless supply-demand signals converge overall.
you are currently struggling with losses,or are unsure which of the numerous trading strategies to follow,You have the option to join our VIP program. I will assist you and provide you with accurate trading signals, enabling you to navigate the financial markets with greater confidence and potentially achieve optimal trading results.
Trading Strategy:
buy@63.1-63.3
TP:66.3-69.9
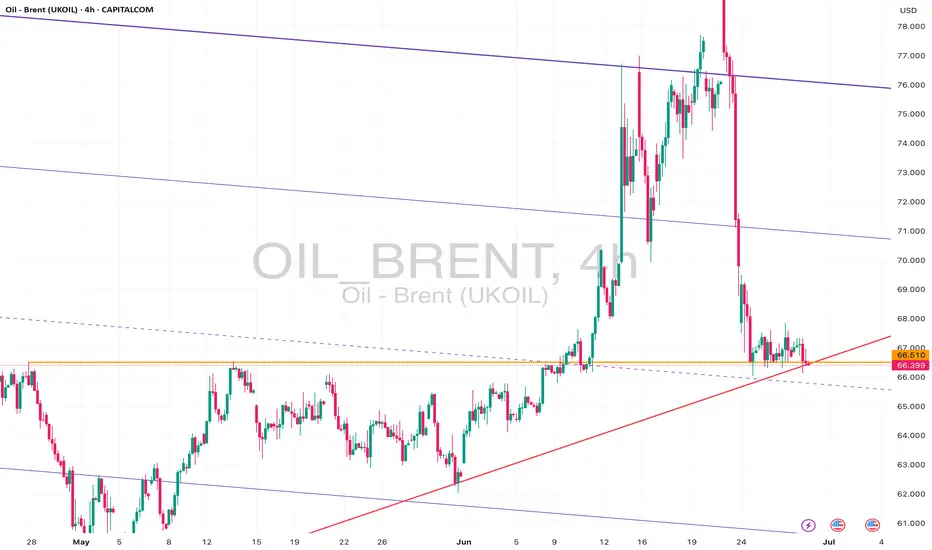
Brent Oil – Bearish Break or Bounce from Long-Term Support?Brent Oil is hovering just above critical support near 66.00, with a clear bearish structure visible across timeframes:
🔎 15m & 1h:
Price action is consolidating near the ascending support trendline drawn from early June lows. Short-term price structure shows lower highs and lower lows, suggesting continued downside pressure.
📉 4h & 1D:
The recent sell-off from above 78.00 has pushed Brent back into the lower region of the broad descending channel. Daily and 4h charts show price testing confluence between the horizontal support at ~66.00 and a long-term rising trendline. A confirmed close below this level could accelerate bearish momentum towards 64.00 or even 62.00.
⚠️ Key Levels:
• Support: 66.00, 64.00, 62.00
• Resistance: 67.00, 69.00
• Bias: Bearish – price remains in a clear downtrend unless buyers reclaim above 67.50 with strong volume.
📌 Outlook:
As long as Brent holds below 67.00 and the descending trendline caps rallies, my bias is bearish. A breakdown of 66.00 on higher timeframes would open the door for a move towards lower channel support levels. However, if buyers defend and push back above 67.50, we could see a short-term relief rally.
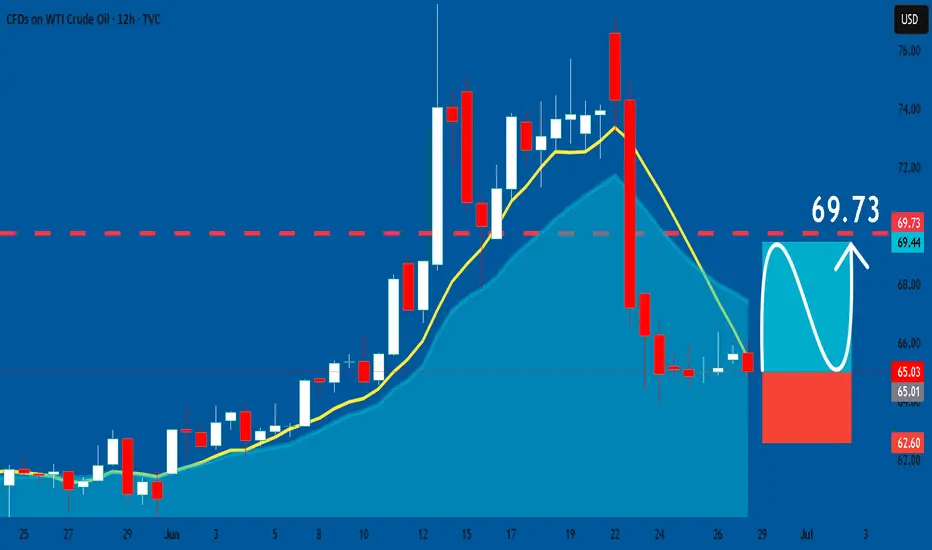
USOIL: Long Trading Opportunity
USOIL
- Classic bullish pattern
- Our team expects retracement
SUGGESTED TRADE:
Swing Trade
Buy USOIL
Entry - 65.03
Stop - 62.60
Take - 69.73
Our Risk - 1%
Start protection of your profits from lower levels
Disclosure: I am part of Trade Nation's Influencer program and receive a monthly fee for using their TradingView charts in my analysis.
❤️ Please, support our work with like & comment! ❤️
BRIEFING Week #26 : Are we going for a Bubble ?Here's your weekly update ! Brought to you each weekend with years of track-record history..
Don't forget to hit the like/follow button if you feel like this post deserves it ;)
That's the best way to support me and help pushing this content to other users.
Kindly,
Phil

USOIL: Next Move Is Up! Long!
My dear friends,
Today we will analyse USOIL together☺️
The recent price action suggests a shift in mid-term momentum. A break above the current local range around 65.100 will confirm the new direction upwards with the target being the next key level of 65.468 and a reconvened placement of a stop-loss beyond the range.
❤️Sending you lots of Love and Hugs❤️
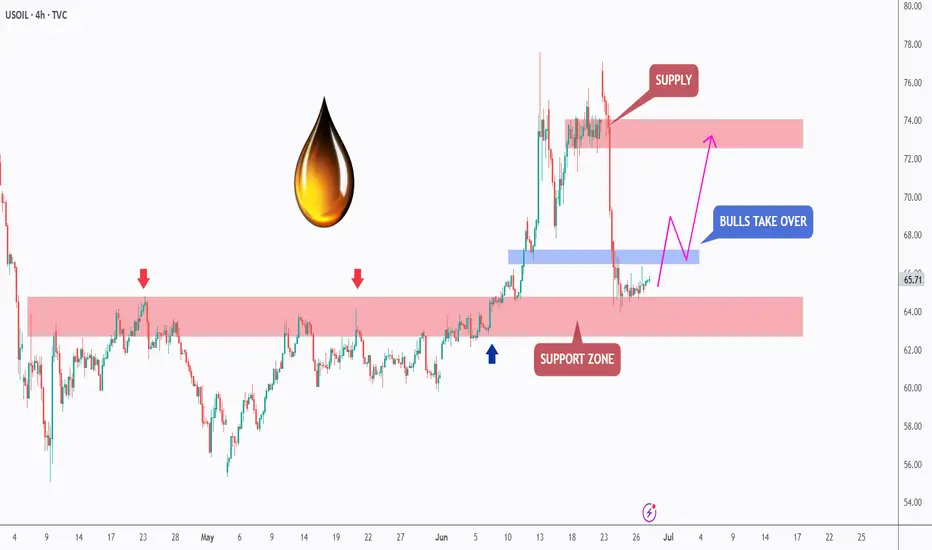
Cautious — this Chart is Slippery!Hello TradingView Family / Fellow Traders. This is Richard, also known as theSignalyst.
🛢️After surging by over 35% in the past two weeks, USOIL took a hit following Trump's announcement of a ceasefire between Iran and Israel.
However, from a technical perspective, USOIL is approaching a strong daily support zone marked in red.
As long as this support holds, the bulls remain in control.
📊The next bullish impulse will be confirmed upon a break above the last minor high marked in blue.
In such a scenario, a move toward the supply zone (also marked in red) would be expected.
📚 Always follow your trading plan regarding entry, risk management, and trade management.
Good luck!
All Strategies Are Good; If Managed Properly!
~Rich
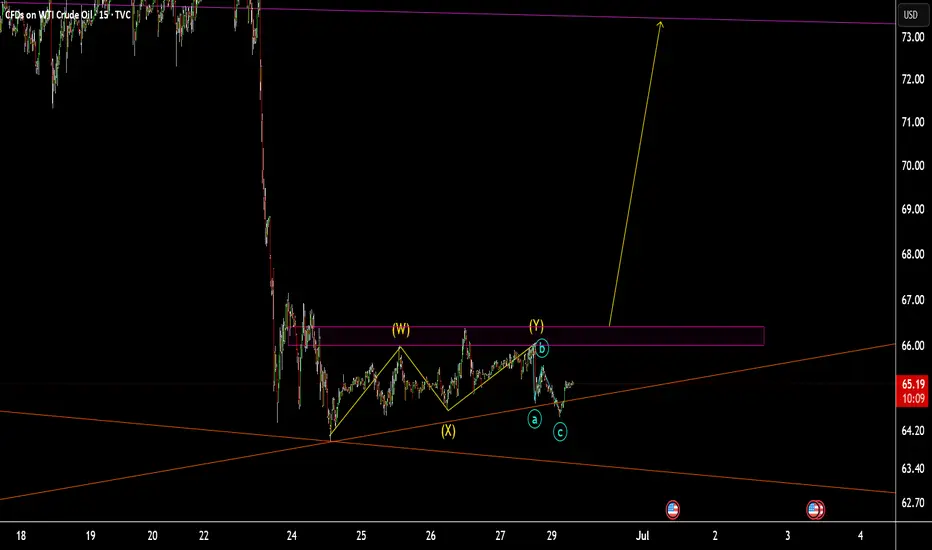
The idea of oscillating crude oil
💡Message Strategy
Asia's crude oil imports hit a record high in recent years
In the first half of 2025, Asia's crude oil imports showed a significant increase. The average daily import volume in Asia reached 27.36 million barrels, an increase of 620,000 barrels from 26.74 million barrels in the same period last year, an increase of about 2.3%. The highlight of this growth was concentrated in June, when Asia's crude oil arrivals soared to 28.65 million barrels/day, setting a record high since January 2023, far exceeding 27.3 million barrels/day in May and 26.42 million barrels/day in June last year.
Import boom driven by price
What drove the surge in Asian crude oil imports in June? The answer has a lot to do with price. China and India are known to be extremely sensitive to crude oil price fluctuations, usually increasing imports when prices are low and choosing to shrink when prices are high. Crude oil arriving in June is usually scheduled six to eight weeks in advance of delivery, which means that these cargoes were purchased when oil prices were low in April and May.
Geopolitics and market uncertainty
The sharp fluctuations in oil prices in June are inseparable from the fueling of geopolitics. Israel's military action against Iran and the subsequent intervention of the United States once pushed crude oil prices to a five-month high. After Trump announced the ceasefire agreement, the market risk premium quickly subsided, but geopolitical uncertainty is still an important variable affecting oil prices. In the future, any new geopolitical events may push up oil prices again, which will further pressure Asia's import demand.
📊Technical aspects
The short-term trend of crude oil (1H) continues to fluctuate in a narrow range, with a small fluctuation. The oil price repeatedly crosses the moving average system, and the short-term objective trend direction fluctuates. The momentum is stalemate between long and short positions, and it is expected that the trend of crude oil will maintain a fluctuating consolidation pattern during the day.
However, crude oil is never that simple. It is greatly affected by international trends. At present, crude oil is still waiting for direction. So how can we obtain greater future returns in a volatile market?
The answer is simple. At this time, what we need to do is to use a small stop loss to leverage large returns within the pressure and support range.
💰Strategy Package
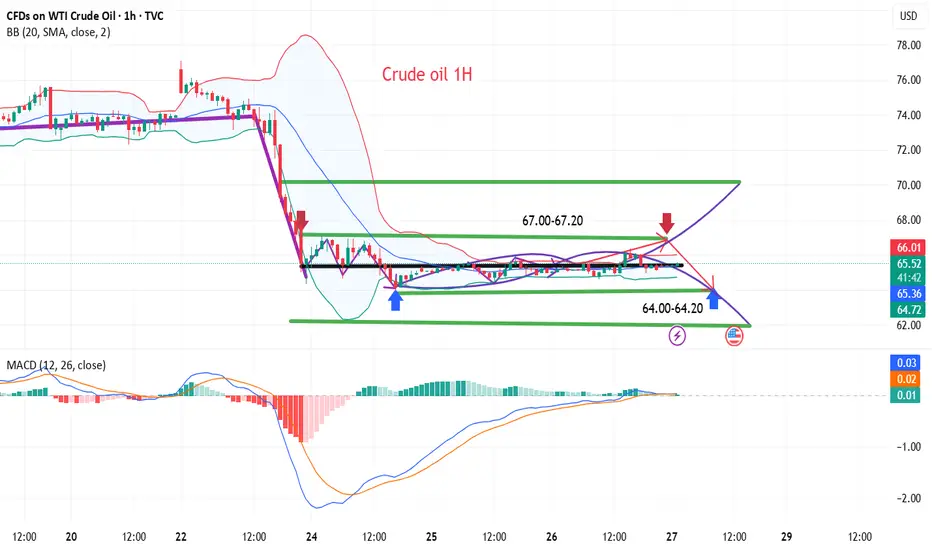
Short Position:67.00-67.20,SL:67.80,Target: 64.50-63.50/60.00
Long Position:64.00-64.20,SL:63.50,Target: 65.50-66.50/70.00
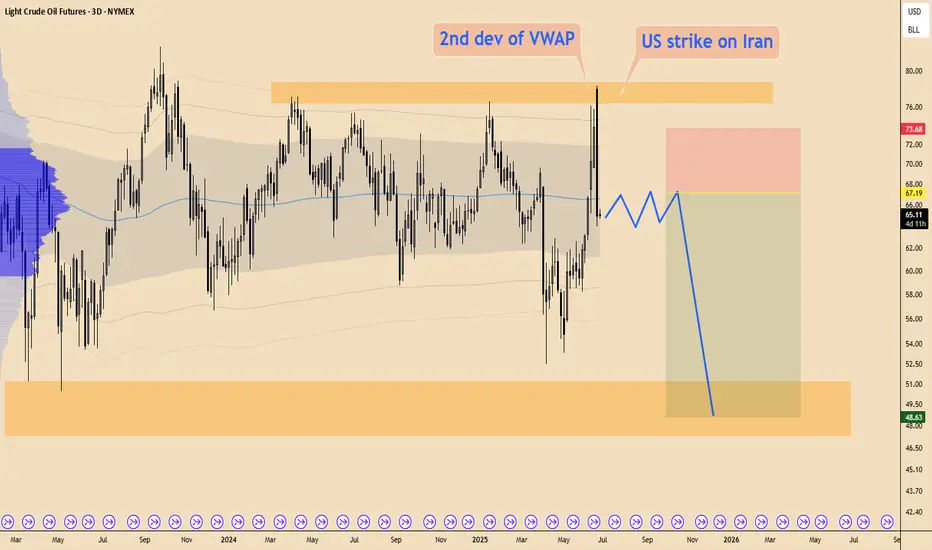
OIL - is going to hit $50I expect the drop in OIl will go on
During such big news as potential WW3 price bararly rose
Also on bigger time frame price only reached 2nd vwap deviation
that's why after some consolidation price will go down toward range LOW
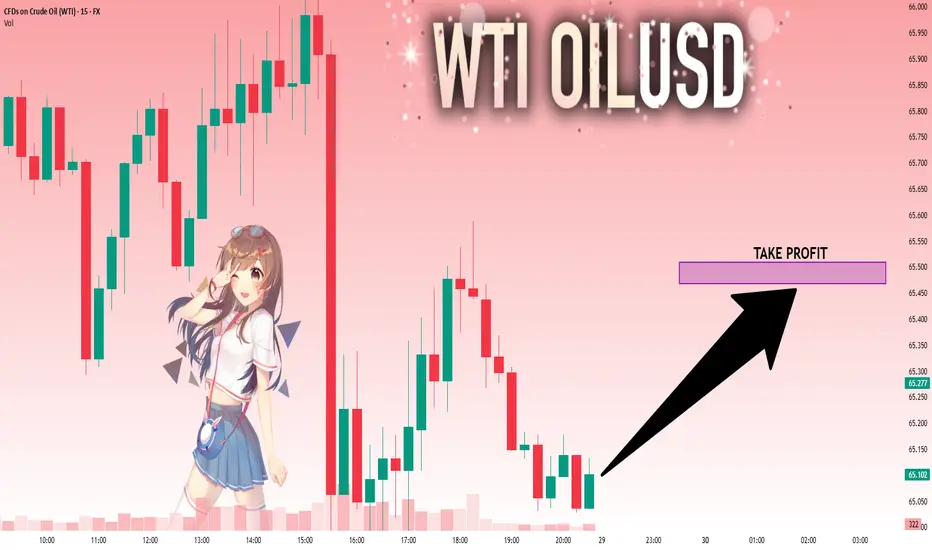
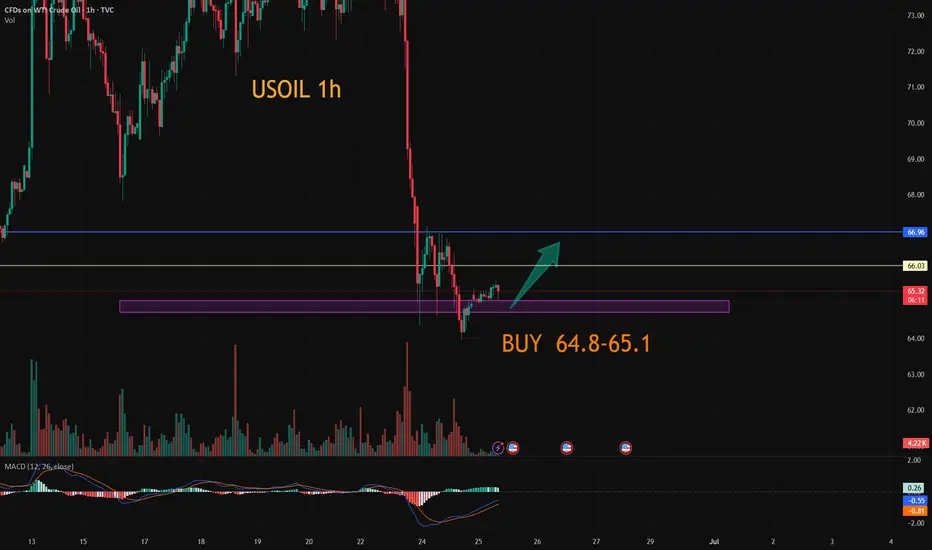
USOIL:Go long
usoil: Let's start with a short-term rebound.
Trading idea:
BUY@64.8-65.2
TP: 66-66.4
More detailed strategies and trading will be notified here ↗↗↗
Keep updated, come to "get" ↗↗↗
LONG ON OILUSOIL is consolidating at a major demand area.
We have a small choc (change of character) from down to up on the lower timeframe.
I will be buying oil to the next supply level looking to catch 500-1000 pips.
USOIL: Bullish Correction Ahead! Buy!
USOIL
- Classic bullish correction formation
- Our team expects growth
SUGGESTED TRADE:
Swing Trade
Buy USOIL
Entry Level - 65.16
Sl - 62.68
Tp - 68.86
Our Risk - 1%
Start protection of your profits from lower levels
Disclosure: I am part of Trade Nation's Influencer program and receive a monthly fee for using their TradingView charts in my analysis.
❤️ Please, support our work with like & comment! ❤️
Crude oil fluctuates in a narrow range, waiting for direction
💡Message Strategy
Middle East ceasefire eases supply concerns, but risk premium remains
Oil prices rose more than 1% on the day as investors weighed the status of the ceasefire between Iran and Israel. Although both sides have announced an end to hostilities, US intelligence reports show that Iran's nuclear capabilities have only been temporarily damaged. ING analysts pointed out that although immediate concerns about supply disruptions have subsided, potential risks remain, a factor that may support spot prices in the short term.
Previously, crude oil prices soared after the US military action on Iranian infrastructure, but prices have retreated as the ceasefire continues. Although the geopolitical premium has been reduced, it has not been fully digested.
API shows a sharp drop in inventories, traders await EIA report
Industry data from the American Petroleum Institute (API) showed that US crude oil inventories fell sharply by 4.23 million barrels in the week ending June 20, far higher than the expected drop of 800,000 barrels. Gasoline and distillate inventories increased by 400,000 barrels each.
Market focus now turns to the US Energy Information Administration (EIA) report scheduled for release on Wednesday. Traders were expecting a 1.2 million-barrel draw in inventories, and confirmation of that figure by the EIA, widely viewed as an industry benchmark, would reinforce expectations of tighter supply.
📊Technical aspects
From the daily chart level, crude oil fluctuates upward in the medium term and tests around 67. The K-line closes with a large real negative line, which has not yet destroyed the moving average system and is still supported. The medium-term objective upward trend remains unchanged.
However, from the perspective of momentum, the MACD indicator crosses downward above the zero axis, indicating that the bullish momentum is weakening. It is expected that the medium-term trend of crude oil will fall into a high-level oscillation pattern.
The short-term trend of crude oil (1H) is in a narrow range of consolidation, with a small fluctuation. The oil price repeatedly crosses the moving average system, and the short-term objective trend direction fluctuates. In terms of momentum, the MACD indicator fast and slow lines slowly rise below the zero axis, and the long and short positions are in a stalemate, with no obvious advantage on one side. It is expected that the trend of crude oil will maintain a consolidation pattern during the day.
💰Strategy Package
Short Position:67.00-67.20,SL:67.80,Target: 65.50-64.50
Long Position:64.00-64.20,SL:63.50,Target: 65.50-66.50
Here is the latest analysis of the crude oil market trendOn Wednesday, international oil prices stabilized and rebounded after two consecutive days of correction, as the market reassessed the short-term easing of the Middle East situation and changes in crude oil supply. Brent crude oil futures rose by $0.75, or 1.1%, to $67.89 per barrel; WTI crude oil rose by $0.71 to $65.08. Previously, U.S. air strikes damaged key Iranian facilities. Although they did not completely destroy its capabilities, they triggered short-term market concerns about supply chain disruptions.
When geopolitical tensions temporarily eased, the market also turned its attention to inventory data. The latest data from the American Petroleum Institute (API) showed that for the week ending June 20, U.S. crude oil inventories fell by 4.23 million barrels, far exceeding the market expectation of a 2.5 million barrel decline, indicating that refinery demand remained strong. Under the dual effect of the mitigation of geopolitical risks and the bullish API inventory data, oil prices showed signs of stabilization, but the foundation for the rise was still fragile.
In the next few trading days, the safety of the Strait of Hormuz and the EIA official inventory report will become the key to whether the bulls can continue. In the current volatile pattern, it is necessary to remain cautious and pay close attention to changes in the technical support area and U.S. policy dynamics.
However, in terms of momentum, the MACD indicator has formed a bearish crossover below the zero axis, signaling a weakening of bullish momentum. This suggests that the medium-term trend of crude oil is likely to fall into a high-level consolidation pattern.
you are currently struggling with losses,or are unsure which of the numerous trading strategies to follow,You have the option to join our VIP program. I will assist you and provide you with accurate trading signals, enabling you to navigate the financial markets with greater confidence and potentially achieve optimal trading results.
Trading Strategy:
sell@67.0-68.0
TP:63.0-64.0
WTI looks to end bearish run after bullish inventories dataWe have had some more bullish oil news from the weekly US inventories report. It remains to be seen whether the news is enough to lift the oil price.
Following the API data overnight we had even more bullish-looking official inventories report from the US Department of Energy.
The fact that crude stocks fell for the 5th straight week certainly points to strong demand, pushing stockpiles to their lowest levels since January.
As well as the big headline draw, stocks of crude products fell sharply too. The 2 million barrel draw in gasoline inventories was much higher than the API report, and suggests the driving season is well and truly at full steam, when demand for gasoline tends to rise.
In case you missed it, the DoE reported the following numbers:
• Crude -5.84mm
• Cushing -464k
• Gasoline -2.08mm
• Distillates -4.07mm
Whether or not oil can now stage a meaningful rebound remains to be seen. It has certainly lost its entire risk premium associated with the Iran-Israel conflict. Perhaps it is up to the OPEC+ now to decide with the alliance due to hold discussions on July 6 to consider a further supply boost in August. Any hints of a slower supply boost could provide support to prices.
By Fawad Razaqzada, market analyst with FOREX.com
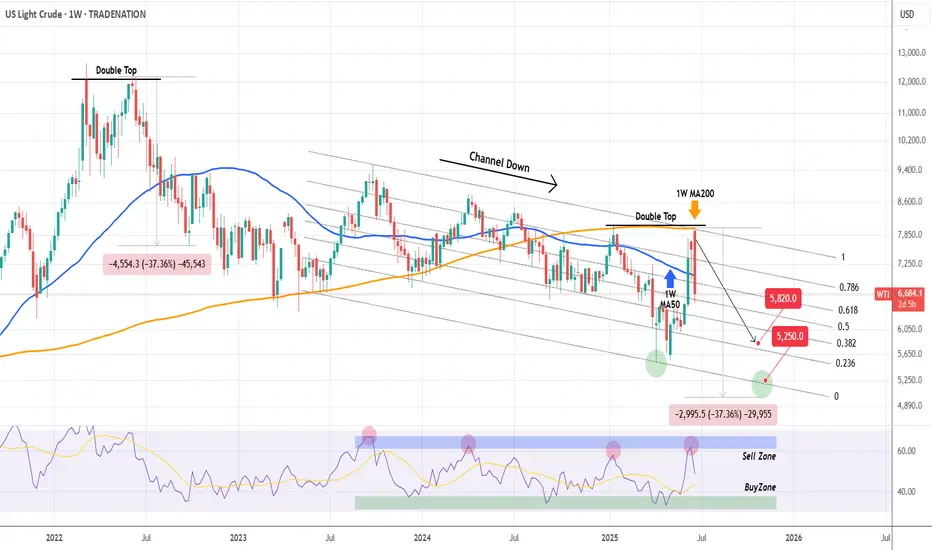
WTI OIL Progressively bearish on the long-term. Eyes $52.50.A week has passed since our sell signal on WTI Oil (USOIL) and the emerging geopolitical stability has already helped the price move much faster towards our $58.20 Target (see chart in related ideas below).
If we look at it from an even longer term perspective, the 1W time-frame in particular, we can see draw some very useful conclusions about the bearish case. First of all that this week's High got rejected exactly on the 1W MA200 (orange trend-line), which is the trend-line that made the last 3 major rejections on the market (January 13 2025, October 07 2024).
As you can see, that was a textbook Double Top formation. The last Double Top rejection took place on June 06 2022, the previous multi-year Top for the market. The result was a continued sell-off that didn't stop before testing the 1W MA200, which is now the Resistance.
As a result, even though our $58.20 Target stands, on the longer term we can even see a -37.36% decline towards the end of the year. Contact with the bottom of the Channel Down can be made at $52.50.
Alternatively, you can look at the 1W RSI, which has a clear Sell and clear Buy Zone. This week it was rejected on the Sell Zone, so you may look to book your profit as soon as it enters the Buy Zone.
-------------------------------------------------------------------------------
** Please LIKE 👍, FOLLOW ✅, SHARE 🙌 and COMMENT ✍ if you enjoy this idea! Also share your ideas and charts in the comments section below! This is best way to keep it relevant, support us, keep the content here free and allow the idea to reach as many people as possible. **
-------------------------------------------------------------------------------
Disclosure: I am part of Trade Nation's Influencer program and receive a monthly fee for using their TradingView charts in my analysis.
💸💸💸💸💸💸
👇 👇 👇 👇 👇 👇
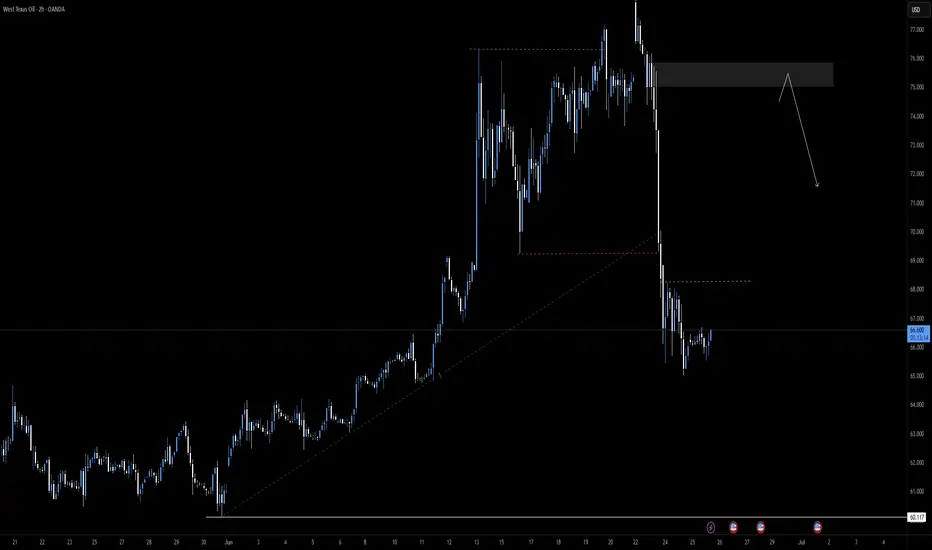
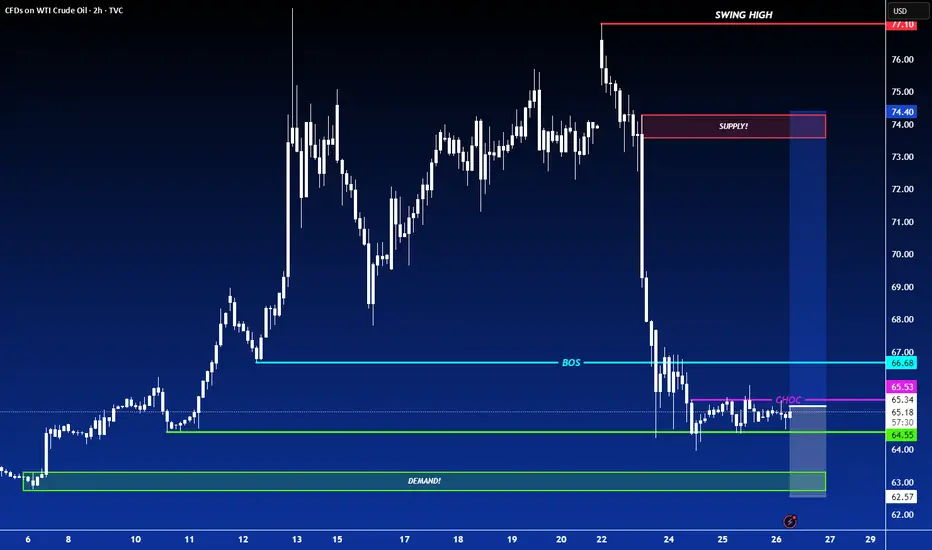
SELL BIAS ON USOIL (WTI)With price accumulating liquidity, we've finally gotten a shift in price structure from buyers to sellers. I will be expecting price to take out inducement before validating supply at the order block zone for a massive selloff.