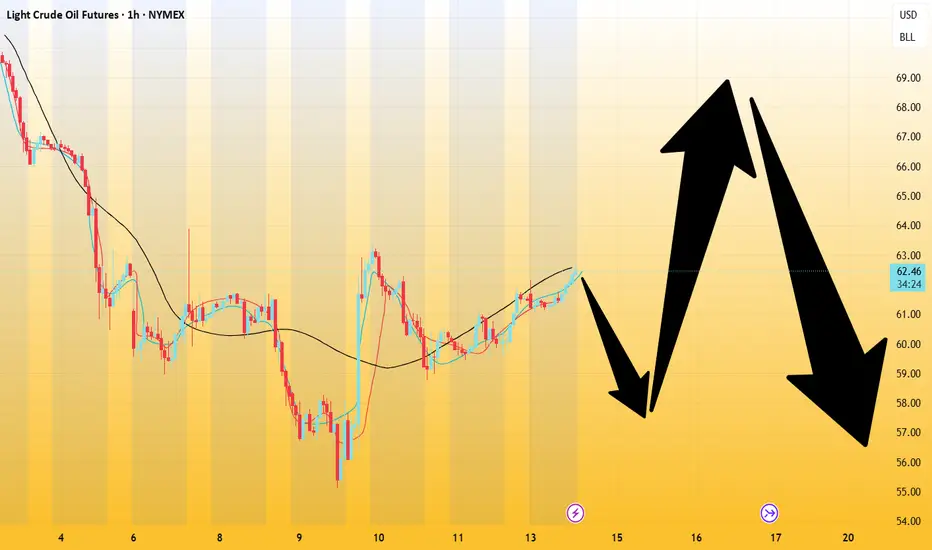
Crude oil---sell near 64.00, target 62.00-60.00Crude oil market analysis:
Crude oil has been falling recently. Under the pressure of tariffs, the decline of crude oil is very large. In addition, the previously released crude oil inventory data also shows its weakness. The weekly line closed with a cross star, and the lower shadow is very long. The possibility of a unilateral decline in crude oil this week is small, and the possibility of fluctuations is greater. The position of 65.30 is its suppression. Look for selling opportunities in the Asian session of 63.50-65.30 today. The other 58.00 of crude oil is support.
Operational suggestions:
Crude oil---sell near 64.00, target 62.00-60.00
Oilforecast
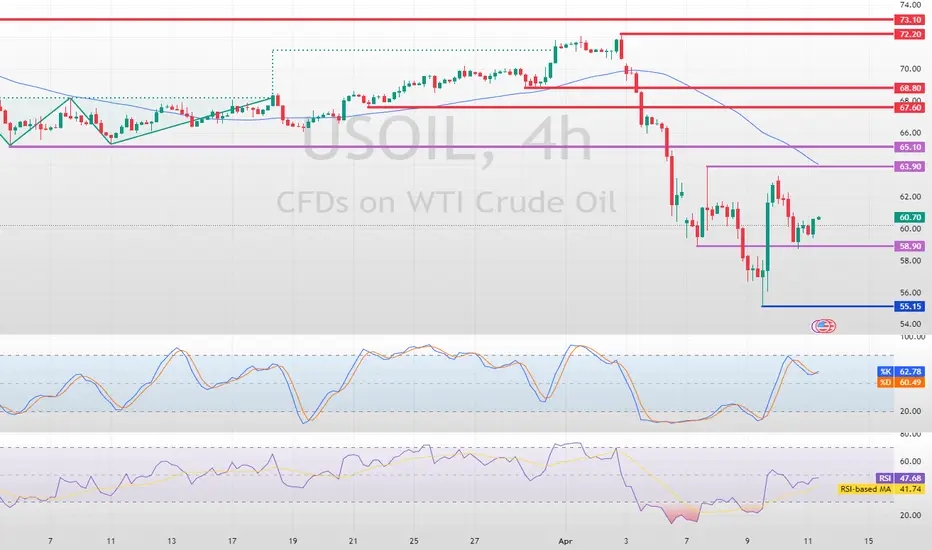
Crude Oil Found Support: What's Next?FenzoFx—Crude oil tested the $58.9 level as support and bounced back from it. The primary trend is bearish; therefore, it will likely resume if the price closes and stabilizes below this support.
If this scenario unfolds, the next bearish target could be the $55.15 support level.
>>> Win $160.0 prize every week by joining FenzoFx contest.
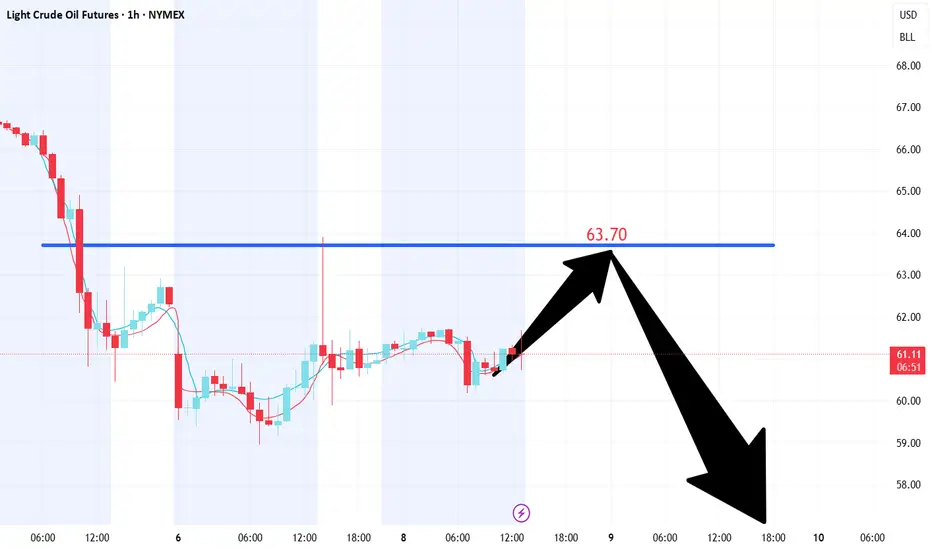
Crude oil-----sell near 63.70, target 62.00-60.00Crude oil market analysis:
We continue to be bearish on crude oil today, and continue to sell on rebounds. The position of 63.80, which was pulled up last night, is today's major suppression position. This position is a selling opportunity. Crude oil has not broken the previous low point, but it will have a big bottom shock and a big repair after the data is over. Today's crude oil will wait for the opportunity to sell. In addition, the recent data on crude oil also suppresses it. Crude oil has not effectively stood on the major pressure before, and the short-term rebound is just a rebound. The weekly trend is still bearish.
Fundamental analysis:
The US tariffs on the world are still brewing, which has also led to a sharp drop in global stock markets, and the market is not optimistic about expectations. Later this week, we will focus on the heavyweight CPI data.
Operation suggestions:
Crude oil-----sell near 63.70, target 62.00-60.00
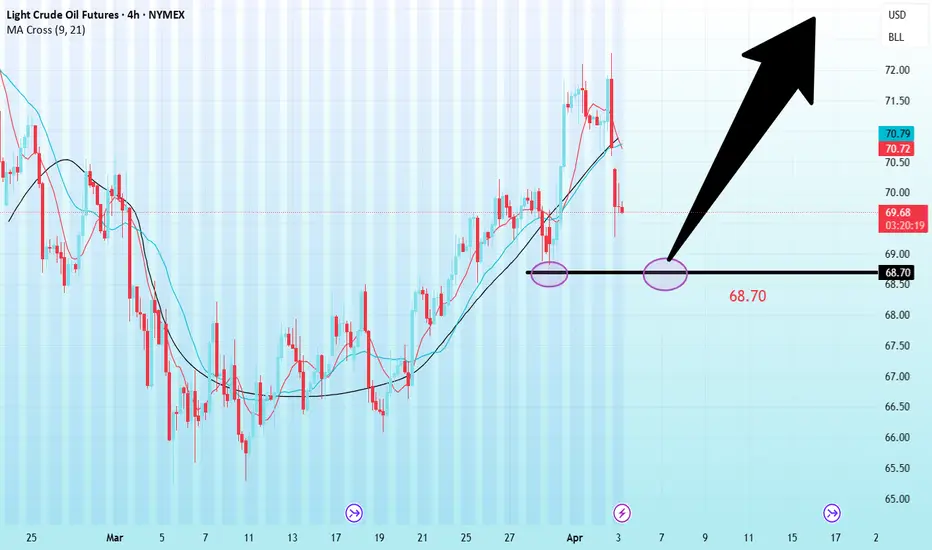
Crude oil-----buy near 68.90, target 69.90-72.00Crude oil market analysis:
Yesterday's crude oil daily line showed continuous tombstones, which was suppressed near 72.00. Today's idea is to continue to look at the rebound in the short term and pay attention to the support near 68.70. This position is a buy rebound. We will wait for opportunities in the Asian session. Crude oil has begun to move on a weekly trend. We need to pay attention to this week's closing to determine whether it will start a weekly trend in the future.
Fundamental analysis:
Trump's midnight tariffs caused the market to tremble again. In addition, ADP rose sharply, with a result of 155,000 people, 80,000 people in advance, and 115,000 people expected. The bulls still pulled up under such a big negative situation.
Operation suggestions:
Crude oil-----buy near 68.90, target 69.90-72.00
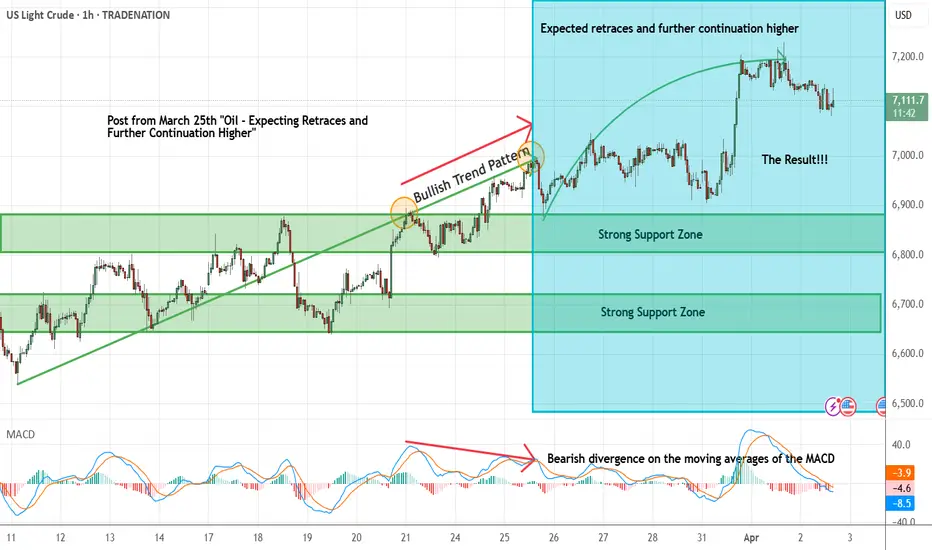
Oil - Short Term Buy Idea Update!!!Hi Traders, on March 25th I shared this "Oil - Expecting Retraces and Further Continuation Higher"
I expected to see retraces and further continuation higher. You can read the full post using the link above.
The bullish move delivered as expected!!!
If you enjoy this idea, don’t forget to LIKE 👍, FOLLOW ✅, SHARE 🙌, and COMMENT ✍! Drop your thoughts and charts below to keep the discussion going. Your support helps keep this content free and reach more people! 🚀
-------------------------------------------------------------------------------------------------------------------
Disclosure: I am part of Trade Nation's Influencer program and receive a monthly fee for using their TradingView charts in my analysis.
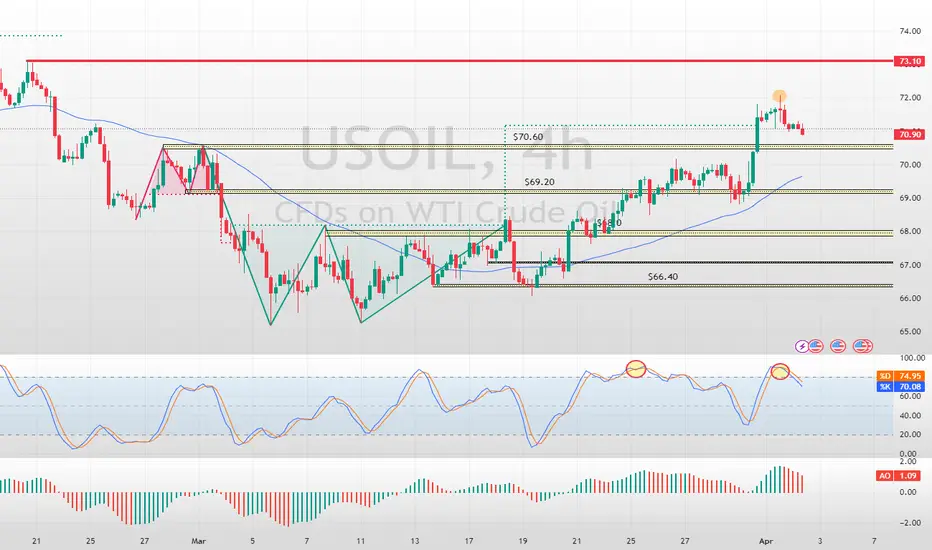
Crude Oil Technical AnalysisFenzoFx—Crude Oil trades are bullish, stabilizing above $70.60. Stochastic signals overbought. A correction toward the 50-SMA is likely before the uptrend resumes.
Trade Crude Oil without Swap Charges at FenzoFx.
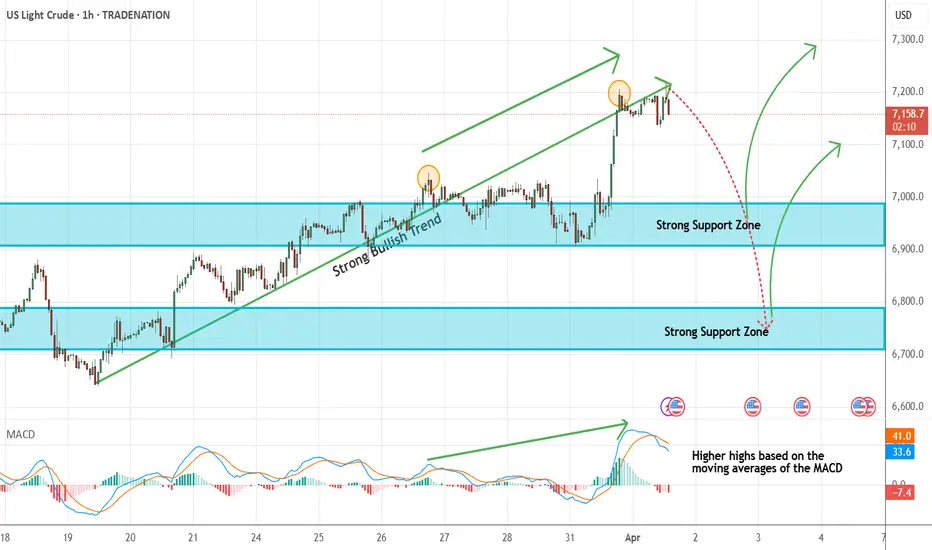
Oil - Expecting The Price To Bounce Higher FurtherH1 - Price has created series of higher highs, higher lows structure
Strong bullish momentum
Higher highs based on the moving averages of the MACD indicator
Expecting retraces and further continuation higher until the two strong support zones hold.
If you enjoy this idea, don’t forget to LIKE 👍, FOLLOW ✅, SHARE 🙌, and COMMENT ✍! Drop your thoughts and charts below to keep the discussion going. Your support helps keep this content free and reach more people! 🚀
--------------------------------------------------------------------------------------------------------------------
Disclosure: I am part of Trade Nation's Influencer program and receive a monthly fee for using their TradingView charts in my analysis.
Crude oil-----buy around 69.00, target 69.90-70.90Crude oil market analysis:
Crude oil has not been so strong for a long time. The K-line has uploaded the daily moving average, and the bulls have begun to rush up. The current suppression position is 70.00-70.60. Yesterday, the highest peak was 70.22. Today's idea is to follow the short-term buying, buy at a low price to see its moving average rebound, and the daily moving average is also starting to attack. We don’t speculate whether this wave of upward rush will change the trend of the daily line, but we can be sure that the short-term is bullish. Today’s idea is to buy directly around 69.00.
Fundamental analysis:
Although there is no big data this week, the US tariffs still cause huge market fluctuations in terms of fundamentals.
Operation suggestions:
Crude oil-----buy around 69.00, target 69.90-70.90
USOil Sell 70.000Crude oil has been fluctuating and rising recently, reaching a three-week high. From a fundamental perspective:
Supply: The United States has intensified its energy sanctions against Iran. Attacks on Saudi facilities have affected their performance. The OPEC+ will gradually lift the voluntary production cuts starting from April and may increase production for the second time in May. The 30-day ceasefire agreement between Russia and Ukraine has not been effectively implemented in substance. However, recently, the United States, Russia, and Ukraine have reached some consensus on Black Sea navigation and the protection of energy facilities.
Inventory: According to API data, for the week ending March 25, U.S. crude oil inventories dropped significantly by nearly 9 million barrels. However, commercial crude oil inventories have been increasing continuously for several weeks, and the overall inventory remains at a high level.
Geopolitics: The U.S. airstrikes against the Houthi armed group in Yemen and Israel's military operations in the Gaza Strip have heightened concerns about the disruption of crude oil supplies in the Middle East. The United States' continuous strengthening of sanctions against Iran and Venezuela also includes a plan to impose a 25% tariff on countries importing Venezuelan crude oil.
Production Increase Pressure: The daily supply increments of non-OPEC countries (such as the United States and Brazil) far exceed the global demand growth rate, which has long-term downward pressure on the oil price center.
💎💎💎 USOIL 💎💎💎
🎁 Sell@70.000 - 70.200
🎁 TP 68.5 68.0 67.5
The market has been extremely volatile lately. If you can't figure out the market's direction, you'll only be a cash dispenser for others. If you also want to succeed,Follow the link below to get my daily strategy updates

CFD on WTI CRUDEOIL (US OIL)ITS A T4HR TRADE FOR USOIL
1. Got Activated.
2. Stop loss @ 69.65 and resp. Target 1 @ 69.65 and Target 2 @ 67.59
3. Its a swing trade for 1 week trade working days duration.
4. Kindly make your orders accordingly to the duration period mentioned.
God bless. Happy trading Days

Oil - Expecting Retraces and Further Continuation HigherH1 - Bullish trend pattern in the form of higher highs, higher lows structure
Strong bullish momentum
Bearish divergence on the moving averages of the MACD indicator.
Expecting retraces and further continuation higher until the two strong support zones hold.
If you enjoy this idea, don’t forget to LIKE 👍, FOLLOW ✅, SHARE 🙌, and COMMENT ✍! Drop your thoughts and charts below to keep the discussion going. Your support helps keep this content free and reach more people! 🚀
--------------------------------------------------------------------------------------------------------------------
Disclosure: I am part of Trade Nation's Influencer program and receive a monthly fee for using their TradingView charts in my analysis.

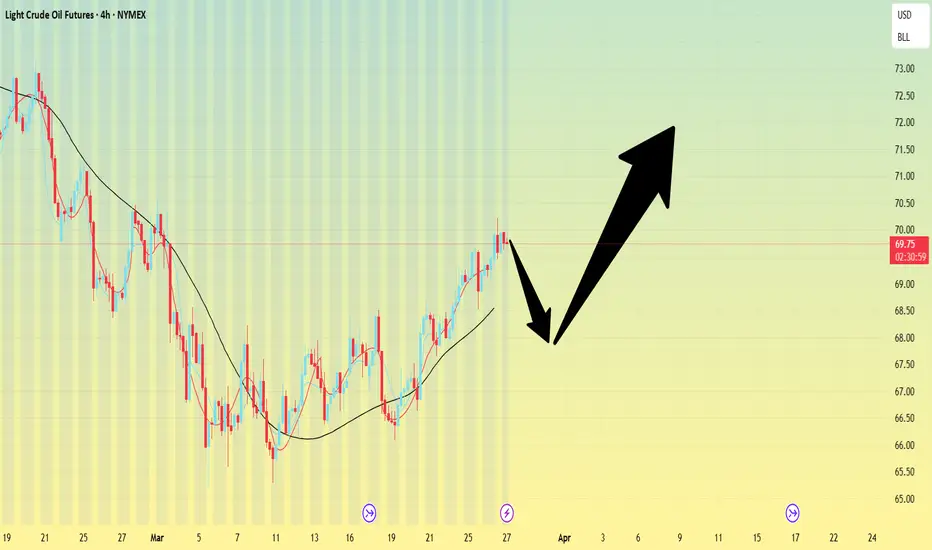
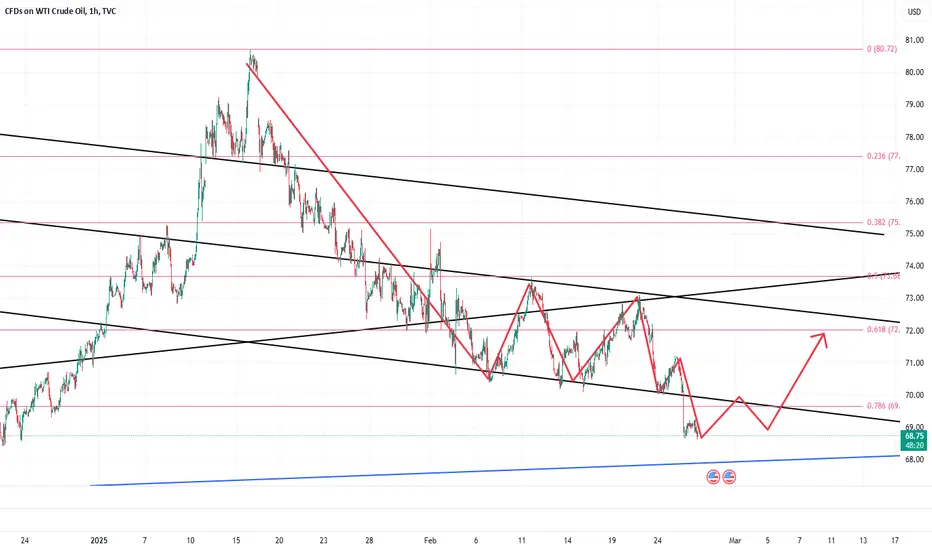
Technical Analysis for WTI Crude Oil (Daily Chart)Current Price Action
WTI crude oil is trading at $70.51, showing a recovery from the Liquidity Pool zone near the $66.00–$67.00 range. The price has approached a key resistance level around $71.00, which aligns with a previous area of rejection in February 2025. The chart suggests a potential pullback from this resistance level, as indicated by the projected downward arrow.
Support Levels:
$66.00–$67.00: This zone represents a significant liquidity pool where buyers have consistently stepped in, leading to a reversal in price.
$65.00: A psychological support level and the lower boundary of the liquidity pool.
Resistance Levels:
$71.00: A critical resistance level that has acted as a ceiling for price action in recent months.
$73.00: The next major resistance level if the price breaks above $71.00.
Volume Profile Analysis
The Volume Profile on the right side of the chart shows significant trading activity between $70.00 and $71.00, indicating strong resistance in this area. Above $71.00, the volume thins out, suggesting that a breakout could lead to a rapid move toward $73.00.
Indicators and Momentum
Trend: The price is recovering from a bearish trend but remains below the highs of $80.00 seen earlier in the chart. The current move appears to be a retracement within a broader downtrend.
Potential Pullback: The projected arrow on the chart suggests a possible rejection at $71.00, with a pullback toward the $68.00–$69.00 range.
Market Sentiment
The chart reflects cautious optimism, with buyers stepping in at lower levels but facing strong resistance at $71.00. A breakout above this level could signal a shift in sentiment, while a rejection would confirm the continuation of the bearish trend.
Conclusion
WTI crude oil is at a critical juncture, testing the $71.00 resistance level. Traders should watch for a breakout above $71.00, which could target $73.00 and higher. Conversely, a rejection at this level may lead to a pullback toward the $68.00–$67.00 support zone. The liquidity pool near $66.00 remains a key area for buyers to defend in the event of further downside.

OIL Today's strategyIn the medium term, because the lower edge of the channel has been broken, the short force is relatively dominant, and crude oil may face certain downward pressure.
However, today's crude oil prices are affected by tightening expectations on the supply side, geopolitics and other factors, and the short-term trend is strong, and there is a certain upward momentum on the technical side. Investors need to pay close attention to the breakout of key support and resistance levels.
OIL Today's strategy
buy@67.5-68
tp:69-69.5
We share various trading signals every day with over 90% accuracy
Fans who follow us can get high rewards every day
If you want stable income, you can contact me

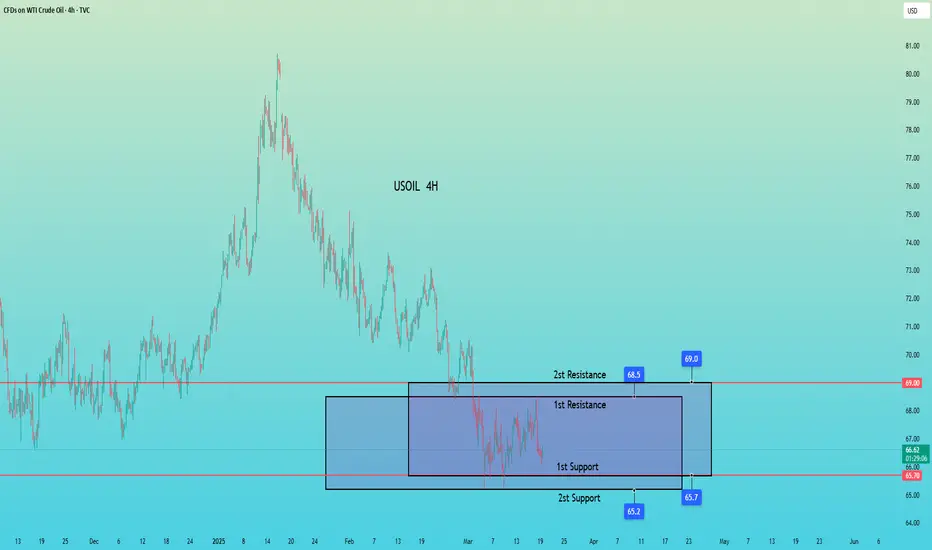
OIL Today's strategyIn the short term, there is a simultaneous advance of the long positions in crude oil. The price has tested the vicinity of $68.5 several times but encountered resistance. Moreover, after reaching around $65.2 at the lower level, it rebounded rapidly. The market still needs further testing. In the short term, it is advisable to sell high and buy low within the range of $68.5 to $65.2.
OIL Today's strategy
sell@67.5-67.9
buy:65.7-66.2
If you don't know how to do it, you can refer to my transaction.
BRENT SELL/SHORTBy utilizing Fibonacci retracement levels, historical patterns, , we can formulate a hypothesis that the market might follow a similar trajectory if bearish sentiment prevails.
Crude Oil Prices: Double-Edged Sword for Indian Marketers
The global crude oil market, a volatile beast, dictates the energy landscape for nations worldwide.1 For India, a nation heavily reliant on oil imports, the fluctuations in crude oil prices carry significant implications.2 While a dip in crude oil prices might seem like a welcome relief, especially for consumers, it presents a complex and often challenging scenario for oil marketing companies (OMCs) operating within the Indian market. This seemingly beneficial drop in prices acts as a double-edged sword, bringing with it a unique set of complexities that stem from market dynamics, government policies, and the intrinsic characteristics of the oil and gas sector.3
The initial and seemingly positive impact of lower crude oil prices is the potential for reduced import costs.4 For a country like India, where a substantial portion of its energy needs are met through imports, this can lead to a decrease in the overall expenditure on crude oil. This reduction can, in turn, alleviate pressure on the nation's current account deficit and theoretically translate to lower fuel prices for consumers. However, this potential benefit is often overshadowed by the ever-present threat of government intervention through excise duty hikes.
Governments, seeking to bolster their revenue, often capitalize on falling crude oil prices by increasing excise duties on petrol and diesel.5 This strategic move allows them to capture a significant portion of the savings that would otherwise be passed on to consumers. For OMCs, this translates to a reduction in the potential for increased margins. While they still benefit from reduced raw material expenses, the extent of the gain is substantially diminished. This delicate dance between market forces and government policies creates a complex environment for OMCs to navigate.
Furthermore, the expectation of price cuts for end consumers becomes a significant challenge for OMCs. Consumers naturally anticipate a corresponding reduction in fuel prices when crude oil prices decline. However, OMCs must carefully balance this expectation with the need to maintain their financial health. Rapid and substantial price cuts can strain their profitability, especially when coupled with excise duty adjustments. This balancing act requires a delicate approach, as OMCs must ensure their financial stability while remaining responsive to consumer demands.
Beyond the immediate impact on OMCs, lower crude oil prices pose a significant challenge to the upstream oil and gas sector. Upstream companies, involved in exploration and production, are directly affected by the decline in realized prices for their crude oil. This can lead to reduced profitability, delayed or cancelled investment projects, and even financial distress for some companies. The economic viability of many oil and gas fields is contingent on a certain price threshold. When prices fall below this level, production becomes less attractive, potentially hindering future energy security.
The impact on the gas sector is particularly noteworthy. Natural gas economics are often intertwined with crude oil prices, with gas prices sometimes linked to oil price benchmarks.6 A decline in crude oil prices can thus indirectly affect gas prices, making gas production and distribution less profitable. This can have broader implications for the energy sector, as natural gas is increasingly seen as a cleaner alternative to other fossil fuels.7 Reduced investment in gas infrastructure and production can hinder the transition towards a more sustainable energy mix.
Moreover, the volatility associated with fluctuating crude oil prices creates uncertainty for OMCs and the entire energy sector.8 Long-term planning and investment decisions become more difficult when the market is subject to rapid and unpredictable price swings. This uncertainty can deter investment in new projects and hinder the development of a stable and reliable energy supply. This volatility necessitates a robust and adaptable strategy for OMCs to navigate the unpredictable market.
From a macroeconomic perspective, while lower crude prices can potentially stimulate economic activity by reducing fuel costs for businesses and consumers, the potential for reduced government revenue due to lower oil prices (if excise duties are not increased) must be considered. In a country like India, where government revenue is crucial for funding infrastructure projects and social programs, a significant decline in oil-related revenue can have far-reaching consequences. This highlights the need for a balanced approach to fiscal policy, ensuring that government revenue remains stable while providing relief to consumers.
The challenges posed by lower crude oil prices highlight the need for a balanced and nuanced approach to energy policy. Governments must strike a delicate balance between providing relief to consumers, maintaining fiscal stability, and supporting the long-term health of the oil and gas sector. This requires careful consideration of excise duty adjustments, pricing mechanisms, and investment incentives. A coherent and forward-looking energy policy is essential to navigate the complexities of the global crude oil market and ensure the nation's energy security.
In conclusion, while lower crude oil prices may appear to be a boon, they present a complex set of challenges for OMCs and the broader Indian oil and gas sector. The potential for excise duty hikes, concerns about price cuts, and the impact on upstream realisations and gas economics create a double-edged sword scenario. Navigating this complex landscape requires careful policy decisions and a comprehensive understanding of the intricate dynamics of the global energy market. OMCs must remain adaptable and resilient, while governments must implement policies that balance consumer needs with fiscal stability and long-term energy security.
Oil weekly chart with buy and sell levelsOil weekly cahrt with both buy and sell levels
High probability of some high impact news this week be carful
For a buy am looking at entering at 70.20 , expecting 72.00 and 73.40 next.
On the sell side looking at entering at 69.30 expecting 68.80 and 68.30 levels .
1 hour chart i like the buy side this week but of course wait for conformation.
Check out my other charts below

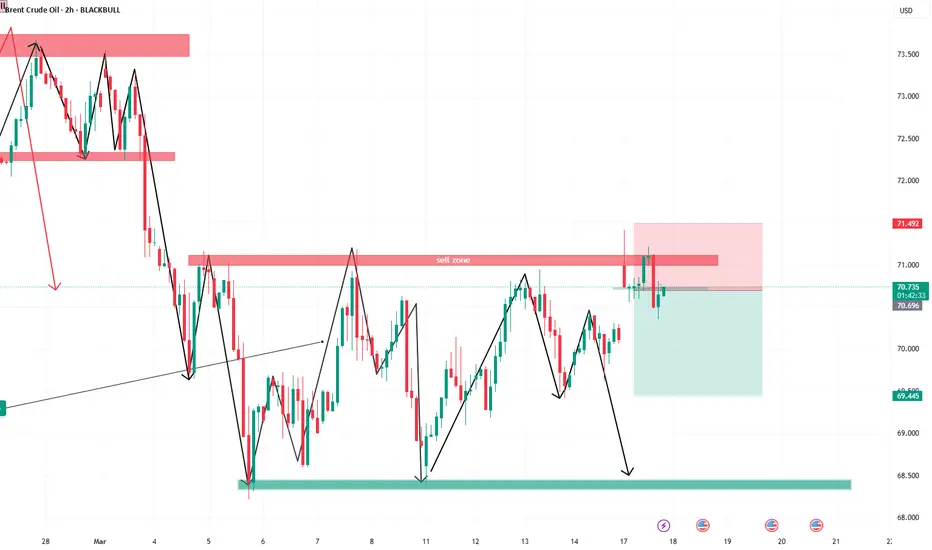
Oil - Looking To Sell Pullbacks In The Short TermH1 - Bearish trend pattern
Currently it looks like a pullback is happening
Until the strong resistance zone holds I expect the price to move lower further after pullbacks.

Go long crude oilDear Traders,
Currently, crude oil continues its downward trend, though the pace of its decline has moderated, showing signs of bottoming out. Moreover, oil has now pulled back to the critical support zone around the 68 level. Should oil fail to decisively break below this support, a technical rebound could occur at any moment. Additionally, with oil’s relatively low valuation, it becomes increasingly attractive in the market.
For short-term trades, I favor initiating long positions on crude oil, with an initial target of a rebound toward the 69.5-70.5 zone, which seems well within reach.Bros, profits are the ultimate goal in trading. Accumulating profits is what changes lives and destinies. Choosing wisely is far more important than just working hard. If you want to replicate trade signals and earn stable profits, or if you want to deeply learn the correct trading logic and techniques, you can consider joining the channel at the bottom of this article!
Oil weekly forecast with buy and sell levelsOil on the weekly chart shows a strong downtrend probably due to economic policies and over production.
This week we have to remain cautious and stick to known levels off previous support and resistance.
For a buy ill look at entering at 70.80 and follow up through the marked levels.
For a sell entry ill look at 70.20 expecting 69.30, 67.80 and high support at 67.00 to 66.80 levels.
Check out my other trade ideas linked below for Gold

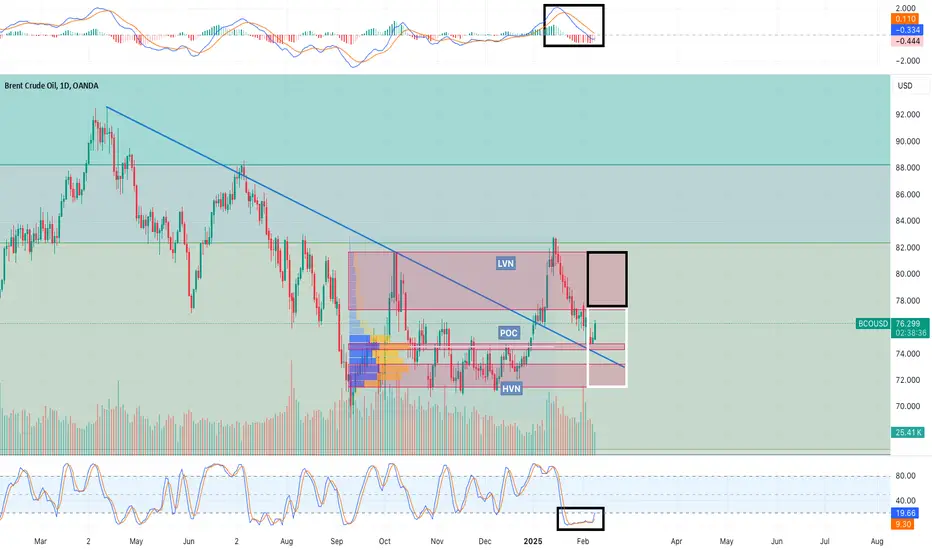
Weekly price prediction: $71.49 (Min) and $77.37 (Max).Projected Price Range
The anticipated weekly price range for Brent Crude Oil is expected to fluctuate between $71.49 (Min) and $77.37 (Max).
Contended Price Levels
$74.50 – Point of Control (POC) – potential support
$73.22 - $71.49 – High Volume Node (HVN) – potential support
$77.32 - $81.62 – Low Volume Node (LVN) – potential resistance
Technical Analysis
Fibonacci Retracement & Price Movement:
The price reached the 0.5 Fibonacci retracement level in mid-January before retracing.
This level has demonstrated consistent horizontal price movement over the past six months, indicating it as a key reference point.
Volume Profile Analysis:
High Volume Node (HVN): Found between $73.22 and $71.49, indicating strong liquidity and potential support.
Low Volume Node (LVN): Between $77.32 and $81.62, which could lead to rapid price spikes if the price enters this zone.
MACD and Stochastic RSI:
Stochastic RSI (Bottom Indicator): Has shown low bearish momentum over the last two weeks and appears poised for an upward crossover, signalling potential price growth.
MACD (Top Indicator): Remains in the negative region, with a few weeks left before a possible crossover, implying continued caution for bullish sentiment.
Additional Factors
Support & Resistance Considerations:
Point of Control (POC) and HVN are close to the current price, reinforcing these as key support zones.
The price is currently resting on a previous resistance level that has now turned into support.
The black rectangle above the price highlights the LVN region, where rapid price movements could occur.
The white rectangle represents a large support zone, which may contribute to horizontal price movement.
Geopolitical & Market Sentiment:
As always, geopolitical events could significantly impact price fluctuations, and traders should remain alert to any market-moving developments.
Conclusion
Brent Crude Oil prices for the upcoming week are likely to remain within the projected range, given the strong support levels in the current price zone. However, any breakout downward could be swift, while an upward breakout could be accelerated due to the LVN region.
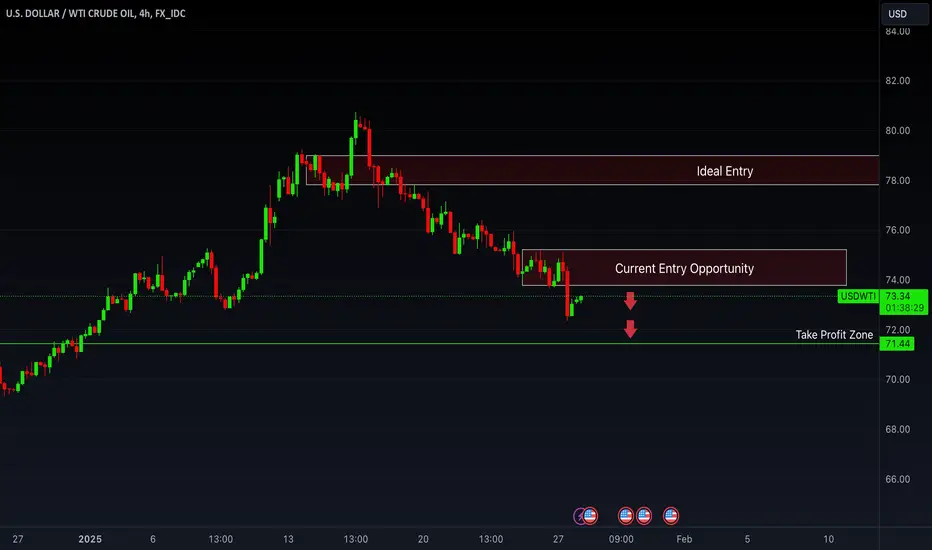
Energy Policy and USDWTIKey Entry Points:
Ideal Entry: $78 (Sell Position)
The $78 level was an optimal sell entry, primarily due to the declaration of emergency in the energy sector made by the new administration. This policy move is expected to increase energy production significantly. The current administration is heavily investing in the energy sector to mitigate price increases in other sectors, combat inflation, and maintain or reduce it. This macroeconomic context highlights why $78 was a strategic sell zone.
Current Entry Opportunity: $74 (Sell Position)
From a technical analysis perspective, $74 is a notable resistance level. While this level carries more risk compared to $78, it presents a viable sell opportunity due to price inefficiency beginning at this point. Observing the daily chart, we notice an efficient bearish trend with a clear price inefficiency that originated at $74. This inefficiency creates a strong resistance zone, making it a reasonable point for continuation to the downside.
Technical Analysis Across Timeframes:
Daily Chart:
The current bearish trend remains intact. The inefficiency at $74 reinforces the case for selling at this level. While not as secure as the $78 zone, it offers a good probability for a continuation to lower levels.
Weekly Chart:
The market is currently in an impulsive phase. However, no significant support or resistance zones are evident within this timeframe. This lack of structural confirmation increases the risk of entering at this level.
Monthly Chart:
The monthly chart shows a clear rejection from a downward resistance. This reinforces the bearish outlook and aligns with the target at $70.80, which represents a strong support level.
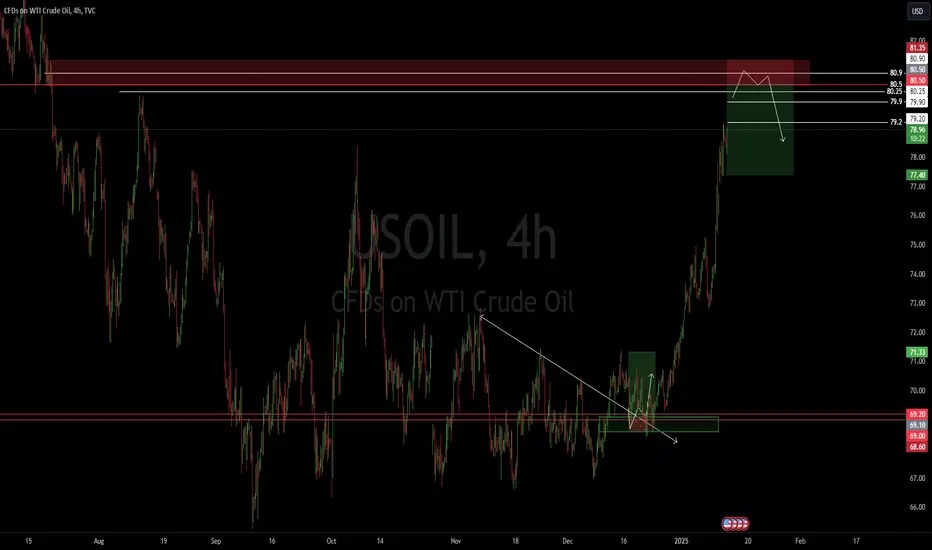
Oil Short 4HI’m excited to share my next setup for Oil. This trading idea is based on correction levels.
The main idea area is between 80.35 and 80.25. However, since oil tends to react to the 50 levels, I prefer to focus on the 80.5 level for my entry.
For the 4-hour entry, I am waiting for the formation of an M pattern with a lower peak at the second base. I’ll be looking to take scalp sell at the levels of 80.25, 80.35, and 80.5 for the first touches. after that, I'm going to wait for the confirmation to take the main Sell.
Please note that, typically, upon the first collision, we could experience either an impulse or a rejection entry. At the second base, we should wait for a consolidation area to confirm our entry. For a better understanding of this setup, please refer to my previous oil chart.
TP1: 79.9
TP2: 79.2
TP3: 77.4
SL: 81.35
Please remember that trading carries risks, and it's crucial to do your own research. The ideas shared here reflect my personal analysis and may not guarantee success. Always trade responsibly and consider seeking professional advice if needed.
Happy trading!