The effect on oil prices of Russia's invasion of UkraineRussia's invasion of Ukraine will most likely disrupt crude supplies locally and globally. Russia is the world’s second-largest oil producer. Russia is the main EU supplier of crude oil. To keep it simple, since Russia is invading Ukraine, this will cause major oil supply issues for the EU. If the US and other countries in the Middle East can keep the supply tap open for the EU, then this issue will not be that much of an issue. However, Russia is a major member of OPEC. Russia holds a lot of influence in this organisation. So they could, if they wanted to, pressure other oil suppliers to not supply the EU with oil. This would only be a short-term play. Russia is heavily dependent on oil sales revenue. War is expensive. I do believe the invasion in Russia will most likely be a month max. After that, the war will be finished, but further civil wars and political instability will most likely arise in Ukraine for years to come. This effect will not be big enough, in my opinion, to drive oil prices higher. Henceforth, this oil spike will be a short-term rise.
Furthermore, there is a growing concern about the imbalance between supply and demand following the opening and normalisation of the global economy after the Omicron variant subsided. In February, JP Morgan analysts projected that disruptions to oil flow from Russia could push oil prices to $120 per barrel. Oil prices last week, for the first time since 2014, reached $100 per barrel.
If Russia is backed into a corner, I highly doubt it, they could curb oil exports to their advantage. Previously, Germany delayed the approval of the Nord Stream 2 pipeline from Russia to Europe. As a result, Russia delayed shipments of natural gas. What stops them from doing it now? If they repeat this action, but for their oil exports, this could further lead to a short-term to medium-term rise in oil prices.
The impact of oil prices on the macroeconomy in Russia is also an interesting thing to look at. If the price of oil continues to rise, according to this study (Ito, 2010). Using an unrestricted VAR (vector autoregressive) model, a 1% increase in oil prices contributes to the growth in real GDP by 0.44% in the long run. However, war is expensive, so I doubt the benefits of the increase in oil prices will outweigh the costs of this war. Furthermore, this study reports that there is clear evidence for consistent claims in other literature pieces. Oil price increases are much more important than oil price decreases (Hamilton, 2003).
In summary, now that the war has begun, I only see oil prices spiking in the first couple of weeks of the invasion and not really after that. The US and other countries will likely supply the oil needed to sustain the EU. Winter is over, and the weather is getting warmer. Oil demand will most likely decrease. The major play with crude oil futures is right now. If the war is prolonged, as Sun Tzu states, no country has ever profited from a prolonged war - the oil prices may reach 110–120 in the next six months. Especially if the supply issues are not fixed and the outcome of the war is political instability.
Technical analysis
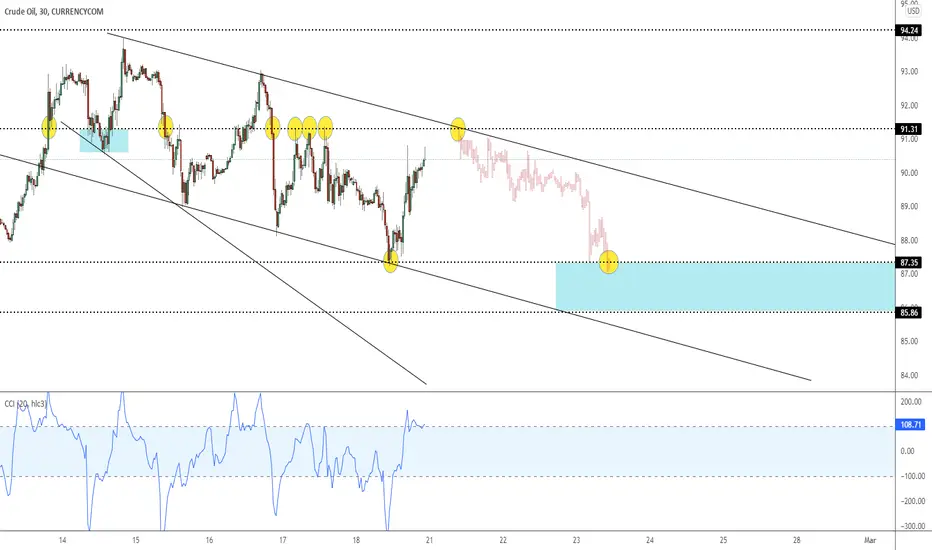
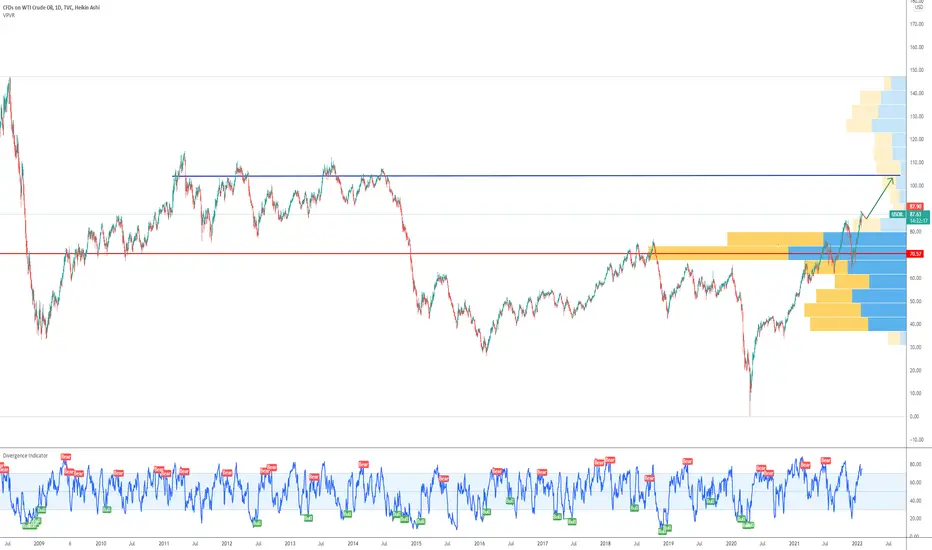
The Commodity Channel Index is a technical indicator that, as the name suggests, was designed to be used with commodities. If you want to, you can use it for a variety of assets. But I prefer to use it with commodities. It measures the current price level relative to the average price level over a given period. When it passes +/-100, it signals overbought/oversold levels.
However, the CCI is an unbound oscillator, which means there are no upside or downside limits. So, interpreting overbought and oversold levels is subjective. Furthermore, there are two problems with this indicator. First, the indicator does not take into account fundamental events. So, a political event or supply shock will be seen as an overbought level. However, because the CCI is an unbound oscillator, it can continue to rise. Second, unlike chart patterns, indicators lag in time. So, the CCI will take time to show a decrease in price on its CCI values. This means you may be seeing an overbought signal, even after the price has decreased and the price increase is over. Regardless, right now I believe the CCI shows a great piece of analysis - that is the CCI cycle represented by the yellow line. Henceforth, I will still be using it for my analysis.
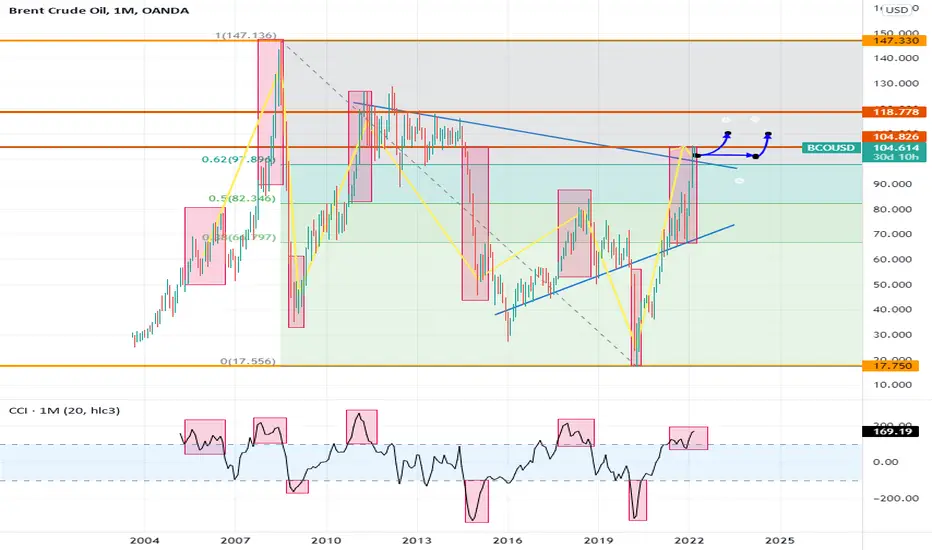
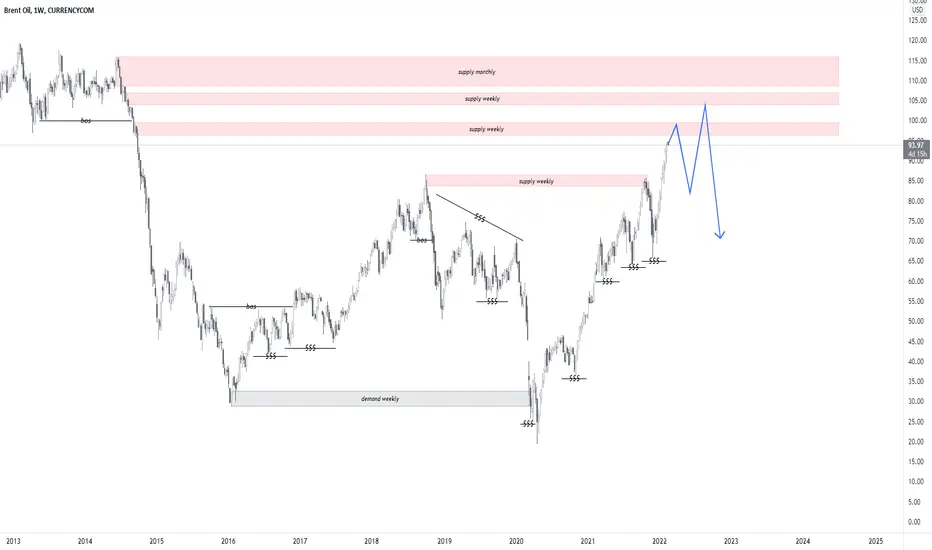
The CCI indicator data input is Length 20, Timeframe 1 Month. The pink boxes represent overbought and oversold levels with their corresponding price rectangles on the chart. As you can see from the yellow line, the price approximately follows a cycle. Over the last 16 years, the cycles have been reaching lower lows and lower highs. Currently, the rise from the last pink box is not creating a big enough spike in the overbought level in the CCI indicator, suggesting that the price can continue to rise. The CCI is represented by the yellow line, showing that the oil price is following a cycle. After the Russian invasion of Ukraine is over, you can expect the oil price to fall along with the CCI. However, I expect this to be 6 months after the invasion has concluded. This is an important cycle that the price of oil has followed for the last 16 years.
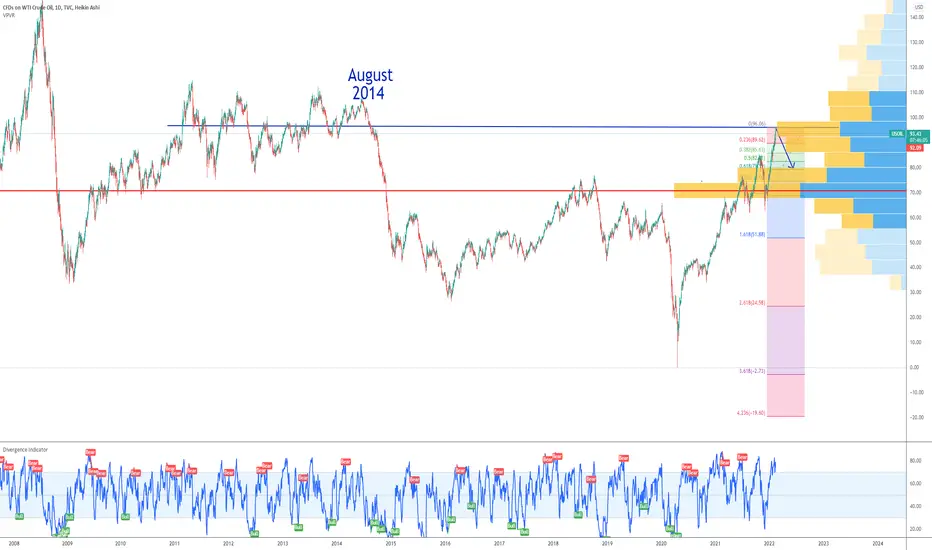
The two orange lines represent all-time highs and lows.
The two red lines represent a "box" of resistance and support. As you can see from Oct 2010 to Aug 2014, for almost 4 years, the crude oil price stayed in this region. This region will provide very important support and resistance to the oil price level if it reaches this point.
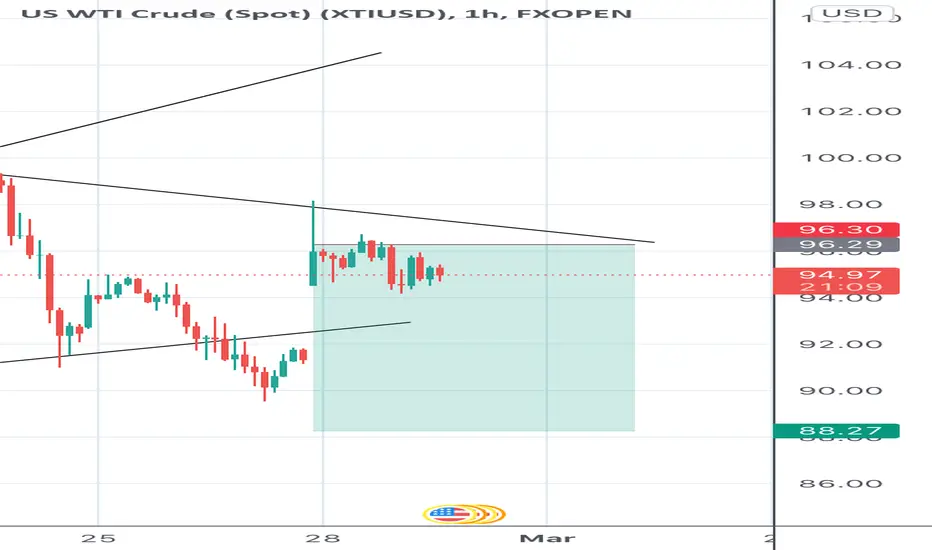
Using Fibonacci levels, we can see the oil price has been following a support and resistance pattern equal to the support and resistance of the Fibonacci levels. Right now, it has broken out of the nearest Fibonacci level that rests around $98. This will provide a level of support to the oil price. Along with that, there is another support level represented by the top blue line. Right now, in the event of stalling behaviour, I see the oil price staying between $97 – $105. The price may poke above or below during this time.
However, my confidence level in this support is not too high. The resistance and support levels given by the Fibonacci sequence, the red and blue lines, are strong. But the price range in this region seems too small. So, if the price stays here, it could only be for a couple of weeks to months. Following other price behaviour in the past.
Also, as you can see, the price touched $100 and then fell and has stayed there for the last week. The reason for this is that the $100 price level is a great level of resistance. I wouldn't be surprised if many traders used this price level as their take-profits.
In summary, the invasion of Ukraine has been going on for nearly a week now. The oil price has shot up, but not to a large degree. I'm guessing the supply chain is holding through and the markets have probably priced in this invasion, hence why the price hasn’t shot up that far as you would expect. If the price stalls, it should stay between $98 to $105. The key support and resistance levels. The price, in my opinion, may poke through the lower level if the war seems to be ending or through the top if the war creates problems for the oil market. I don’t see the price going above the bottom red line. Only if there are major supply issues with oil or geopolitical events related to oil. If the price does break the bottom line of resistance, then the price should only be there for a short time and eventually return down. Unless, of course, the geopolitical/supply issue persists, in which case the price is likely to remain above the bottom red line. After that, I expect to see the price of oil decrease and continue in its CCI (yellow line) cycle.
Oilprice
Update Update from my last chart, I have now moved SL to BE and will watch and ride from here. Best advise always move SL to risk free when suitable but watching not to get tapped. Rather get paid to take a trade then to hit SL. I am not a signal provider just a independent trader giving ideas.
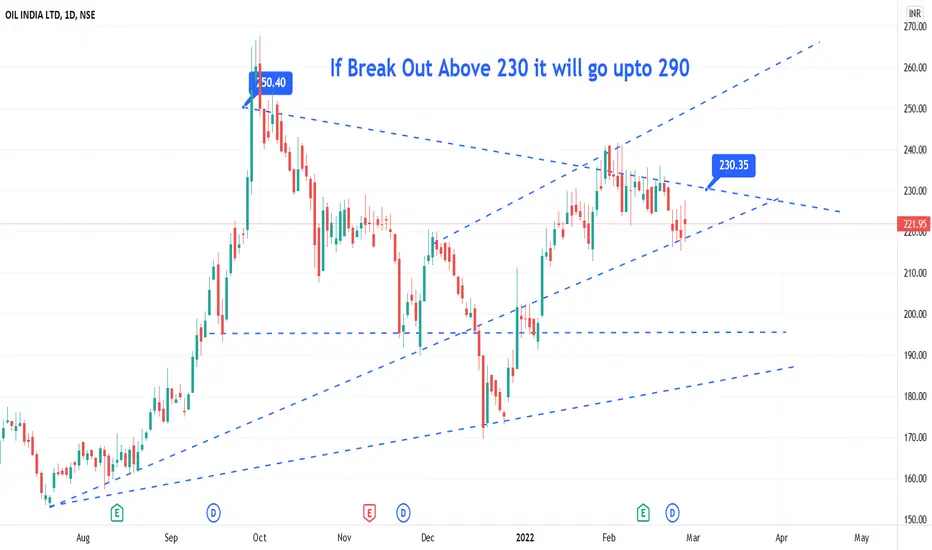
OIL India Share Target 290OIL India Share currently trading around 220 , 230 very important resistance so if break out above 230 it will go upto 290 possible very soon
WTI BULL March (initially Bear or sideways)26/02/22
FORECAST FOR WEEK 1 MARCH 2022 = NO CLEAR CALL
COMBINED FORECAST FOR MARCH 2022 = BULL (with an initial bearish start)
DAYS
WEEK 4 OF FEB FORECAST = BEAR = INACCURATE
PROBABILITY FOR WEEK 1 MARCH = NO CLEAR CALL POSSIBLE
This week was fairly neutral, until Thursday when a significant shooting star formed. The volume towered over all previous volumes, very nervous investors due to war. Friday's volume smaller, candle formed a spinning top. Next week has a good probability of being indecisive.
OBV is very bullish.
WEEK
WEEK 4 OF FEB FORECAST = BEAR = INACCURATE
PROBABILITY FOR NEXT WEEK = BEAR or Sideways
Large shooting star, a bull with exceptional volume. Previous weeks had tails rejecting move to the south. Overall week trend looks to be stalling. OBV is trending north, with this, it may indicate a stronger momentum at play.
Based purely on the price action path of least resistance says a few more bear candles are to come. No call for a reversal at this point.
MONTH
FORECAST MONTH = BULL
Sizable bull candle body with 1.2 times tail to the north. Clear of the previous resistance level this chart is now bull led by their influence. OBV now trends BULL another confirmation of a BULL dominated influence. The chart looks to have commenced a BULL rally.
=============================
FEB WAS BULL = ACCURATE
JANUARY FORECAST FOR FEB 2022 = BULL

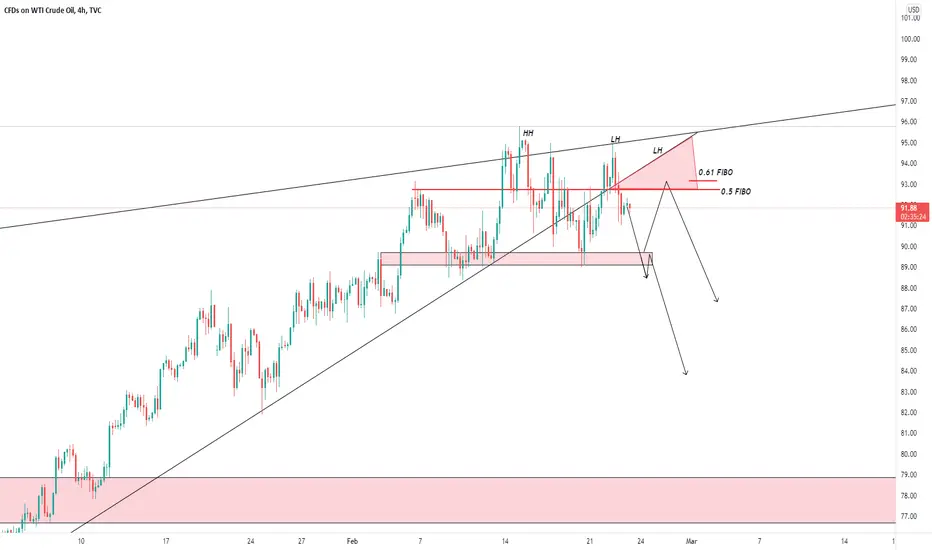
USOIL Update after catch 500pips from last analysisthe price can decline from 0.5 fibo direct we wait broke the simple support or access again to create lower high in 61 fibo to sell
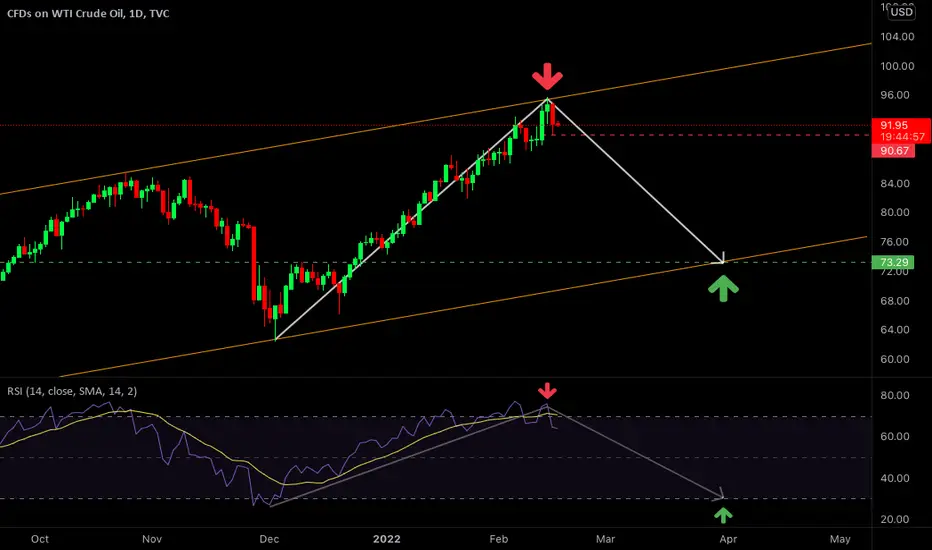
WTI Crude Oil | Daily Downside PressureHi everyone, It appears that WTI Crude looks ripe for a rotation towards the downside, the price has double topped and showing rejection along the peak of the ascending channel, alongside an indication of further overvaluation on the daily RSI. This is not financial advice just sharing with the community what I have been looking at, have a great day!
USDOIL Crude Oil top | Retracement level targetCan i call the $92 level the 2022 top for Crude oil???
We might see a retracement in USOIL after Russia reported pullback of military troops.
Some military units will start returning to their permanent bases after completing drills near the Ukrainian border, said the Russian Defense Ministry.
Extending the Fibonacci retracement tool, my price target for crude oil this year is the $79 support.
Looking forward to read your opinion about it.
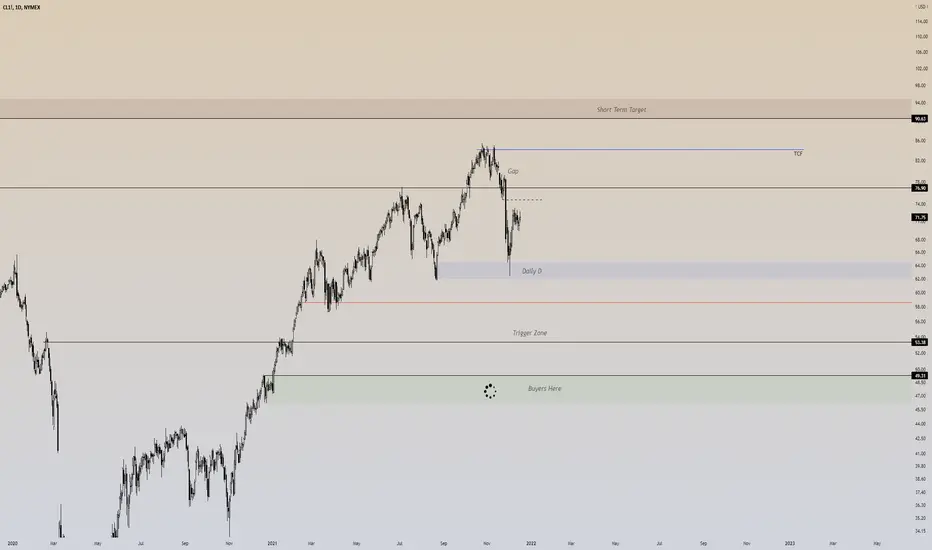
CL! Light Crude Oil FuturesHello Everyone,
I recently published the HTF version of USOIL. This is the daily chart for those who are interested in short term resistance and support areas.
OILhello dear treaders any news from oil ? ok.. let me read the chart oil. first of all lets take look at the oil chart We see that oil is rising sharply Now at what price can this price increase continue? No one knows But the traces of investors can be understood from the chart. Of course, one of the factors that has oil rising in this way is the tension between Russia and Ukraine.
In the oil chart, I see resistance from $ 100 to $ 105 even higher, but it is also possible that all of this will be broken because of the Russia-Ukraine war.
But if nothing happens and there is no war, the high resistances that you see in the chart can be activated and the price will fall.
If the price falls, it falls well because there is no demand area to keep the price because they are all consumed.
At the moment, in this political crisis, I can neither signal buying nor selling, I just have to combine all of these so that I can give you the right analysis.
Good luck.
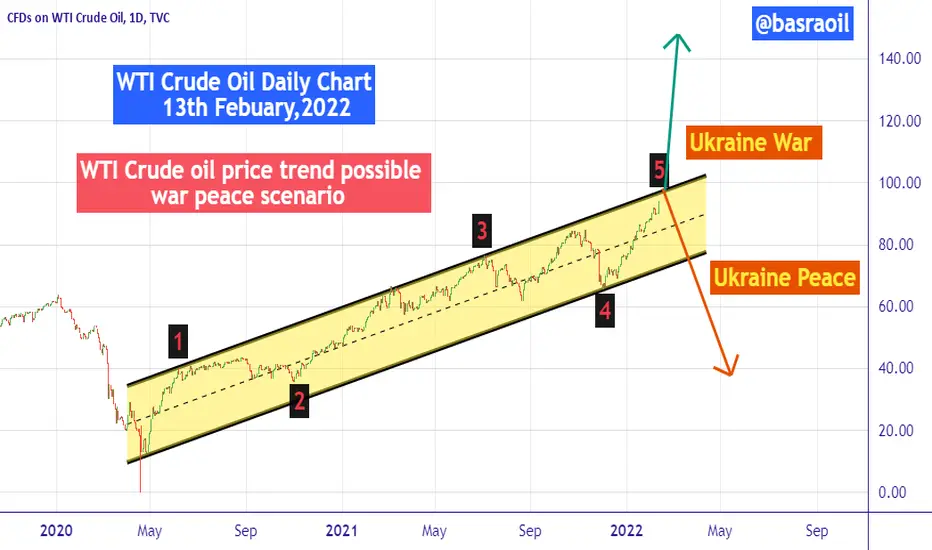
WTI Crude Oil - USOIL - Daily Chart - War Peace Scenario!Technically speaking WTI Crude oil price may be building a top for major correction for months to come.
In case of Ukraine War flared it may be obvious for crude oil to sky rocketed.
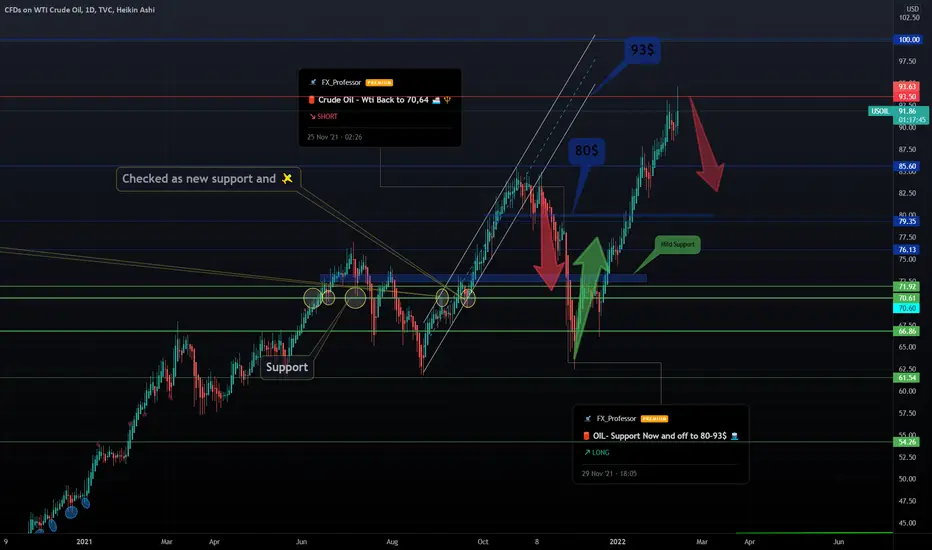
Oil- What are Biden & Putin Trading this Weekend?Today's lesson is about NEGATIVE BALANCE PROTECTION. 🎲🎲🎲🎰
The broker always has the upper hand.. except from nights like this one.
You see, markets close on Fridays and open again on Monday. When 'Urgent Situations' arise (like today, Foreign Office tells Britons in Ukraine to leave country now ), the trader can finally have an edge!
Oil:
The drums of war and uncertainty close to Russia affect Oil and Gas. Supply can potentially become disrupted and prices can rise even higher.
Murphy's law says: These things happen on Fridays, they are usually resolved/eased during the weekend, prices could normalize with a gap on Monday.
Now let's go back to NEGATIVE BALANCE PROTECTION and how I sometime use it, at my own risk :
I am entering a SHORT position on Oil at the closing of today's market hours. Doing so with an amount I can afford to GAMBLE WITH , on Monday opening hours I will have an account either at ZERO or at potentially x2,x5 or even x10.
Negative balance protection (some brokers have it, some don't) offers the investor/trader one of the very FEW advantages against the market. That's to be utilized tonight.
One Love,
the FXPROFESSOR 🎲🎰
ps. DYOR, Risk carefully and only what you can play with,..especially if you ever try such unorthodox methods like I am tonight
ps2. Been killing it on Oil:
Up, down, Up...now down again?
Oil Long Trade Idea With LOTS of confluences. In this trade idea I have put together my analysis for a buy trade in Oil lining up 4 or 5 different supporting confluences.

🔔Will OIL finally correction?After the explosive growth of oil, there seems to be a need for reform. What do you think, are we seeing an increase in oil prices again?
What do you think? I'm happy to comment❤️🌹

When USOil goes from 77 to 92...it hits 100 within a month 100% of the time.
Really interesting action here when USOIL climbs above 77. Fating back almost 20 years, everytime USOIL climbs to 77 and then to 92 it then hits 100, 100% of tghe time.
The magic 100 magnet is strong on this one.

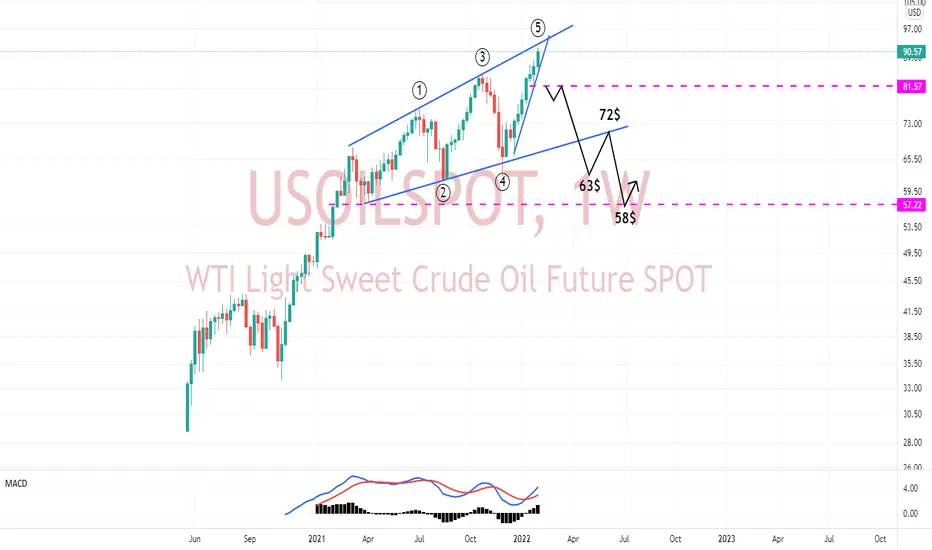
OILHello traders. I expect the price to end in a triangle, then we have to wait for the correction, which can reduce the price to $58. Are you agree?
USOIL Price Target for this yeari see a return to the $104 level sooner or later this year caused by the supply concerns and political tensions in Eastern Europe and the Middle East.
There is a possible disruption to European energy supplies because of Russia - Ukraine border crisis.
Crude oil prices will likely stay at the 7 year high since OPEC+ will keep the existing policy of gradual increase of production.
Looking forward to read your opinion about it.
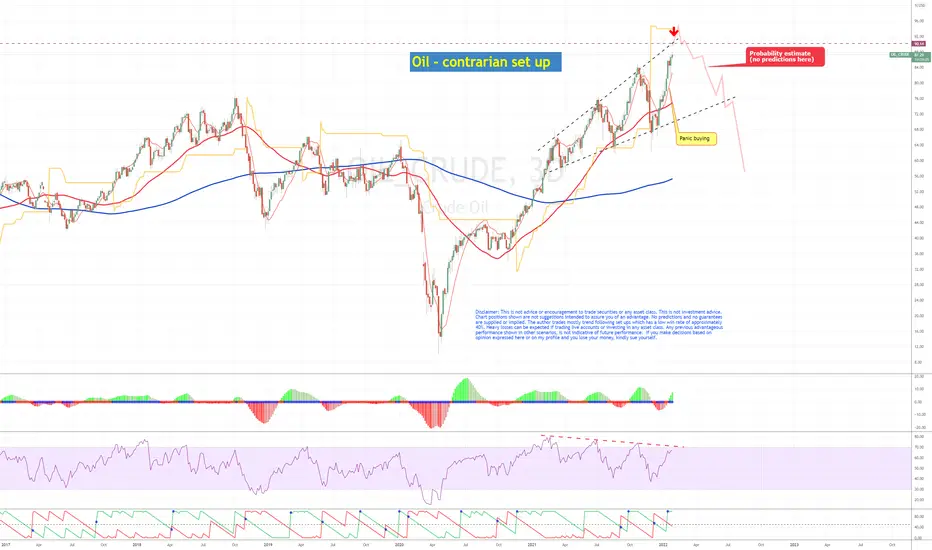
OIL: Contrarian setup aheadEverybody knows that oil is heading to the moon. In recent days, I've heard numerous estimates like $150. However, I think those estimates may be based on panic.
Contrarians dare to be wrong, in the face of crowd sentiment - obviously.
Everybody can see the same thing on the chart - a well formed rising broadening wedge in a bull market. Expand the chart a bit for a better view.
This presents a good probability of bearishness, though price is moving north. For this sort of picture there is an estimated >70% chance of a reversal. What that means is that there is a 30% chance that price will reach the moon. But what traders want is a solid prediction - which I do not do, because I have no ownership of the future.
Price doesn't have to get over 90. There is no rule that says wedges have to be 100% complete. But the pattern is sufficiently well formed once there are 3 important points on the upper and lower edges of the wedge.
So - in the above I am not saying that 'oil can't go to the moon'. I'm saying there is a lesser probability of that. The red faded line is only to give a picture of what could happen. A line going to the moon would not fit on the chart. 😲😁
I'll be keeping my powder dry, whilst some punch the air. Not a problem.
Disclaimer: This is not advice or encouragement to trade securities or any asset class. This is not investment advice. Chart positions shown are not suggestions intended to assure you of an advantage. No predictions and no guarantees are supplied or implied. The author trades mostly trend following set ups which have a low win rate of approximately 40%. Heavy losses can be expected if trading live accounts or investing in any asset class. Any previous advantageous performance shown in other scenarios, is not indicative of future performance. If you make decisions based on opinion expressed here or on my profile and you lose your money, kindly sue yourself.
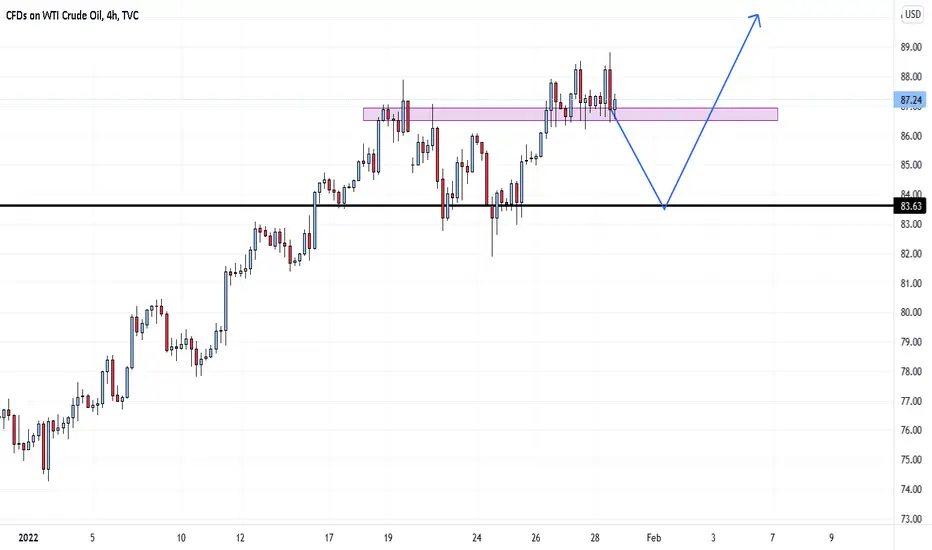
OIL - Looking for a pull backPrice has made a higher high so its likely to come back down to retest a level thats been previously broken
Im waiting for the highlighted area to be broken so we can come down for a retest before we potentially shoot off into space or most likely 107.00
USOIL Crude oilUSOIL has previously given the respect to upper trend line 3 times prior to this and failed to break it every time. if oil moves up in the upcoming days area near 95-99 will be very important to decide if its going bearish or bullish in the month of February.

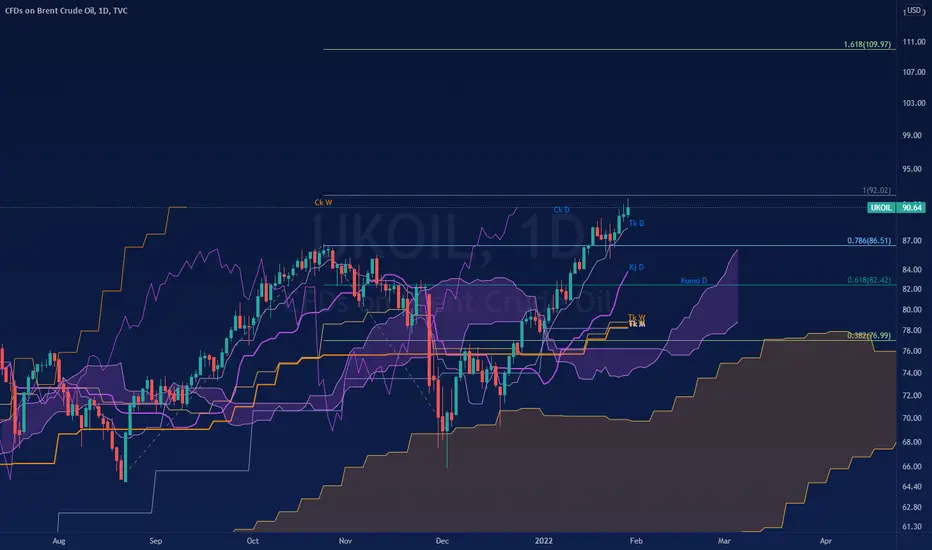
Which target do we look at for Brent ? According to Ichimoku, we're definitely bullish on long term.
Prices are perfectly supported by Daily Tenkan during their ascent.
With a Fibonacci Extension, I think that $92 is a probable target to look at. If this one breaks, we could look at the 1.618 Extension, at $109.9. Will depend on the evolution of the situation in Ukraine.
A possible fundamental bearish news could be that the de-escalation leads to a decrease in the attractiveness of black gold and produces a pull-back in prices, towards the Kijun Daily as first support.
What do you think friends ?
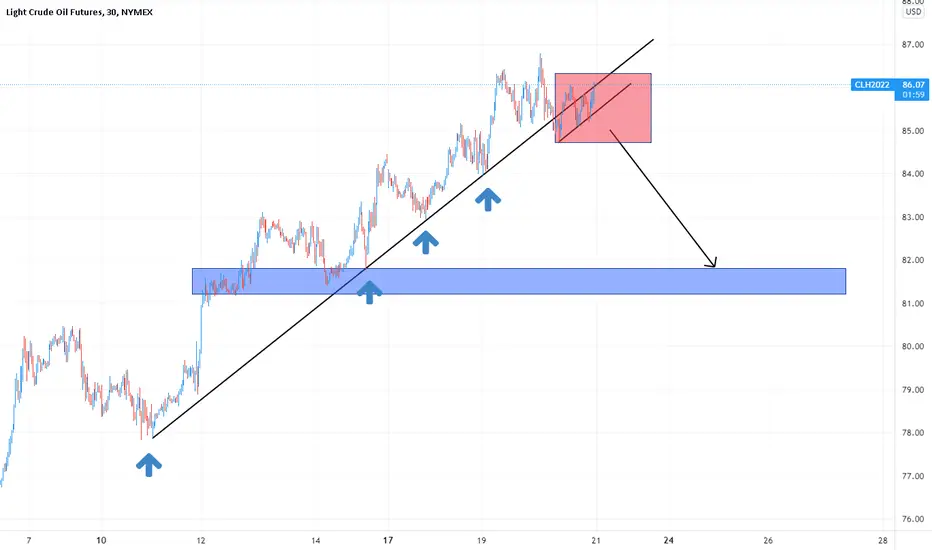
Triangle on WTI, Short on breakdownTriangle formation on short time frame, look for short entry
Key Levels :
81.2 - 81.8 - we might see significant support in this zone
Observations :
1 - Trendline support is drawn based on more short term basis and I think is more validated than most I've seen posted here as there has been numerous bounce from it as indicated in the chart
2 - Current formation for a catalyst pattern on breakout is support by trendline parallel to said trendline in point 1
3 - There might be a formation for a ascending triangle / rising wedge / parallel action in the pattern as indicated in the red box
Trade plan :
1 - I prefer to look for shorts entry here, but there is a small possibility for prices to return to trend based on a break up on a symmetrical triangle that has formed. But the current formation favors shorts
2 - I will not enter short here because it can form either a ascending triangle which is preferable or a rising wedge and parallel channel which is less desirable as there's more room for prices to increase
3 - Once entered, will target 81.2 - 81.8 for take profit
Will update accordingly
What's gonna happen to OIL price ..?TVC:UKOIL
in weekly , price of UKOIL has reached to a important zone which can act a resistance and push price toward down ...
this is only technical analysis and we also need to be aware of OPEC meetings results and also fundamental news around oil .
what is your opinion ? mention it in comments .
