Oilprice

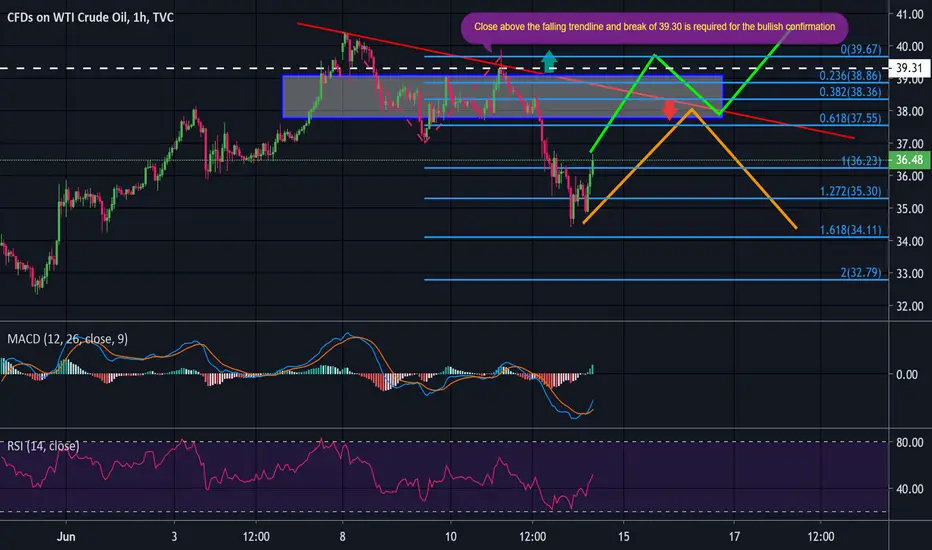
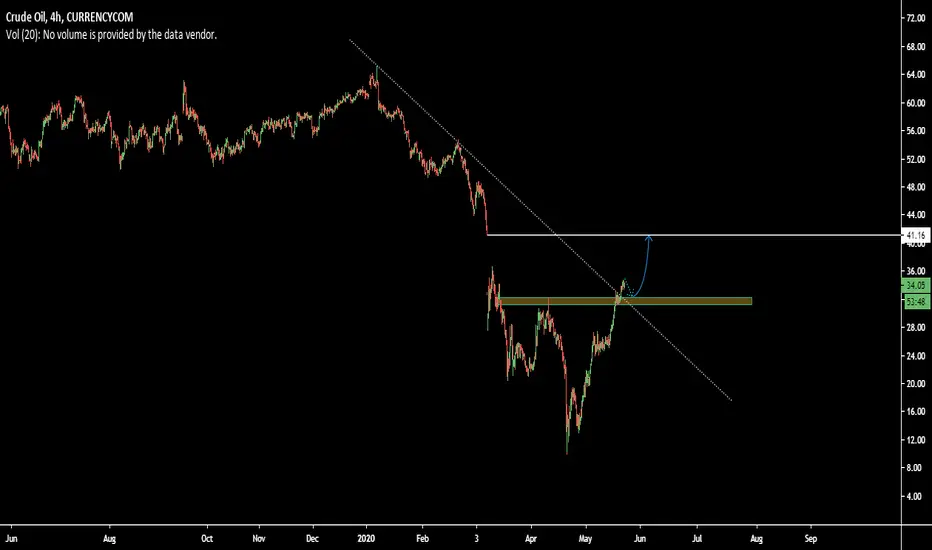
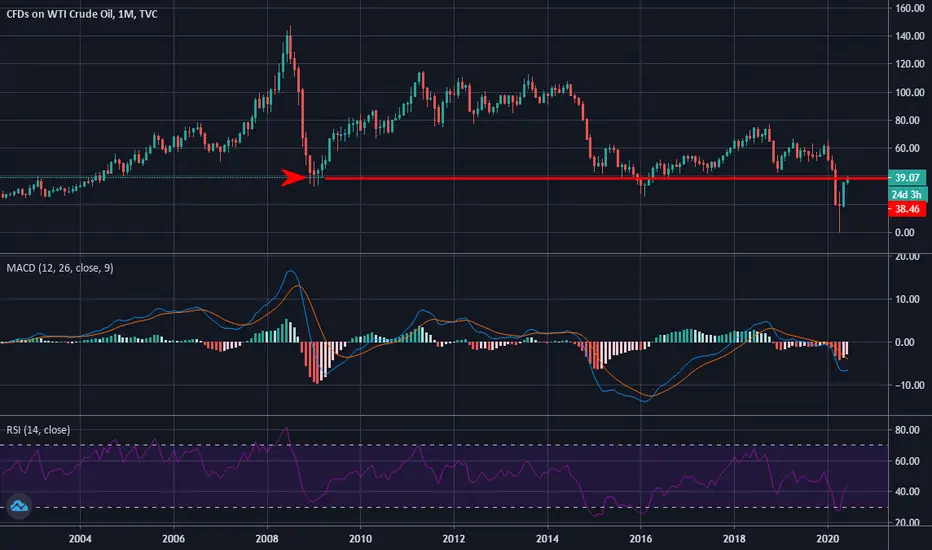
US OIL : Break above 39.30 required for Bullish ContinuationOIL has started the downward correction and reached around 34.60 which is the Fibo Extn. 1.61
Usually, if the price extends above 100% on Fibo, it's a sign of trend formation; one can expect the pullback and continuation of the move in the same direction.
Therefore, I remain bearish for OIL until it closes above the falling trendline and breaks resistance at 39.30
GOOD LUCK FOR YOUR TRADES !!! PLEASE SHOW YOUR SUPPORT IF YOU LIKED THE IDEA
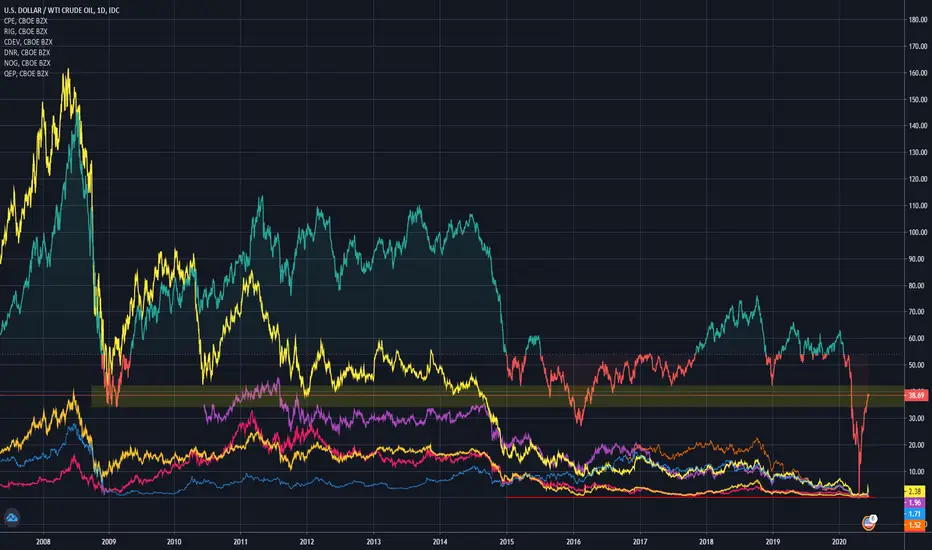
OIL Stocks vs Oil PriceOf course there's a correlatión between the stock and oil prices (WTI), but this chart can give us a little more understanding about it.
TSXV:CEP
NYSE:RIG
NASDAQ:CDEV
NYSE:DNR
AMEX:NOG
NYSE:QEP
I set the baseline price at $ 54.00, if you see the chart you can see some years above that price with a good stock performance and of course the opposite, but more important, the momentum where the prices drop and their effect on the stocks, right now we're just recovering the oil prices but the shares still low, so I think this could be a good opportunity for long term (except for those companies about to declare bankrupcy).
The baseline price is not fixed but I found more support and resistance points at the same level
This is not an investment advice.
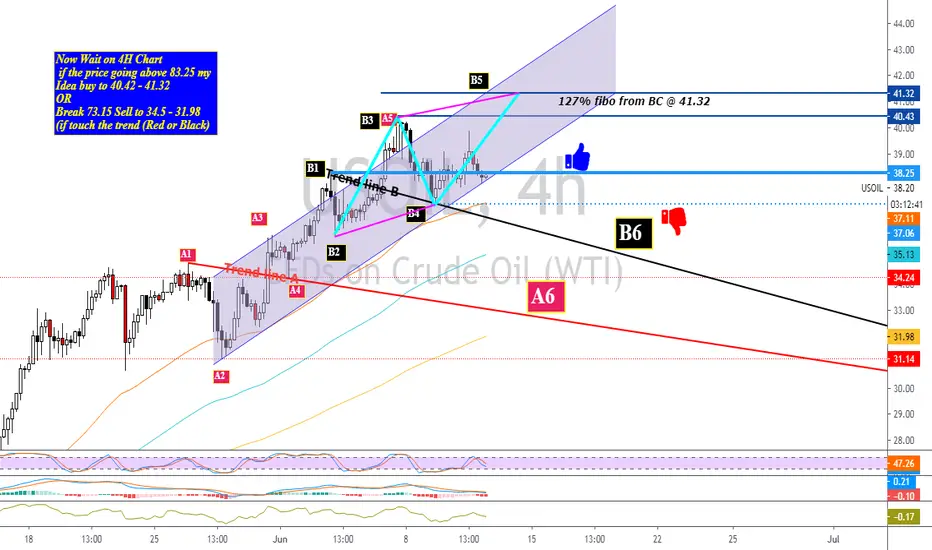
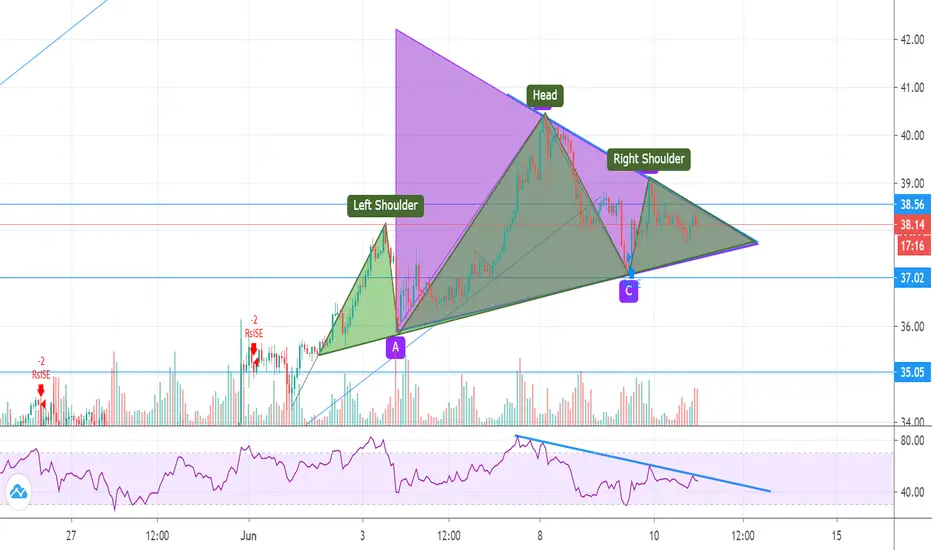
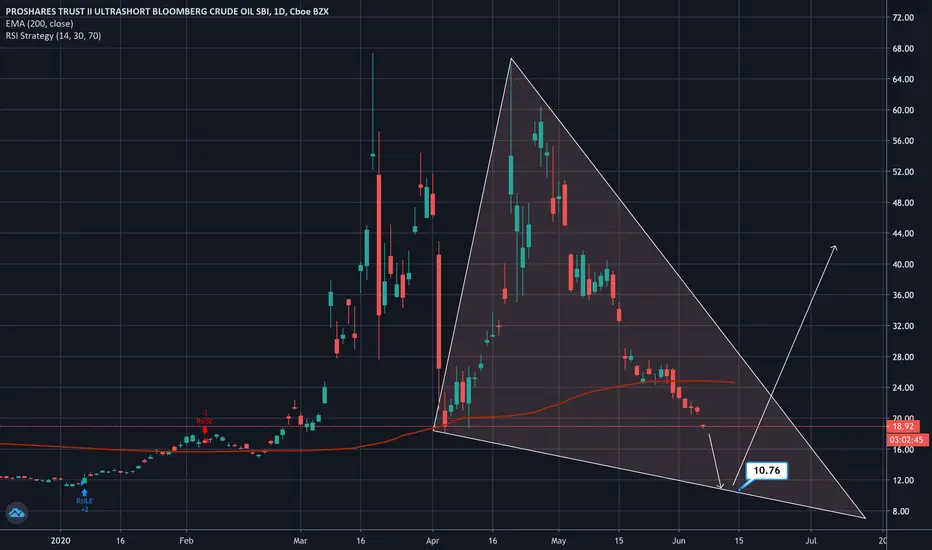
Where WTI is going to? When to short or to long?As we've seen at the beginning of this week that WTI had reached its highest value since COVID-19 has started 40.4$. As many experts expected that it needs a nice correction before going up again, but actually what was there was like the price was just moving around 38$.
Since the 2nd of June, we have started to shape the left shoulder of the needed pattern (head & 2 shoulders) which is a very nice pattern at the end of any uptrend + a triangle in which we are waiting for any real break of it.
I see here a very nice chance to short it if a 4-hours candle closed below the bearish level to consider it as a break of the neck, then we wait for the confirmation to target 37$ then 35$ if it continued, and our stop must directly above 39$ which is the right shoulder.
Also, we can long if a 4-hours candle closed above 39$ (which is the right shoulder line) to target again 41$ (the end of the gap).
Don't forget to share with me your opinion of it. I'm waiting for your comments!
A huge thing is going to happen at June 11 at 13 o'clockEverything are converging at one point and it is clearly indicating huge chances comming up. Everything is clearly pointing towards a bullish ralley.
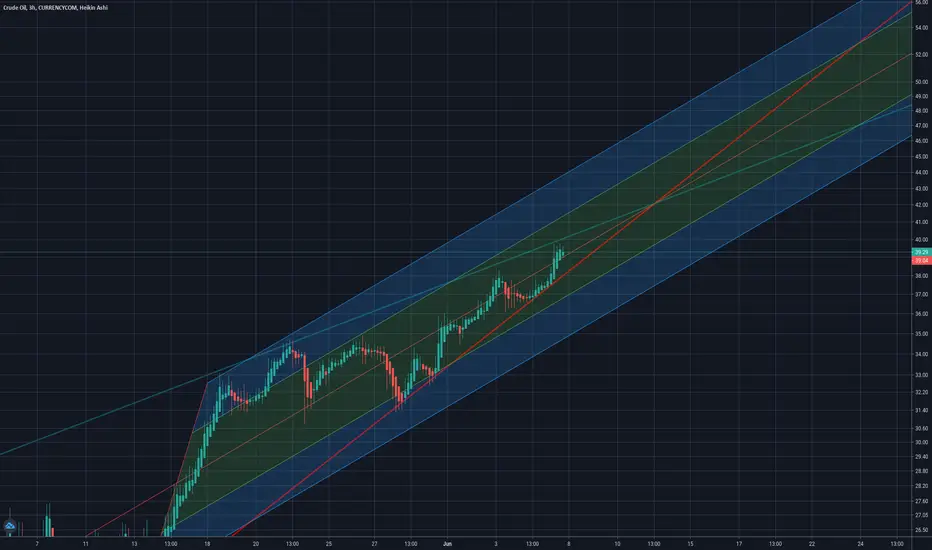
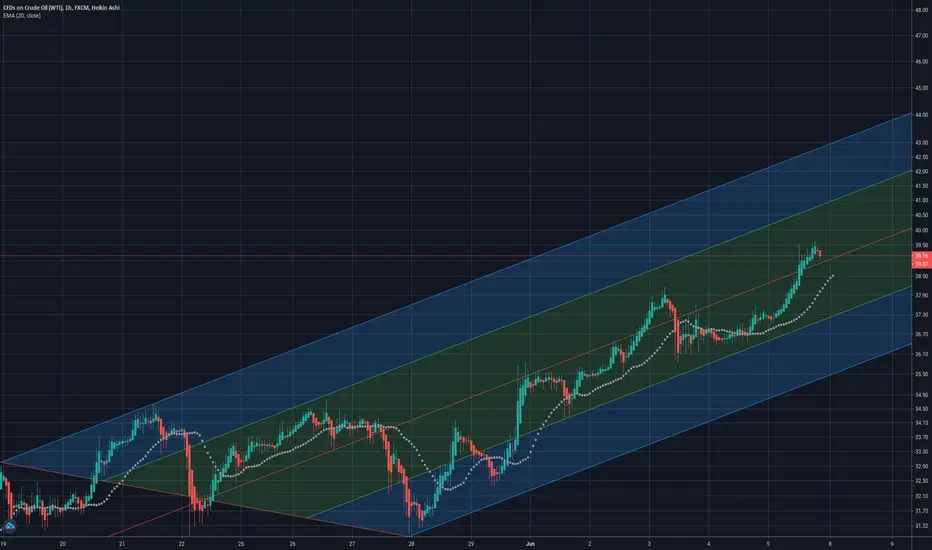
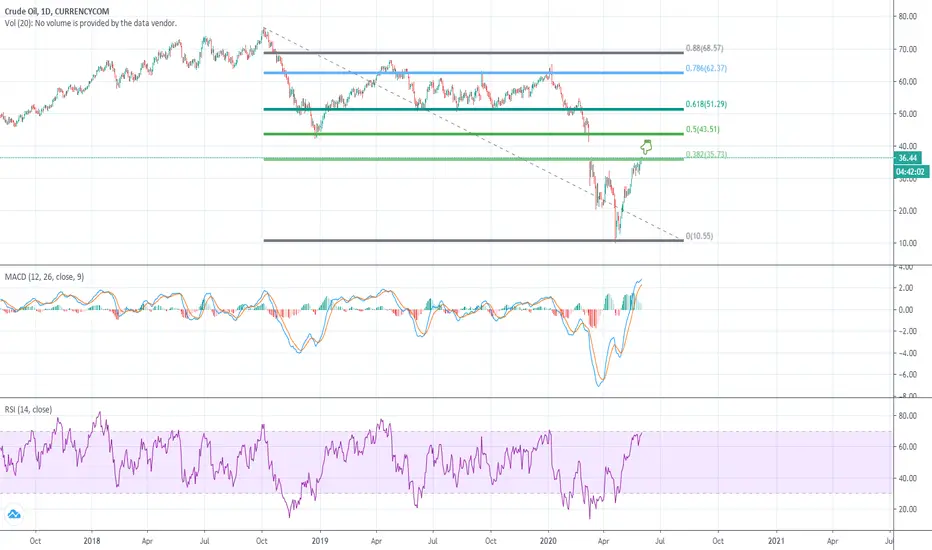
Clear and simple long term uptrend - without a doubtThe road to 50$ is clearly set. Target will be reached in July.
SCOIm keeping my oil longs open into next week fam. SCO looks like hot garbage, check my VIX chart & 10yr.
NDX has hit melt up phase but SP500 & DJIA still have room to run.
DXY is till in free fall
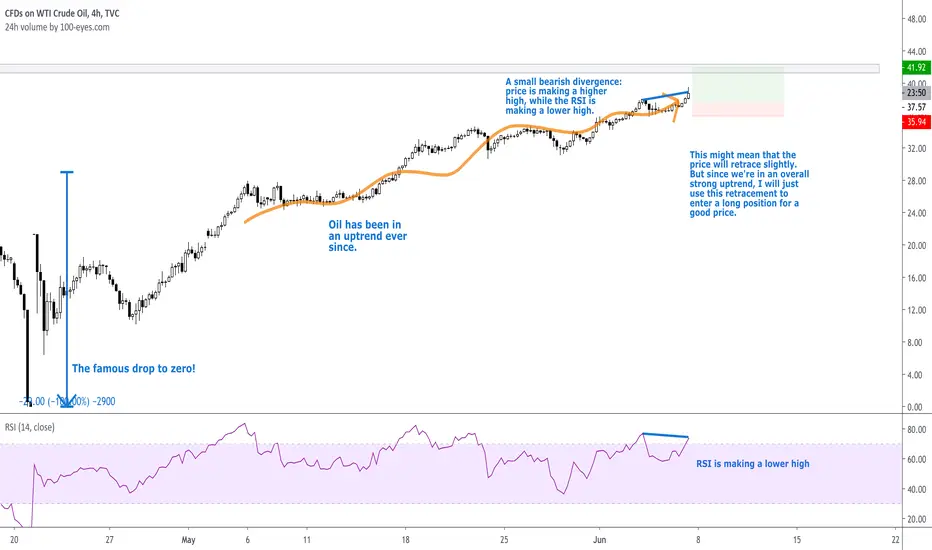
USOIL In Strong Uptrend - Buy After RSI Bearish Divergence!All info can be found on the chart. DMs are open!
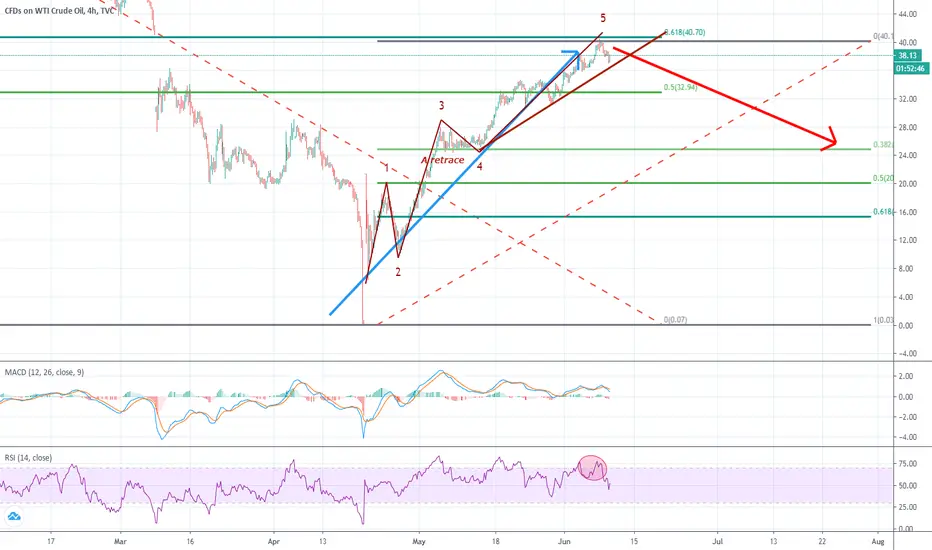
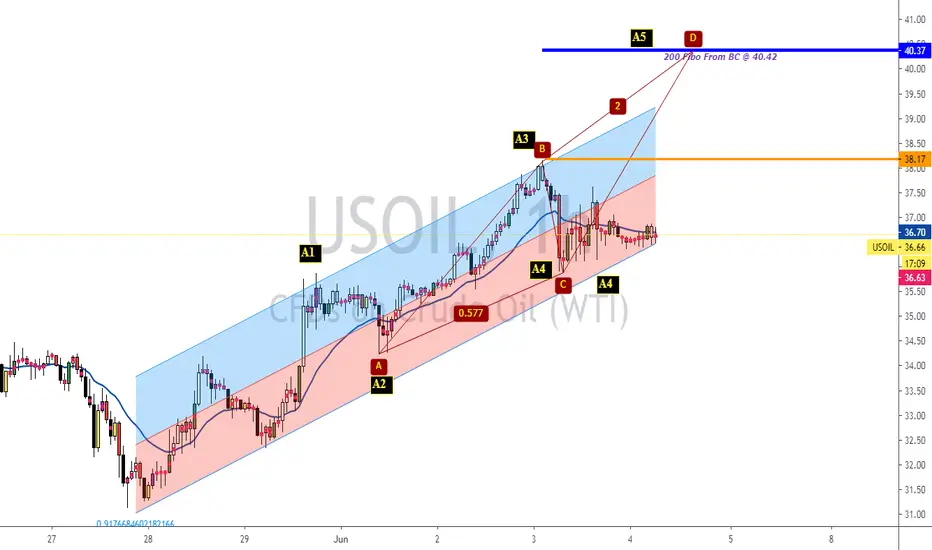
USOIL Long (Idea)Usoil Make Wolfe Wave and its Going to Wave 5
you Can See AB=CD
you See Bullish Chanel
the prive it will Visit 40.20
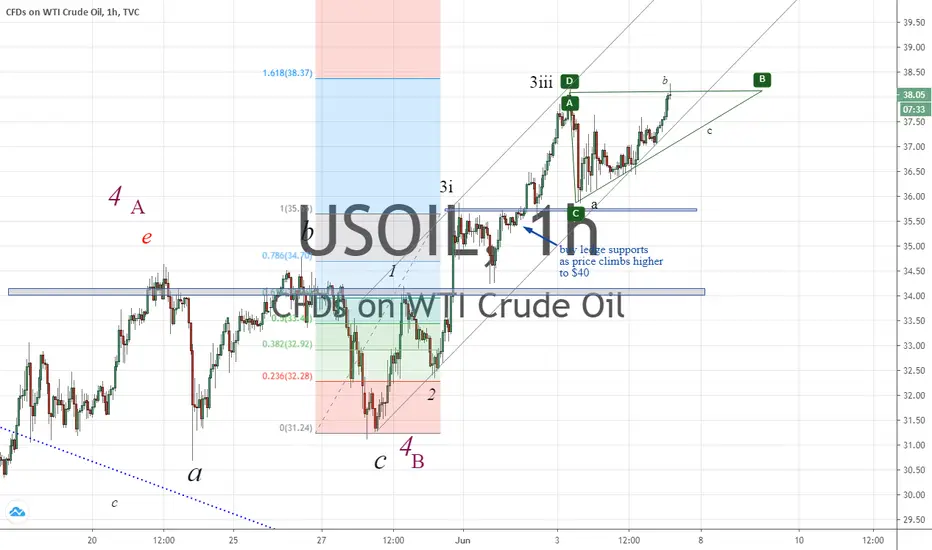
Small Correction + continuation in 3vThe triangular correction has shifted to that shown on chart
Close all pending longs at market for profit
Compile another long position (1/2 contract through limit orders @
Buy 10k @ $37.90
Buy 10k @ $37.8
Buy 10k @ $37.7
Buy 20k @ $37.6
Buy 10k @ $37.5
TP for all @ $ 39
Take Care & Stay safe
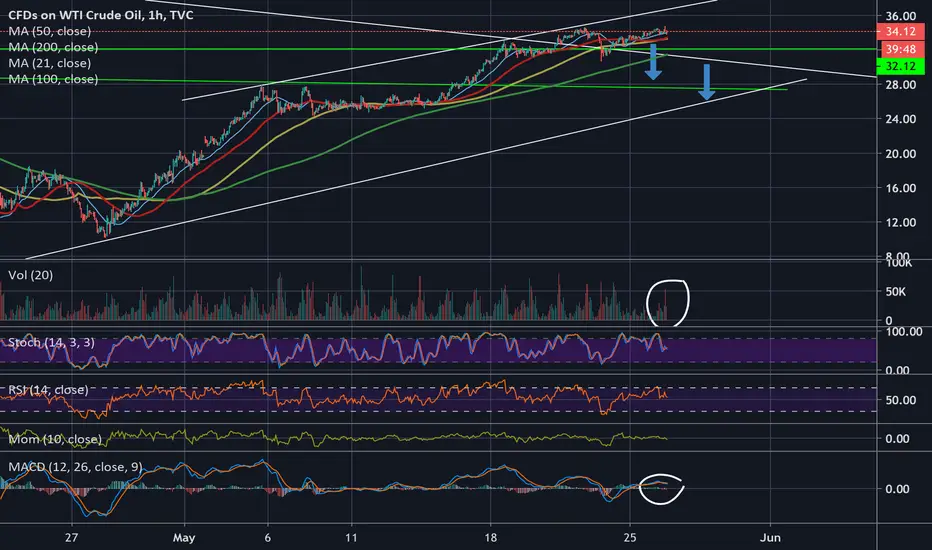
US oil short, strong divergence Oil looks good for a temporary respite on the march to close the gap at 41. We now have a nice strong divergence on the hour chart at the top of the rising wedge channel, we can probably expect a pull back to test either of the green support lines and possibly a test break of the rising wedge.
Stop just above the hourly divergence, profits to be taken at each support level. If the divergence fails 41 may come sooner than expected... and we could consider reverses and going long