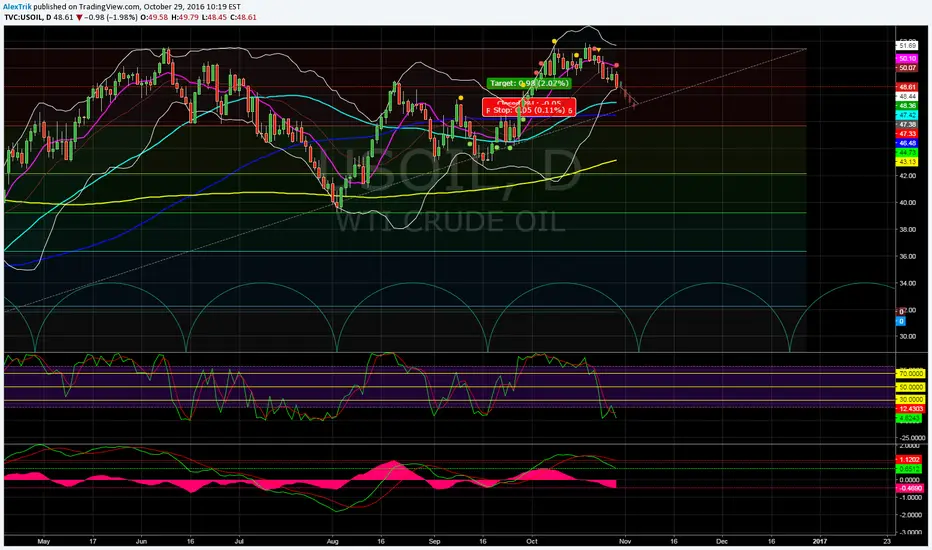
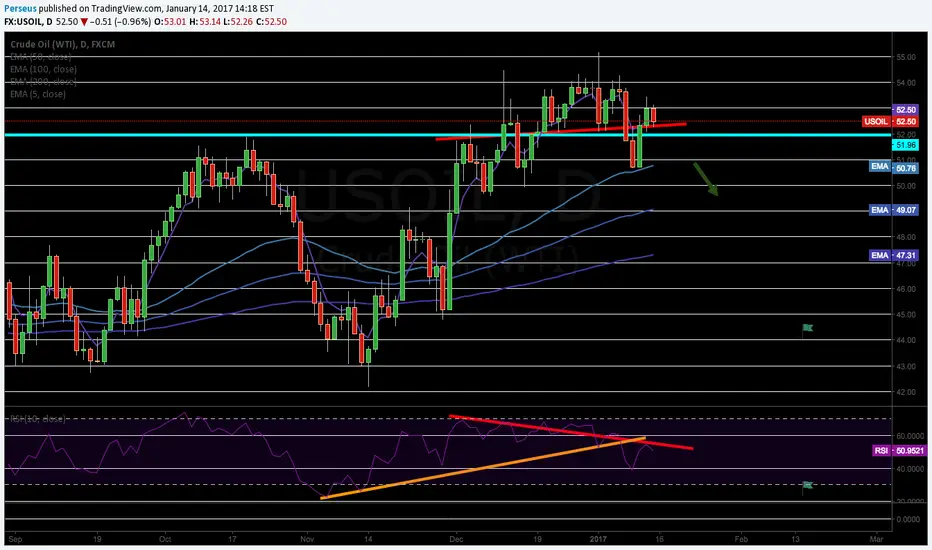
WTI Oil topped and retraced from support, should shortTVC:USOIL Shorting oil with take-profit target of 50.348 and a stop loss of 52.938. According to the daily chart, oil topped and retraced from R1 resistance in classical pivot points, it hasn't been able to close above this resistance and a major candlestick suggests that, for the short term, oil won't surpass R1. MACD is algo turning bearish, its histogram is approaching to negative value and according to CCI, it's in oversold levels. The price also topped support made by Donchian channels, giving another reason for shorting oil. In the long term, OIl should increase, since Saudi Arabia, other OPEC nations and Russia already started to cut production since the start of the year, so expect this reversal to happen only for the short term
Oilsell

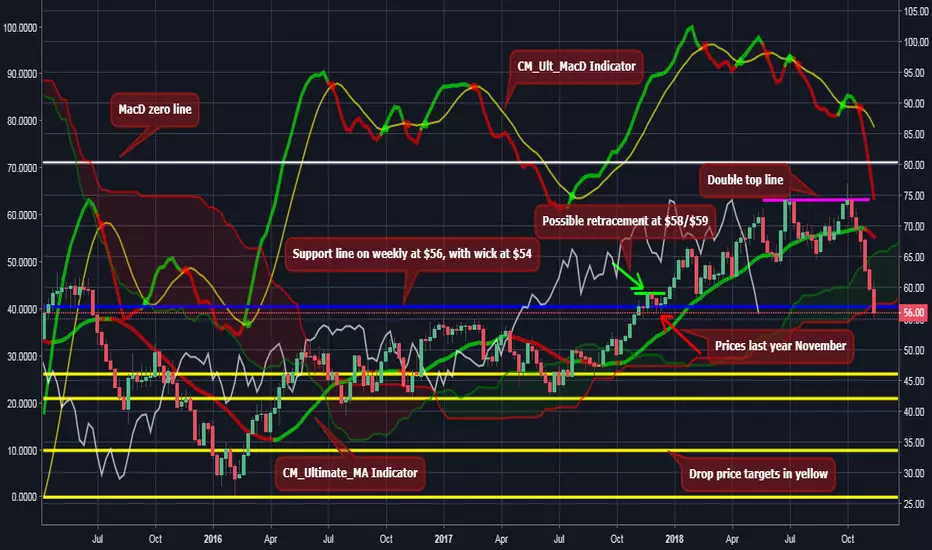
CRUDE OIL ON A SUPER BEAR TREND CYCLE? INSIGHT FULLY EXPLAINED!If you have been paying attention to oil then you would have noticed prices dropped from $76 to $54 in the space of a month and even more impressive is the very recent drop of $6+ in the span of around 24hrs, which was a jaw dropper for me. Just 2 months ago when market was still slowly climbing uphill I had outlined support areas for when market goes into retracement, which can also serve as resistance areas depending on your outlook. Little did I know we were soon to go into a huge and fast bear trend. Now as market has been dropping, it has smashed through much (though not all) of my support/resistance lines which are usually depicted with yellow lines on my chart.
So upon observing this major drop, I had to take a closer look at market beyond the daily here to see what weekly and monthly depicted and I saw the bigger picture in motion. Prices were exactly at these levels in November last year so current prices is not a coincidence. Market is following its steps back and as a super bear trend, the chances of market to continue on path to its history looks very much likely.
Bear trend was also confirmed on the weekly with the double top that played out when market hit mid $70s twice before finally taking an official downturn. You can see both tops are in alignment where the candle bodies are aligned, this is highlighted by my pink line in the chart and also labled.
Double Top: The double top is a frequent price formation at the end of a bull market. It appears as two consecutive peaks of approximately the same price on a price-versus-time chart of a market. The two peaks are separated by a minimum in price, a valley. The price level of this minimum is called the neck line of the formation. The formation is completed and confirmed when the price falls below the neck line, indicating that further price decline is imminent or highly likely. en.wikipedia.org
Now on the weekly based on it's history, the bottom of current support is $56 with the wick down to $54, hence why we see market swimming at current prices, but I believe this will not hold and after some retracement going up that is in high order, market will continue on its sinking path and the next support is at $45 with the candle wick all the way down at $41. After this, next support is $33 with wick all the way down to $25 and this ladies and gents is where the super bull trend cycle originally started it's journey.
Also, looking at the CM_Ult_Macd indicator, this was first to highlight the bear trend, first on the daily, then weekly and past few days the monthly MacD just broke into a bear too, next indicator is the CM_Ultimate_MA, this usually depicts bear trend slower than the MacD but it is bear on the weekly, yet to depict on the monthly. Also prices are inside ichimoku cloud on the monthly which does not look good for the upside while the weekly and daily view have prices under the cloud which indicates market to be in bear trend on those outlooks. So it would seem prices are pretty much bear and the only thing barely holding prices up is monthly outlook.
Now for the retracement going up(which is in high order), we may possibly see $58/59, but if a wick is decided to form on the monthly view it may take us into the $60s but would stick to the lower end of $60s. This retracement may or may not play out, so not guaranteed but hopefully it does so I can get a better sell position for more profit as I unfortunately exited my sell at $58 prior to seeing the bigger picture at play.
Now I charted this using weekly outlook to show the double top and why market sits at current prices but will shortly update with the bigger picture that ties everything together, which is the monthly view. Here you should better see why the target prices are chosen on a further drop so stay tuned.
Here is a chart i made putting together with a few well-crafted indicators by some great creators on tradingview. It allows you to tail trail oil market intraday on the 3 minute view. I hope many of you find this helpful, i use it to trade myself :)
tradingview.sweetlogin.com
Here is a link to understand better what this little tail trailer will be showing you.
en.wikipedia.org
Furthers Tips;
Alternative to trading Crude Oil is Brent Oil, this market moves like an identical twin to Crude they mirror images of eachother. Polar opposite to both markets is Natural Gas, this market moves in the complete opposite to Crude and Brent atleast 90% of the time so although I am yet to analyze NG market, it has not failed to meet expectations in contrast to crude movement in the past year of my observations.
Also Apple Market is another market I've been trading the past 2 months, prices have been sinking and I see a bottom of 160s which should playout within the next 4months so watch that space closely. You can either get in on further drop or if not confident then wait for bottom and get in to buy market up when it gets back to bull trend.
If you have enough funds and want to be like Warren Buffett, invest and HODL for the long term, then look for markets that have bottomed out, get in and hold for years because the only way is up, one of many I spotted is Platinum, which i will link my chart to this post, feel free to check it out.
Oh and the period for crypto to take a turn for the upside is upon us again so look into that. If you notice, many markets are on a superbear cycle and I predicted beginning of this year that markets are due for a crash and once this happens, much of the money will jump into crypto. Now call me intuitive but I see this has started playing out in the past few months. Look at major stock markets! If it helps, I am a hodler in Tron, Bitcoin, Ripple and few others via binance platform.
DISCLAIMER;
Do set stop losses when trading but be generous with how much room you allow for this due to candle wicks and there is also the possibility to hedge yourself, for more confident traders.
All comments and questions welcome, if curious about indicators I use then feel free to inquire. IF YOU SUPPORT MY IDEAS THEN LIKE, FOLLOW & SHARE.
Sell Oil as one of the best trading ideasOil continues to grow, and Brent has already exceeded $ 85 per barrel. In our opinion, this is just a great opportunity for sales.
Yes, technically, there is an uptrend in the dynamics of oil, and market sentiment is in favor of purchases, but these are all temporary phenomena and we will further explain why.
Let's start with the reasons for the current growth. By and large there are several of them. The first and main one for today is US sanctions against Iran and a sharp decline in oil exports from this country. Further, we note the continuing disintegration of the Venezuelan economy, which has already led to a drop-in oil production in this country, the richest in oil reserves in the world. In addition, the last meeting of OPEC showed that the current status quo in the market from the point of view of the OPEC member countries remains (it is not planned to increase production yet).
Despite the importance of each of these factors and their impact on the oil market, we believe that all of them are temporary, but the changes that occur in the world in terms of energy consumption patterns are more significant and permanent.
Speaking about the factors that can trigger oil sales, we note the following:
- The basic concern of oil buyers - a decline in demand for an asset because of a slowdown in China’s economy, which in turn is threatened by Trump’s trade wars. This factor has become particularly relevant this week, because after the conclusion of a new agreement between the United States, Mexico and Canada, Trump again has his hands free in terms of intensifying the trade war with China. So, the attention of the markets can be switched to this moment, and then oil will fall in;
- the growth of supply in the oil market from the US - it is not only about record volumes of oil production in the USA and the growing export of oil from the USA, but also the possible use of US strategic reserves and their launch into the market. Given the size of US strategic reserves (over 500 million barrels of oil), supply on the market can grow very sharply, which will inevitably provoke a decline in oil prices;
- seasonal drop in demand for oil – there is some seasonality in the conjuncture of the oil market. The reason is that in the fall many refineries are closing for repairs, which leads to a reduction in oil demand (according to Dow Jones Agency, October is the worst month for the Brent brand relative to the average monthly dynamics since 1990, while November is considered the most unfortunate month for WTI). The result is a drop-in oil prices;
- the growth of supply in the oil market from Saudi Arabia - the kingdom soon may increase production volumes by 0.5 million barrels per day, which essentially compensates the negative effect on the supply of oil on the market due to sanctions against Iran;
- analysis of the forecasts of leading banks and investment companies shows that most of them consider current prices to be too high and predicts their decline in the foreseeable future.
So, we recommend selling Brent oil with minimal targets around $ 80 per barrel, and in the case of a full-fledged correction and reversal of the current trend, then we can talk about more optimistic marks in bottoms 70.

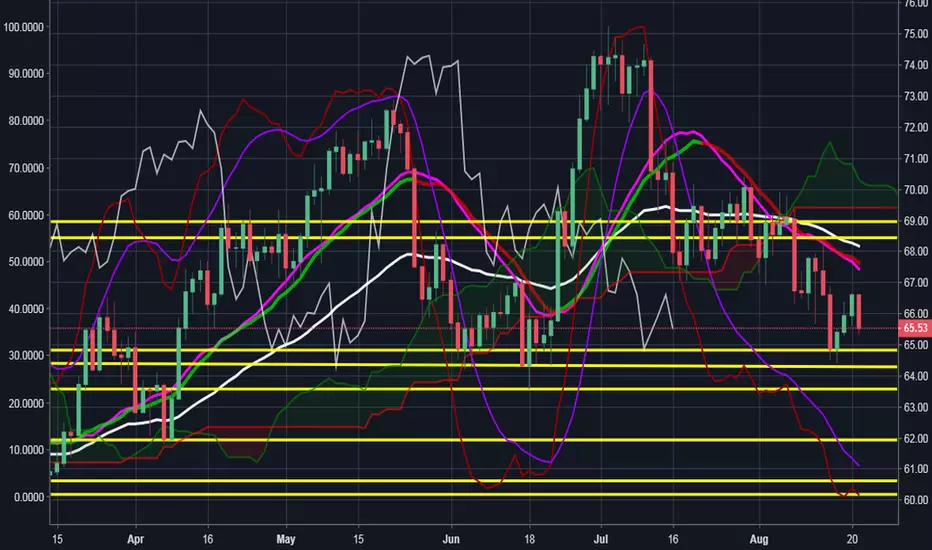
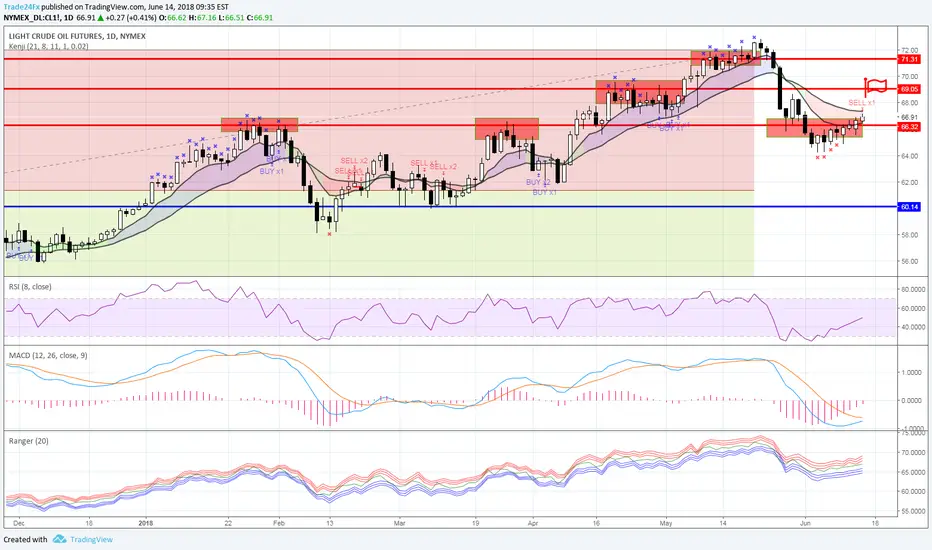
CRUDE OIL LONG-TERM OUTLOOK TO GO 'SHORT'Looking at the long-term analysis on the 1D view of Crude Oil, it looks like it is headed downward. Swing trade wise, it could still go up to 67/68 region, which you can swing trade if the opportunity presents itself. However, long-term view Oil is headed downward from it's July's high of 74, prices are below ichimoku cloud which is bear market indication. Now it could take weeks/months to hit bottom but I suggest leaning toward bear trend for the long-term outlook.
Have a look at 1HR or even 4/hr view for a more suitable entry point to go short. Suitable entry point being when many indicators are corresponding to go short, this way you are not stuck in a huge retracement and confuse for a trend reversal.
'A retracement is a temporary reversal in the direction of a stock's price that goes against the prevailing trend.'
The different yellow horizontal lines represent possible support and resistance areas after analyzing Oil market on 4HR, 1D and the 1W view. I suggest using it as a guideline and look for areas yourself and work with indicators in the long term view to determine when you want to exit market.
Please remember to look at what indicators are telling you if you can understand some, as they would likely help you determine a suitable entry point. Also, do set stop losses but be generous with how much room you allow for this due to candle wicks and there is also the posiblity to hedge yourself, for more confident traders imo.
All comments and questions welcome, if curious about indicators I use then feel free to inquire.
Fundamental factors suport oil, but this is temporarilyThe increase in oil that we observed on Tuesday is largely due to news about production problems in Canada and Libya, as well as data on US oil reserves from the API. It's about stopping an oil refinary in Fort McMurray (Canada) due to an accident (a transformetor explosion). According to current information, it will take about a month to repair it. The losses from this stop will amount to 360 K b / d, which is a very serious amount even on a global scale. As for Libya, there is another redistribution of oil control in the country. However, this is not something really new. What is characteristic, the official Tripoli declares its plans over the next 5 years to increase oil production by 2 times, to 2.1 million barrels per day.
AND the latest news in favor of local oil growth was the data from the API, according to which crude oil reserves in the US fell by 9.23 million barrels (a record value since September 2016).
Despite the more than convincing growth of oil against the backdrop of such news, in our opinion, these events are of the nature of temporary force majeure, therefore we consider them as a momentary factor of influence.
But more interesting in terms of strategy news is the information that Saudi Arabia is going to set a record for oil production. Aramco expects to bring oil production up to 10.8 million barrels per day in July. Recall, in May, the volume of production was 10.03 million barrels per day. That is, we are talking about the appearance of an additional 800K b / d on the market. And this is very, very serious. The last time such volumes Saudi Arabia produced at the height of the race for market share in 2016.
That is, the results of the OPEC meeting are already making themselves known. And this is without the latest data from Russia, which was even more serious than Saudi Arabia.
Thus, the current price increase is just a gift to those who did not manage to sell oil at $ 70 per barrel (WTI brand). Our position is unchanged - to sell oil. Those who have done this before should be added, and those who did not, can open even with double volumes.
Results of OPEC meeting: oil prices fall is almost inevitableOn June 22-23, OPEC met in Vienna. The main issue that was on the agenda was the increase in oil production.
Recall, Russia and Saudi Arabia have taken the initiative to increase oil production. In the last report, we reviewed three possible scenarios. Actual results are something between the compromise and the initiative of Russia (production growth of 1.5 million b / d). So, it was decided to increase production by 1 million bbl per day. This, of course, is not a complete refusal from OPEC +, but in general is a very strong negative signal for the oil market. You do not need to be a big expert on the oil market to understand what the sharp increase in supply in the market leads to. Of course, to the drop-in prices on it. The reverse situation was observed after OPEC + reduced production. The price of oil has risen sharply. And we do not see a single reason why this time the basic laws of the economy should fail.
Rather, judging by the semi-panic reaction of the opponents of production growth (almost every country has its own opinion on the results of the meeting and the size of the production growth), they suffered a serious defeat. It should be noted that the increase in production is beneficial primarily to Russia and Saudi Arabia, because they can increase it. And countries like Venezuela, Libya, Iran and others have problems with it. As a result, they risk losing market share.
Summary. On the oil market are throwen out additional and very serious volumes. We consider this as an excellent occasion for sales.
new face our #oilsellforecast hi all of my friends here is new face only for traders that they are late to jump in selling oil !!!
dont miss the position
follow us contact us for learning and teaching forex from us

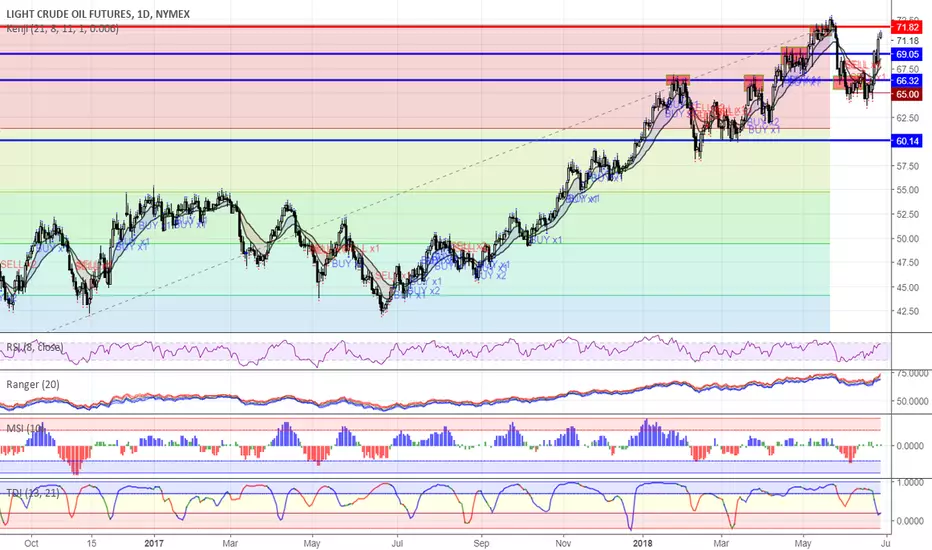
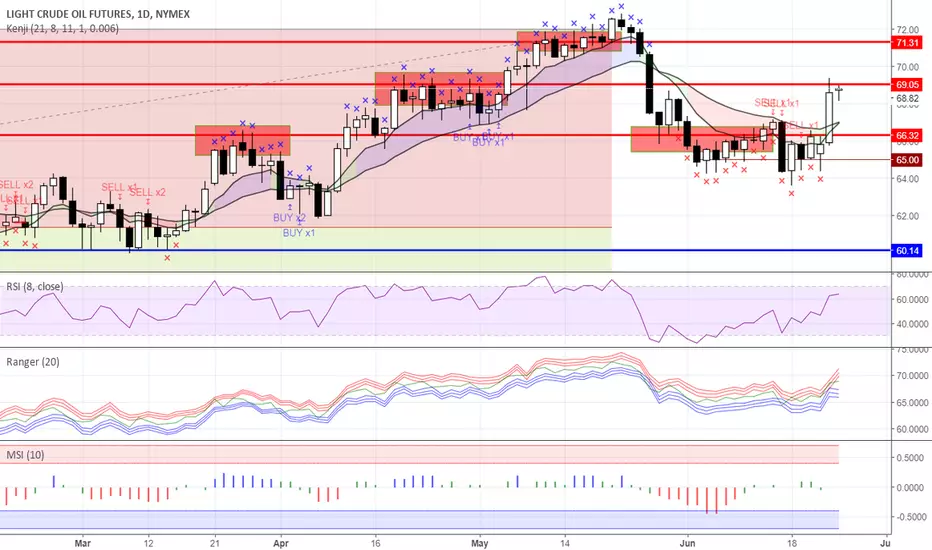
Kenji signals: sell oil Today, the indicator "Kenji" on the daily oil chart (WTI) generated a sell signal.
Let's give some explanations on this signal. This is the ordinary signal to open the trade with a basic volume.
According to the indicator, the price of oil is currently in the active downtrend phase (the area between the fast and slow average is colored red). At the same time, current prices entered the sales zone, which led to the formation of a "sell" signal. This short position remains relevant until either the market conditions change (for example, the downtrend changes to flat or uptrend), or a signal to close it appears (a red cross indicating a strong divergence between the price and average values).
Recall, work in a trend is one of the most comfortable and potentially successful trading options.
For reference:
The "Kenji" indicator is a brand new look at the average analysis. The main problem of most trading strategies and indicators based on the average analysis is a number of false signals in the case of flat and trend reverse (for example, frequent crossings of the averages, frequent changes in the direction of the averages, etc.). As a result, averages analysis cannot show its real power and effectiveness.
The Kenji indicator using a unique algorithm avoids the most common average analysis traps and significantly improves the quality of signals by determining the current state of the market (using the color indication "Kenji" shows the current state of the market: red color - downtrend, blue - uptrend, green - flat).
It generates signals for comfortable trading in a local trend. The indicator provides information on both the timing position opening and the moments of profit taking. It also helps to determine the level of aggressiveness of a signal. This makes the "Kenji" indicator a very useful tool both for novice and experienced traders.
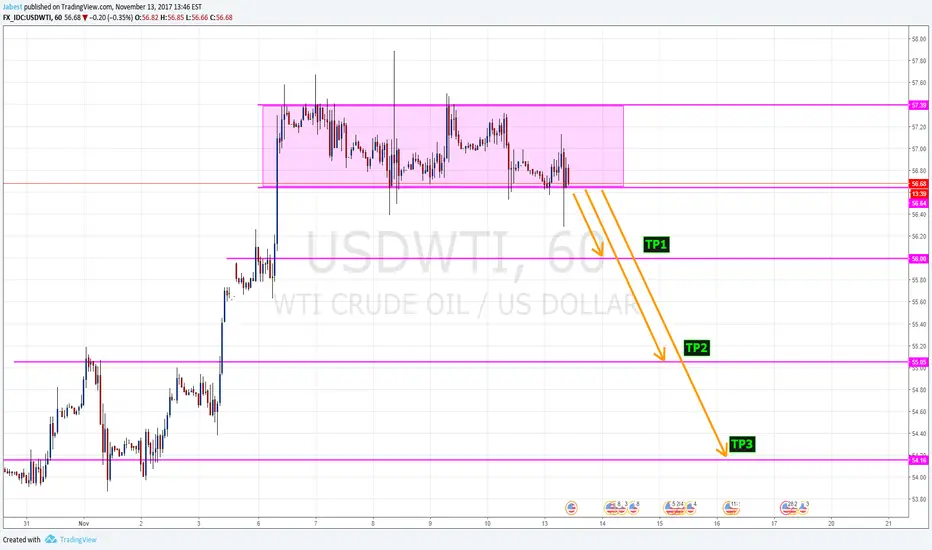
USDWTI Possible ShortI'm expecting a short here but either way, if it a 1 hour candle closes outside of the box I will enter a short. For best results, watch for it to close outside of the zone and then re-test the break.
Possible trend change longer term as well so you may be able to hold long term (Much longer than the three TP's.
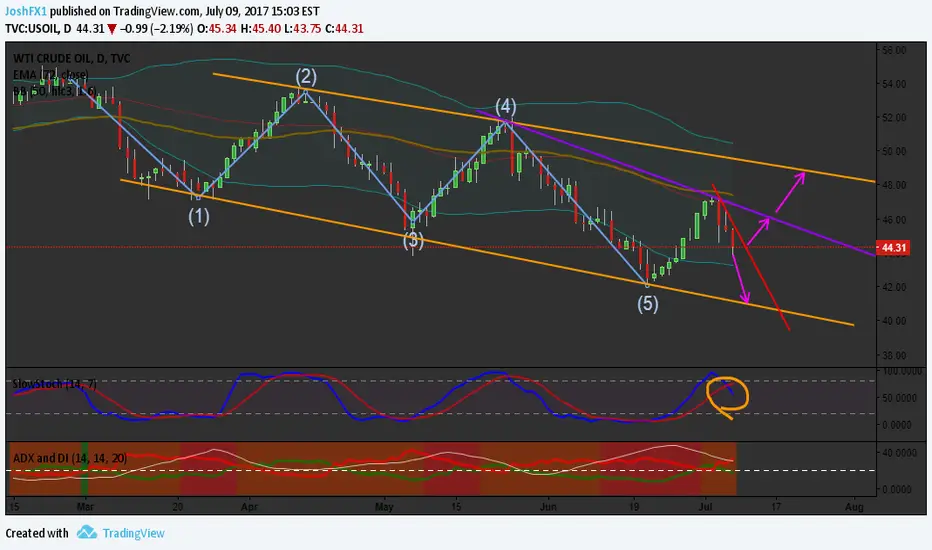
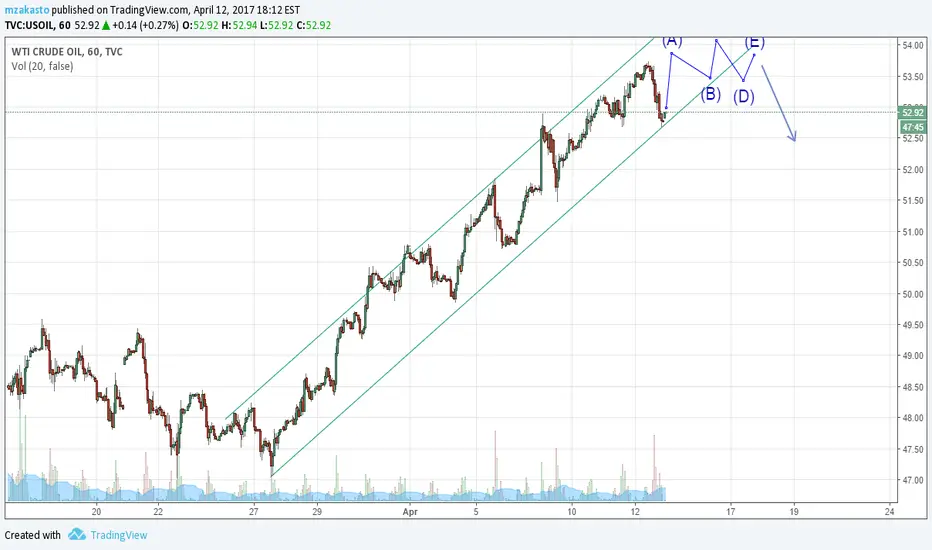
Oil Remains A SellThe daily time frame shows that oil is heading to the lower orange trend line again. Stoch indicator is also supporting this indicator thats its a clear sell. Oil is also still setting lower highs and lower lows.
However, oil has already completed the bearish 5 wave Elliot structure. This is usually followed by a by bullish wave structure and indeed we can see a green wave after the 5th bearish wave. this green wave could be the 1st wave of the bullish wave structure an are now in the 2nd wave which is down. How ever this 2nd wave cant break the start of wave 1 meaning that very soon price will reverse back up again into the 3rd wave. An easy way to find this out is the Red Trend Line. If the daily candle closes above the Red Trend Line its a buy with 1st target at the Purple Trend Line and 2nd target and the Red Trend Line.
Trading advice:
1. Sell with a stop a bit above the red trend line. Target is the orange lower range. (If stop gets hit and daily candle closes above the red line then switch to buying)
2. If you dont feel comfortable with selling then either wait with buying till price has hit the lower orange range or till the daily candle closes above the red trend line.
CRUDE OIL is about to drop soonAlthough this might take a bit long, but this is how it is likely to move according to my analysis.
UKoil 60min, doble/triple top, FLAT BEAR DVG, short.possibleUKoil 60min, doble/triple top, FLAT BEAR DVG, short-possibillity.
But wait for confirmation down, maybe under that red VWAP-line
If it break's up above $56, then I don't know, if this idea is that good any further....
So it could be smart to look for what those next candle's become, b.c. oil look bullish in this upmove.

OIL SHORT: Biggest scam of the year or technical consolidation?Dear shorts, I know most of us are extremely frustrated with the situation of OIL in the past (almost) 2 months. Whilst it should have retraced a long time ago, it can't seem to do so. In the early stages of this short trade, mostly technical indicators supported the idea whilst in the past ±4 weeks fundamental factors should cause oil to crash, since despite OPEC's pitiful attempt to cut production, the glut has grown. Yet, we see oil refusing to crash and moreover, we see oil skyrocketing on days where data is the worst. This makes no sense fundamentally and thus I was led to conclude that there are MM involved in this state in which oil is traded under. Still, before every major downturn for oil we see a period of consolidation ranging from 16d to 58d. The longer the consolidation the worst the movement downwards (statistically). Despite my frustration I have been averaging down my position every time I find an opportunity. The downturn should start soon and it will be ugly. All the pumpers will flee and oil should crash. Yet, there is a possibility that pumpers win since the divergence between Hedge Fund and retail traders positions are at a huge divergence. Thus, I will set my stop in the range of 55-55.35.

Oil sell advice on Strong Resistance Area Oil we can see on daily Charts its not holding above 54 level on daily we see selling pressures comes from that level.
So advice to sell in range of 53.35-54.4 sl above 54.2 TP 51-50

Still short this till the 40's.I ended up holding my short position today, still in the hunt for the 40's.
Bear divergence still there, RSI trending down towards oversold.
Oil seems to be bouncing in between the two light blue bars, watch for a strong break either way.
Pair this with my other ideas.

The stubborn hunt for the 40'sStill short from $54, have not sold or added to my position at all.
Blue line: $52 transition line, this line needs to be broken strong for us to head lower imo.
Red trend-lines: We've see an increase in prices, with declining RSI. This is a bear divergence.(whether or not it will play it is another story, yet I believe it will)
Orange line: This was a bull RSI trend-line witch has been broken as of late, and the RSI is beginning to look very bearish to me.
The flags are areas in which I am predicting that the RSI and price will hit. I am not adding or selling any of my position for the near future (obviously unless my SL at BE gets hit).
I will be expecting slight bounces based on some BS news from the middle east, or if we hit any support areas on the way down, however I will not be scared into selling something that easily looks bearish in my eyes.
The continued short of oil..So I didn't sell any of my $54 oil shorts today when it rebounded, I just moved my stop to break-even.
Today we saw a major miss in inventories, which was initially bearish, but was somehow bullish?
I'm still short because of the numerous reports that essentially the OPEC "cut" is garbage, and on top of that oil inventories are growing, while demand remains stalled.
There's still a bear divergence in the RSI, but we must carefully watch the $52 transition area (in blue), as a strong break above could signal a higher high.
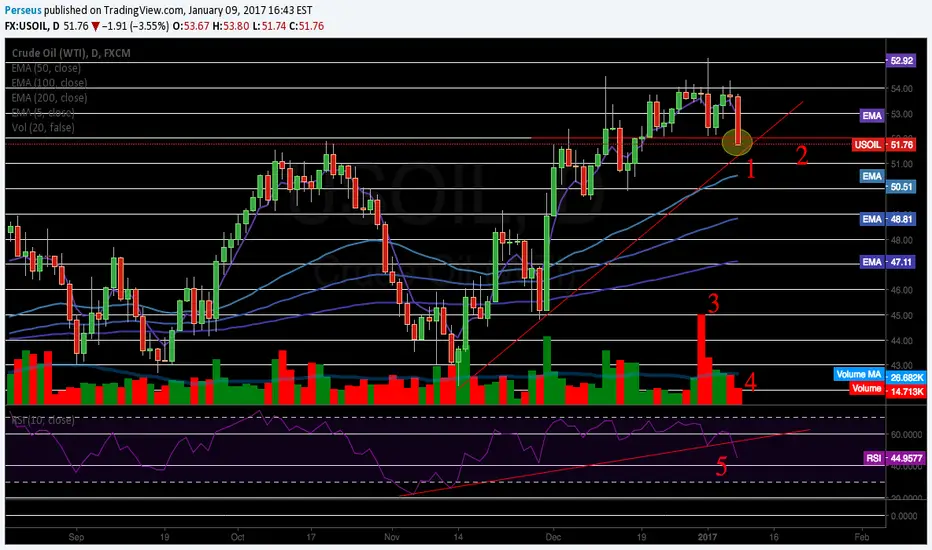
Short OilContinued idea from previous.
1 - The current trendline looks to be tested within the next few days, look for a bounce (long), or a break (add short).
2 - This red horizontal bar is around the $52 area (key transition area), it broke today, and closing below it over the next few days will be a good sign for shorts.
3 - Most big players got out December 30th, which points toward this level being a top for the time being.
4 - Today's drop was based on low volume, therefore we must be careful over the next few days. However, due to the large selling on December 20th, this may be all the volume necessary to truly break $52. Look for a weekly close below this level for a longer-term bear.
5 - RSI broke trend. This points towards an RSI heading towards oversold, with the price following.
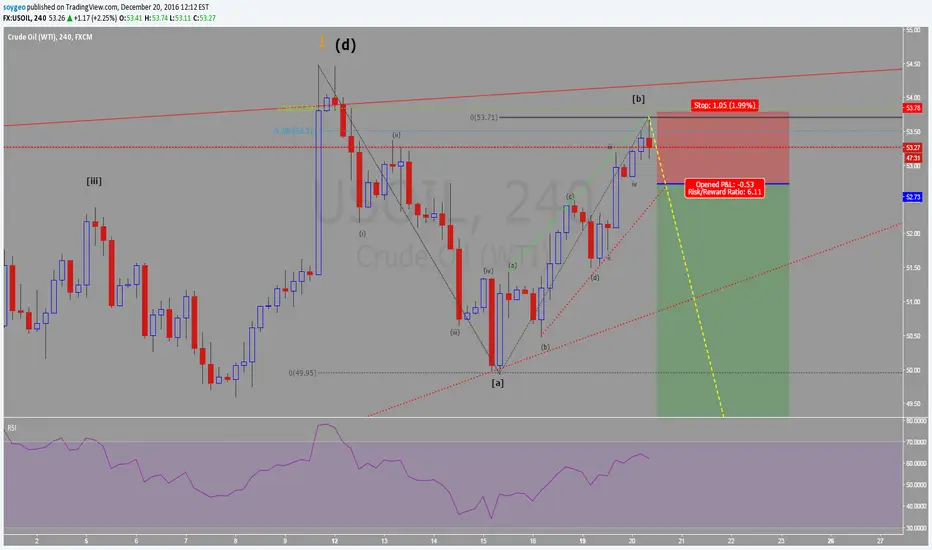
USOIL: second wave finished, Getting ready for a sell. Continuing with the idea published the last week. It may be starting the third wave (short) today. My recomendation: enter when the price breaks 52.74 and enjoy the sell!
Oil a Short #freedomHere we are seeing oil making a strong break from an important trend line and now doing an important retest of the trend line increases the possibility to go short.
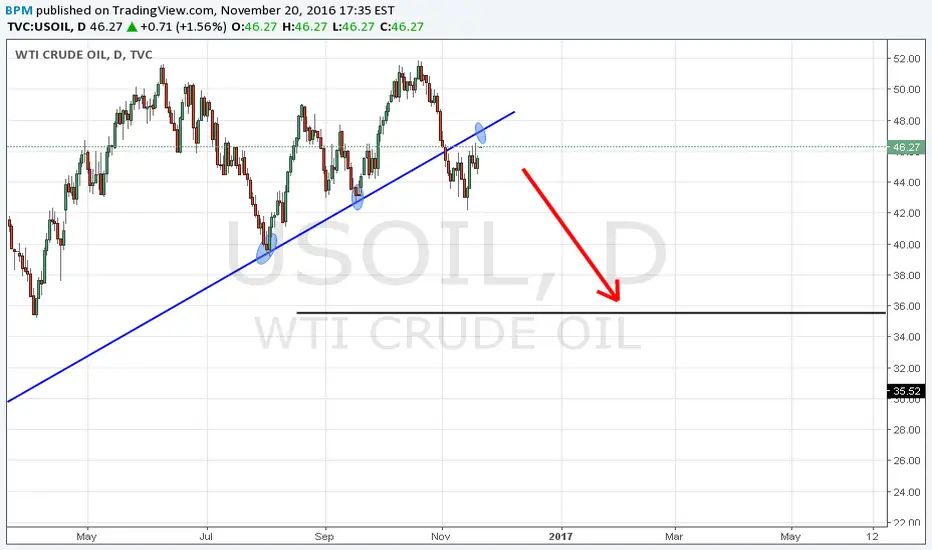
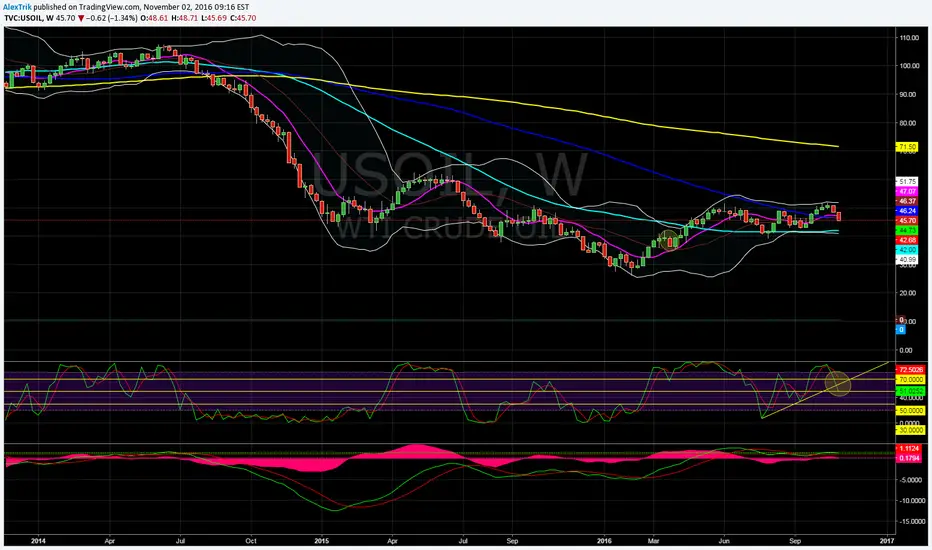
$40 OilIn accordance to my previous idea, my sentiment on oil today and for the following days is bearish. On the weekly chart, oil looks to have a lot of room for downside with the MACD flat, just barely crossing over and the STOCHS signaling a reversal. I think if this pattern completes we should see $40 oil within the next 2 weeks. This of course should be helped by bad data, which some analysts expect. For today (02/11/2016) I might exit my short if data comes out very bullish and later re-enter. Keep in mind the elections as well, which could boost oil if Clinton wins.
UPDATE: Oops, I made a mistakeI would like to apologize for my previous analysis on oil. Whilst the idea was correct, I falsly planted the fib retracement a nd got wrong levels. Apparantly, the new pivot point is at $46.1. Thus I changed my target to that. Other than the wrong levels, you can read "Oil hates uncertainty" for more information on the trade.

Oil hates uncertainty1 month ago today, OPEC unofficially decided that they would cut production by 32.5-33m br/day. That announcement sent oil into gains frenzy skyrocketing it to almost $52/barrel. That unofficial statement was not enough to make oil break the resistance and reach the expected price of $60/barrel. Now during the OPEC and non-OPEC members meeting in Vienna in Friday and Saturday things took a very different turn than hoped. Starting with the OPEC meeting on Friday, the members failed to come to a conclusion and cut production with the biggest opposer being Iraq. Saturday, leaks hint towards a non-conclusive meeting as well. This leads me to expect further movement south for oil over the next weekend. TP for me is $47. Still, I think no production cut could mean that oil tumbles more and thus I will be trading oil over the next month until their next meeting ONLY if it manages to break below the $47-46.8 area with relatively high volume and if indicators favour a short play.