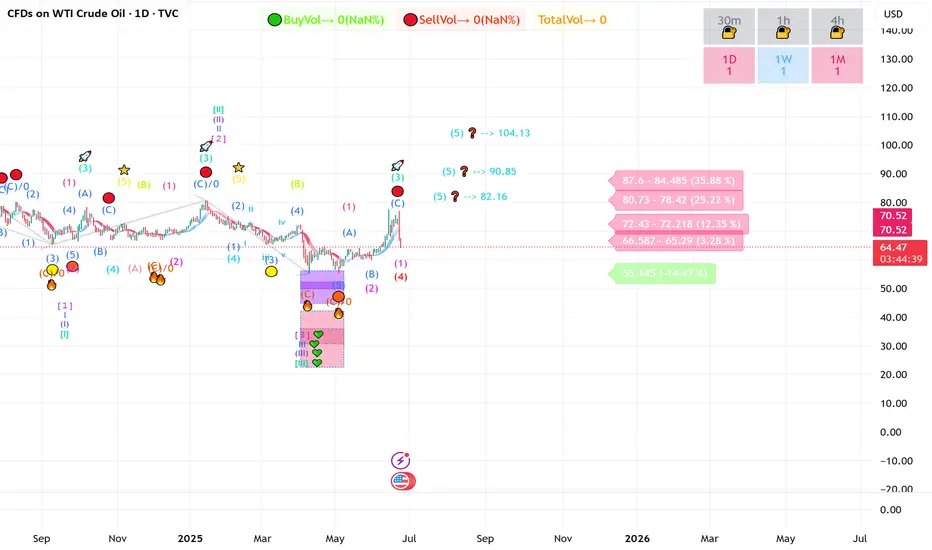
WTI Crude Oil Breaks Out of Symmetrical Triangle, $73-$76 ZoneThe WTI Crude Oil chart shows a strong breakout from the symmetrical triangle pattern that was forming for several weeks. Price has decisively broken above the descending resistance trendline and is now testing the $70–$71 area, which aligns with the 0.382 Fibonacci retracement level (around $70.27) and an important horizontal resistance ($71.03). This breakout indicates strong bullish momentum, supported by the recent series of higher lows and a sharp upward move in recent sessions.
If price sustains above $69.05 (previous breakout zone), we could see a bullish continuation towards $73.40 (0.118 Fibonacci) and potentially to $76.00–$76.50, which is the upper resistance block marked on the chart. However, if the price fails to hold above $69.00, there could be a pullback to retest the broken triangle resistance around $67–$68 before any next bullish leg.
Weekly Chart
The weekly chart of WTI Crude Oil is showing a long-term downtrend channel, where price has been consistently making lower highs and lower lows since mid-2023. Currently, oil is trading around $69.96, showing a sharp bullish push of 6.13% for the week. However, the price is still inside the broader descending channel, which keeps the long-term trend bearish unless a confirmed breakout occurs.
Key Resistance Levels:
- $70.27, $71.03, $73.43
Support Levels:
- $69.05 (previous breakout zone)
- $67.00–$68.00 (triangle retest area)
Trend Outlook:
- Short-Term: Bullish momentum; pullbacks likely to hold above $69.05.
- Medium-Term: If $71.85 breaks, price may target $76.00–$76.50 resistance.
Note
Please risk management in trading is a Key so use your money accordingly. If you like the idea then please like and boost. Thank you and Good Luck!
Oiltrading
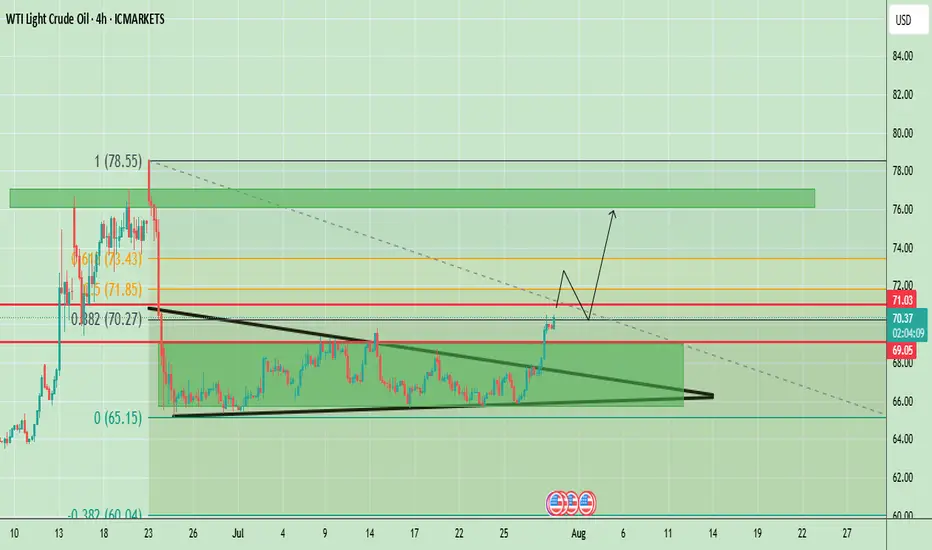
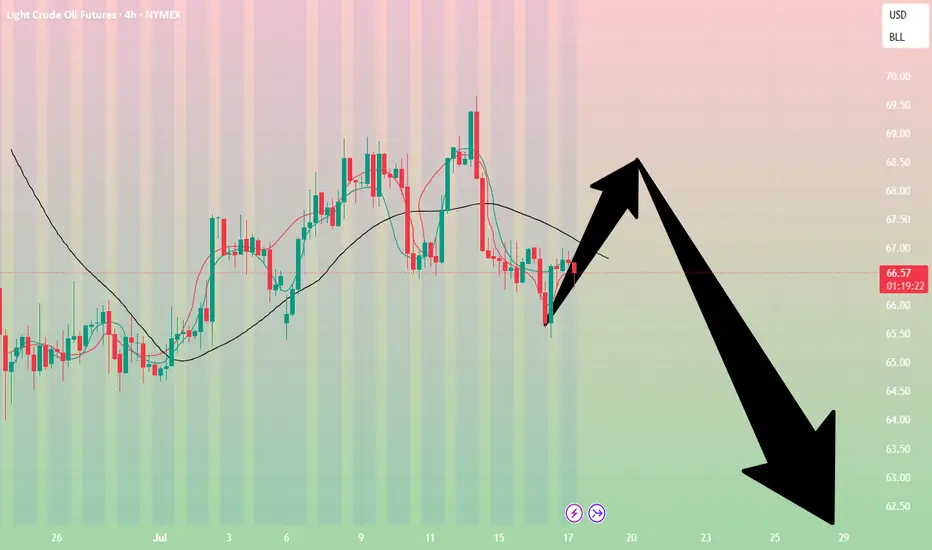
Oil Prices Form Bearish Head & Shoulders – Key Neckline in FocusWTI crude oil is showing a clear Head and Shoulders (H&S) pattern, which is a strong bearish reversal signal. The left shoulder formed in early July, followed by a higher peak forming the head in mid-July, and finally the right shoulder near the current levels, which is lower than the head. The neckline is positioned around $66.00, acting as a key support level. Currently, the price is trading at $67.34, hovering slightly above this neckline, indicating that the market is at a critical decision point. A confirmed break below the neckline could accelerate bearish momentum, targeting the $62.20 – $62.80 zone based on the pattern’s measured move. However, if the neckline holds, a possible bounce toward $68.50 – $69.00 could occur, but overall bias remains bearish unless the price can break and sustain above $69.00.
Key Price Levels:
- Resistance: $68.50 – $69.00
- Neckline Support: $66.00
- Bearish Target (if confirmed): $62.20 – $62.80
Note
Please risk management in trading is a Key so use your money accordingly. If you like the idea then please like and boost. Thank you and Good Luck!
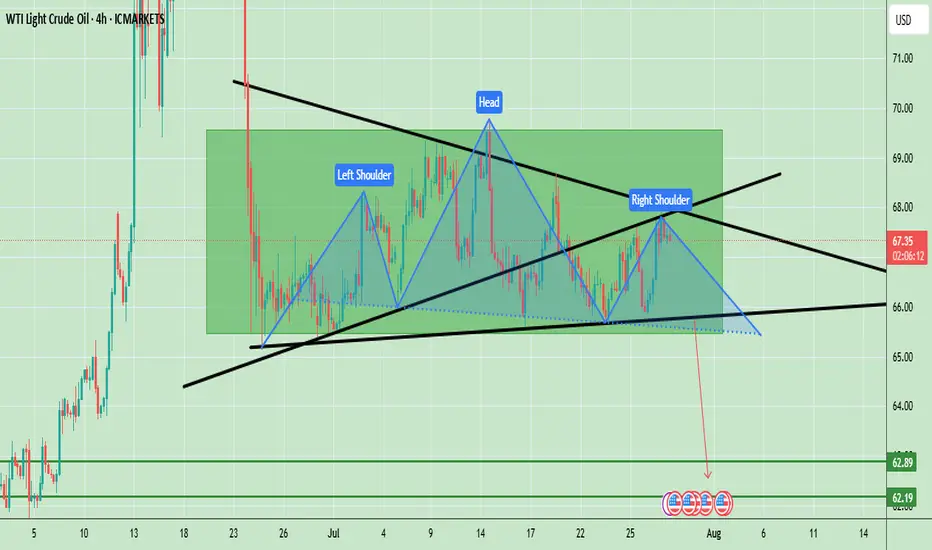
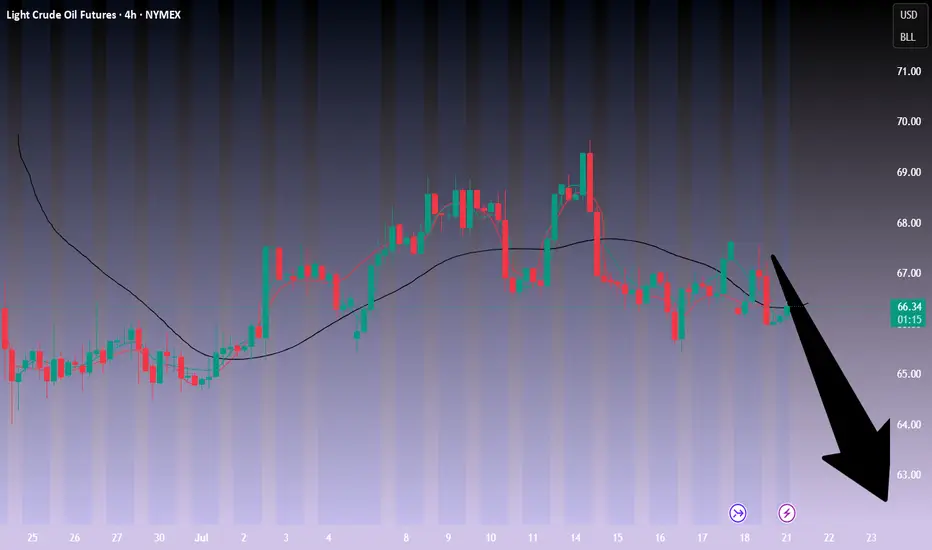
Crude oil: Sell around 70.20, target 65.00-64.00Crude Oil Market Analysis:
Yesterday's crude oil market was very strong, with buying driving the market higher. The daily chart ultimately closed with a clear bullish candlestick. Buying on the daily chart is testing the resistance level between 70.00 and 70.60. After two consecutive days of bullish closes, and with clear bullish candlesticks, I predict another surge today. Let's look at the daily chart. The daily chart shows a significant rebound after a significant drop. Today, focus on selling opportunities between 70.00 and 70.60. A break of this level will change the overall selling trend. The strategy remains to sell high and be bearish.
Fundamental Analysis:
Today, focus on the ADP employment data and the EIA crude oil inventory data. The key news will be the interest rate results during the US trading session, along with speeches.
Trading Recommendations:
Crude oil: Sell around 70.20, target 65.00-64.00
Oil Market Sentiment Shifts After Trump’s Urgent Warning, but...On June 23, 2025, at 9:35 AM, President Donald J. Trump issued a stark warning via social media:
"EVERYONE, KEEP OIL PRICES DOWN. I’M WATCHING! YOU’RE PLAYING RIGHT INTO THE HANDS OF THE ENEMY. DON’T DO IT!"
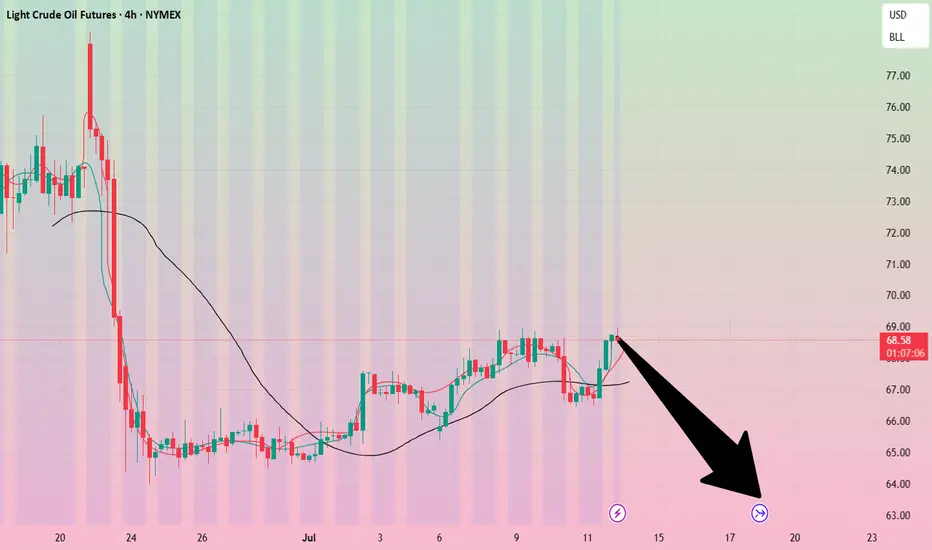
Since his post, oil prices experienced a notable bullish impulse. From both fundamental and technical perspectives, the market is now approaching a 16-hour supply zone, which could serve as a potential resistance area.
Additionally, I’ve observed a divergence in trader positioning: non-commercial traders increased their short positions significantly last week, while retail traders remain long. This divergence between price action and non-commercial positions suggests a possible shift in momentum, and I am currently eyeing a short setup.
As always, I encourage traders to conduct their own analysis. The trader featured below operates on the D1 timeframe and focuses on scalping, which can be useful for short-term entries.
Stay cautious and keep an eye on how the market reacts near the identified supply zone.
✅ Please share your thoughts about CL1! in the comments section below and HIT LIKE if you appreciate my analysis. Don't forget to FOLLOW ME; you will help us a lot with this small contribution.

Crude oil-----sell near 67.50, target 65.00-64.00Crude oil market analysis:
The idea of crude oil today is still bearish. Xiaoyang predicts that it will rebound first and then continue to fall. Consider selling near 67.50 if it rebounds. Crude oil is basically weak if it does not stand above 70.00. Crude oil is a repair market after a big drop. In theory, it will continue to fall after the repair. In addition, pay attention to crude oil inventory data later.
Operation suggestions:
Crude oil-----sell near 67.50, target 65.00-64.00

Crude oil-----sell near 67.00, target 65.00-63.00Crude oil market direction:
The recent daily crude oil line has been hovering, and it feels like it is falling or not falling. The daily crude oil line is still bearish. Let's continue to sell it on the rebound. For crude oil today, we focus on the suppression of 67.00. Consider selling it at this rebound position. The daily crude oil line needs to break the 64.00 position to see real selling force, otherwise it is a repair shock with a very small amplitude.
Fundamental analysis:
The latest news is that the United States and the European Union have reached a 15% tariff agreement, which overall supports the US dollar and suppresses gold. In addition, this week, pay attention to ADP employment data, non-agricultural employment data, and the Federal Reserve's interest rate decision and speech.
Operation suggestions:
Crude oil-----sell near 67.00, target 65.00-63.00

Crude oil market analysis: Crude oil has not moved much, but it Crude oil market analysis:
Crude oil has not moved much, but it is a good short-term operation opportunity. Sell small when it rebounds, sell big when it rebounds. Crude oil will basically not trap you. It is difficult to end the selling in the short term. It will basically decline in the future. You can sell when it rebounds near 67.00 today. If it breaks 64.00, it will directly dive. The daily line of crude oil has formed a shock pattern. You can sell at the break position of 64.00.
Operation suggestions:
Crude oil---sell near 67.00, target 65.00-63.00

Crude oil ----- Sell near 67.50, target 65.00-63.00Crude oil market analysis:
Crude oil has been falling recently, but the decline is not large, and the rebound will not be large. Consider selling crude oil if it rebounds slightly. The crude oil idea is bearish. It is difficult for crude oil to rise sharply without fundamentals, but we insist on taking losses in operation. If there is no loss, a piece of news will make it take off directly. Crude oil focuses on 64.00 support, and suppresses 67.50 and 69.50. Consider selling opportunities when the Asian session rebounds to 67.50.
Fundamental analysis:
Tariffs have not affected the market recently, and no major news has been announced. The market is relatively calm.
Operational suggestions:
Crude oil ----- Sell near 67.50, target 65.00-63.00

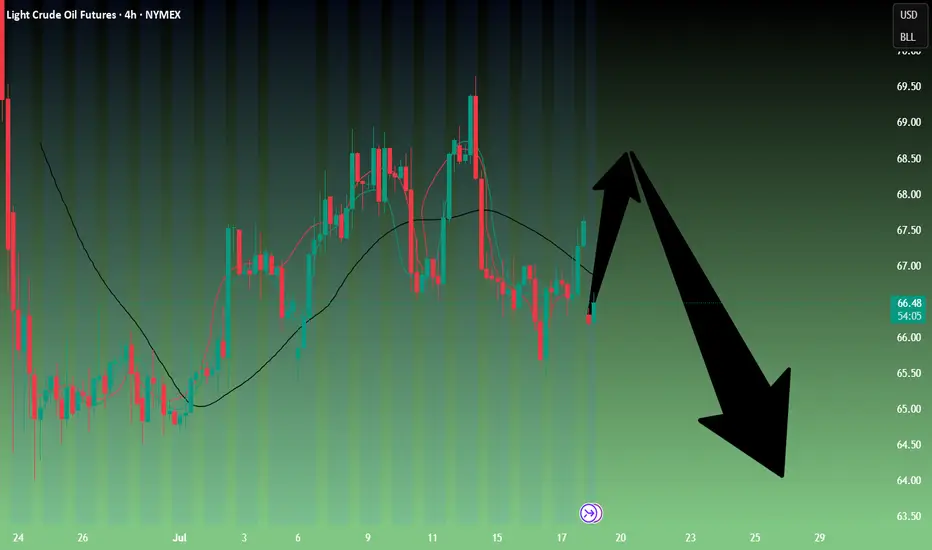
Crude oil-----sell near 66.00, target 65.00-63.00Crude oil market analysis:
The recent daily crude oil line has been fluctuating slightly. It is still bearish to sell at a high price. Crude oil is unlikely to rebound or rise sharply without fundamental support. The hourly crude oil suppression position is 66.40 and 67.50. Today we are close to 66.00 to consider selling opportunities. The daily moving average of crude oil is starting to go down. If 64.00 is broken, it will start to fall sharply.
Operational suggestions
Crude oil-----sell near 66.00, target 65.00-63.00
Crude oil-----sell near 67.50, target 65.00-63.00Crude oil market analysis:
Crude oil has started a new contract. The new contract is still not moving much at present, and the contract spread is not much. The daily line has begun to decline. Today's idea is to sell at a rebound of 67.50. The suppression position is 67.50 and 69.00, and the support is around 64.00. If this position is broken, there will be a greater room for decline.
Fundamental analysis:
There is no major news in the recent fundamentals. The situation in the Middle East is still relatively stable. There is no new rest on tariffs, and the impact on the market is limited.
Operational suggestions:
Crude oil-----sell near 67.50, target 65.00-63.00
Crude oil------sell near 68.80, target 66.00-62.00Crude oil market analysis:
Recent crude oil is actually very easy to operate. Sell when it rebounds to a high position. Don't worry about the position. In addition, the daily K-line has also begun to decline, and it is difficult to form a large rebound. The new daily moving average begins to sort. If there is no fundamental support in the future, crude oil has a lot of room to fall, and it will fall below 58 in the future. Sell it when it rebounds to around 68.80 today.
Fundamental analysis:
Today is a holiday in Tokyo, Japan. In addition, there is no major data this week. We focus on the fundamentals. Trump's tariffs are still a focus.
Operational suggestions:
Crude oil------sell near 68.80, target 66.00-62.00
Crude oil---sell near 67.50, target 65.00-60.00Crude oil market analysis:
Crude oil has also started to fluctuate recently. Pay attention to the impact of contract delivery on the trend of crude oil. The daily line of crude oil does not show the strength of its rebound. In terms of operation, it is still a rebound sell. Crude oil continues to be bearish. The situation in the Middle East has not made any major moves temporarily, and the support for crude oil is limited. Pay attention to the selling opportunities near 67.30 today.
Operational suggestions:
Crude oil---sell near 67.50, target 65.00-60.00
Crude oil-----Sell near 66.80, target 65.00-62.00Crude oil market analysis:
The recent crude oil daily line began to decline, but a small V appeared last night, which was also caused by the situation in the Middle East. Israel bombed Syria and crude oil began to rebound. Overall, crude oil is still bearish. We consider continuing to sell it when it rebounds. It has not broken near 64.00, and it is difficult to form a large unilateral. The suppression position is near 66.80. Consider selling it near it.
Fundamental analysis:
Trump’s dissatisfaction with Powell has not been a day or two. Conflict is inevitable, and the impact on gold is also short-term. Yesterday’s pull-up and dive is a case in point.
Operational suggestions
Crude oil-----Sell near 66.80, target 65.00-62.00
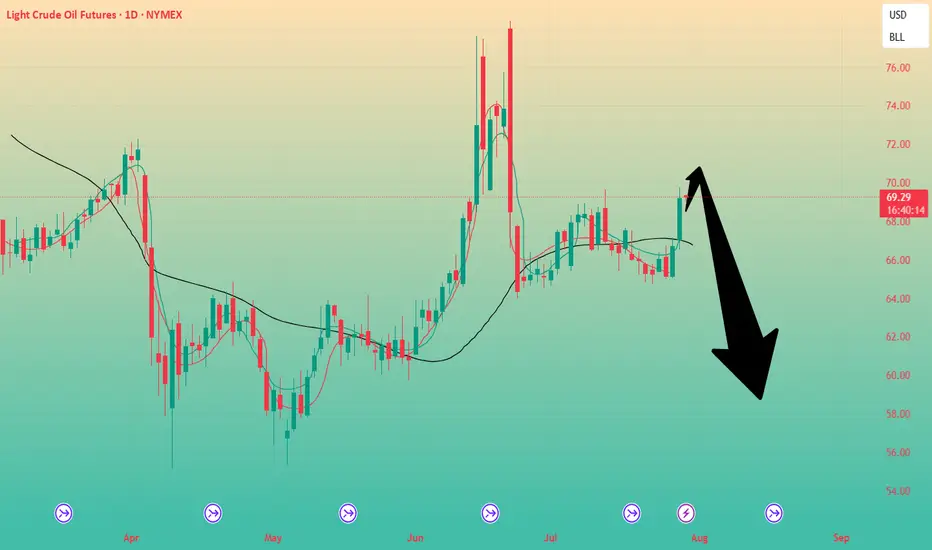
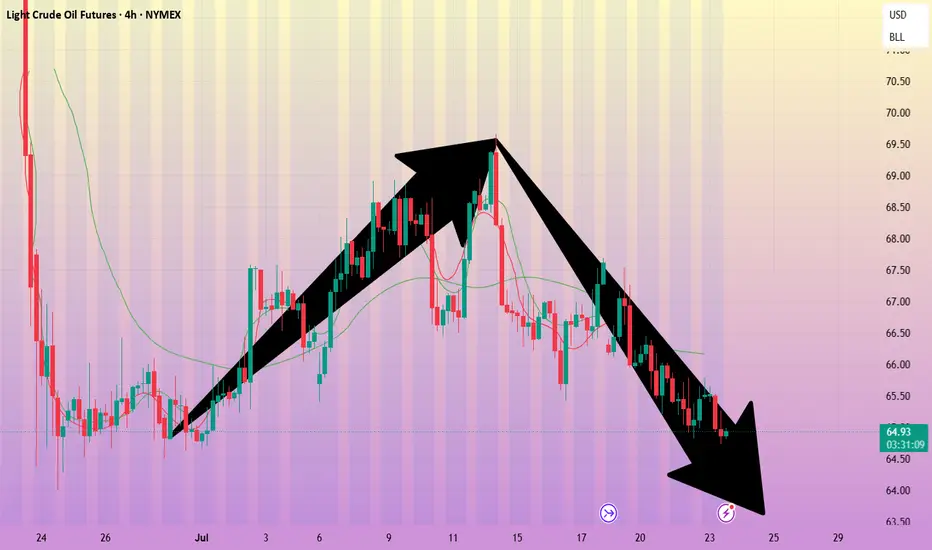
Could OIL Slide to $60? a 5% Drop Might Be on the Table? Hey Realistic Traders!
Price action is weakening. Will USOIL find support or slide further?
Let’s Break It Down..
On the 4H timeframe, oil has formed a double top pattern followed by a neckline breakout, which is a classic sign of a potential shift from a bullish to a bearish trend.
This breakout was confirmed by a break below the bullish trendline, accompanied by consecutive bearish full-body candlesticks that reinforce the bearish momentum. Afterward, the price formed a bearish continuation pattern known as a rising wedge, which was followed by a breakdown.
The combination of bearish reversal and continuation pattern breakouts signals further downside movement and confirms the shift into a bearish trend.
Therefore, we foresee the price forming lower lows and lower highs toward the first target at 63.21, with a potential extension to the close the gap at 60.73.
The bearish outlook remains valid as long as the price stays below the key stop-loss level at 69.66.
Support the channel by engaging with the content, using the rocket button, and sharing your opinions in the comments below.
Disclaimer: This analysis is for educational purposes only and should not be considered a recommendation to take a long or short position on USOIL.

Crude oil------sell near 70.00, target 66.70-63.00Crude oil market analysis:
Recently, crude oil has been rising, and buying is slowly climbing, but the amplitude is not particularly large. The daily line has not formed a large buying pattern. It is currently a technical repair market after falling too much. Today's idea is to sell on the rebound. Pay attention to the suppression near 70.00. If this position is broken, it may change the short-term trend and buying may rise.
Fundamental analysis:
Last week, Trump increased tariffs on Canada and is about to increase tariffs on Brazil. There is no sign of stopping the tariff war. It is long-term bullish for gold. The situation in the Middle East has not completely stopped, and it is also long-term suppression of the US dollar to support gold.
Operation suggestions:
Crude oil------sell near 70.00, target 66.70-63.00
WTI Oil – From Conflict to StrategyBack on April 24, I marked a short zone. On June 11, price broke above that level, giving a long opportunity — which I took.
Unfortunately, it coincided with the tragic military strike by Israel on Iran, pushing oil sharply higher. I’ve pinned that analysis.
Following the ceasefire, price dropped again — just a reminder that geopolitics can shake the charts.
As traders, we stay prepared to act, even while acknowledging the deep sadness of lives lost.
Now I wait for price to reach my marked level again. If I get a valid signal, I’ll short.
But if price breaks and holds above, I’ll buy the pullback — with no bias, just pure execution.
Risk-managed. Emotion-neutral. Opportunity-focused.
WTI Crude Oil: Double Engulf + H&S Breakdown Points to $40Hello guys! Let's dive into WTI!
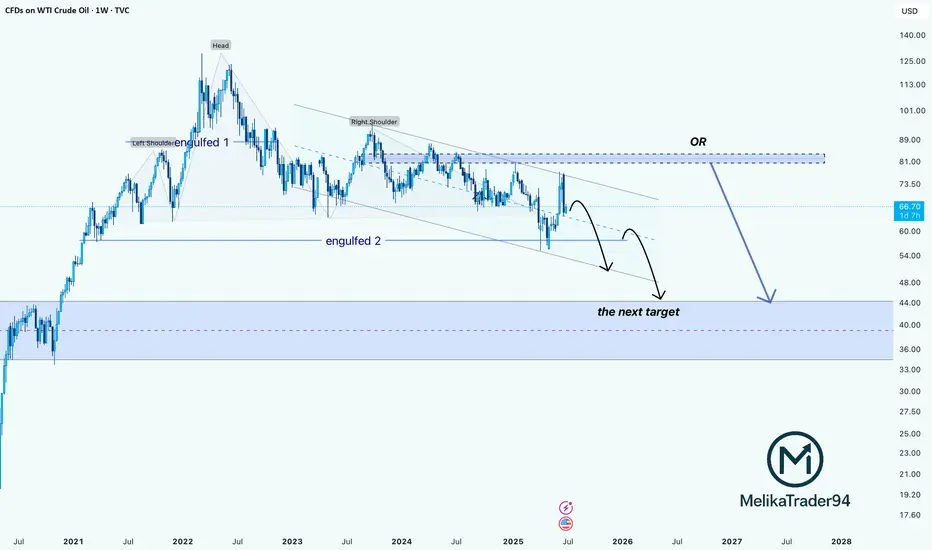
The weekly chart of WTI Crude Oil reveals a bearish Head & Shoulders pattern playing out over a long-term descending channel. Price recently got rejected from the upper trendline, showing weakness despite a short-term bounce.
- Engulfed 1 & 2:
Two major engulfing zones failed to hold as support, turning into strong resistance.
- Bearish Scenario in Play:
After the recent upside move into resistance, price is likely to follow one of two paths:
- Continuation Within the Channel:
Rejection from the upper bound of the descending channel leads to a stair-step decline toward the $47–52 zone.
- Final Rejection from Supply Zone ($83–89):
A larger corrective push could test this area before a full collapse toward the long-term demand zone.
Main Target:
The blue shaded region ($36–47) stands out as a strong long-term demand zone, where buyers may finally step in.
____________________
Invalidation point:
Unless crude oil breaks above the $89 zone with strong volume, all signs point to further downside.
The chart structure favors a slow bleed with temporary bounces, ultimately targeting the $40s.
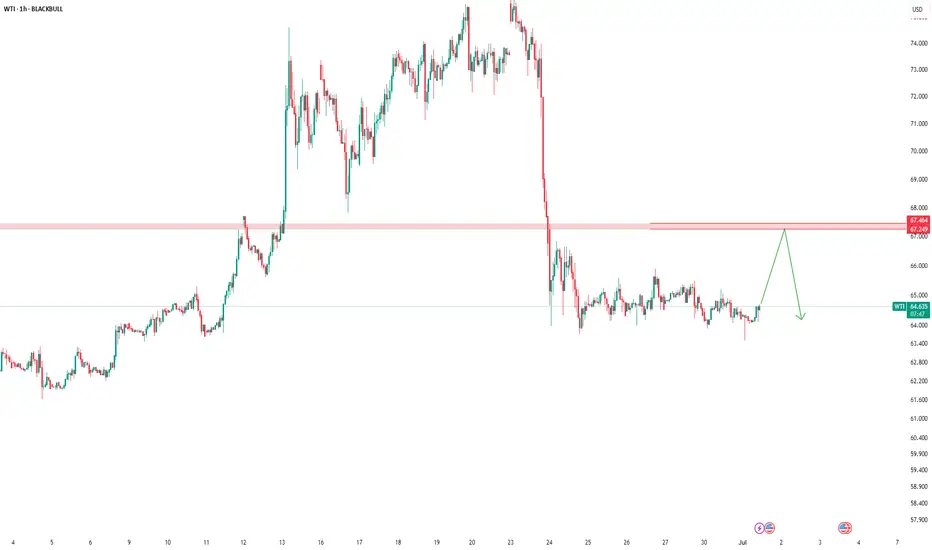
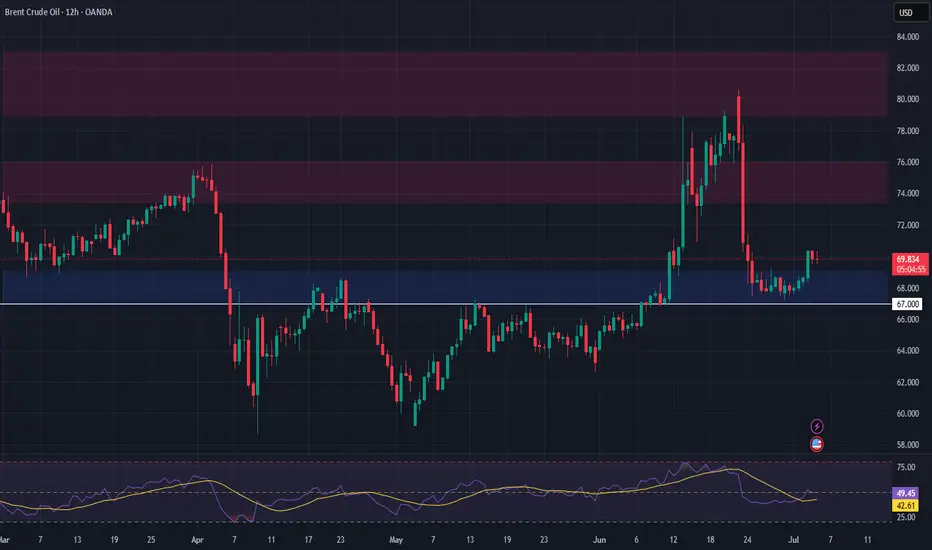
Brent Crude Oil Long Swing Setup – Support Break at Key LevelBrent Crude Oil OANDA:BCOUSD has broken to the next key support level after a cease-fire announcement in the Middle East. A long position is considered only if support holds at $69.00.
📌 Trade Setup:
• Entry Zone: $69.00
• Take Profit Targets:
🥇 $73.50 – $76.00
🥈 $79.00 – $83.00
• Stop Loss: Daily close below $67.00
#BrentCrude #OilTrading #ForexTrading #LongPosition #SupportLevel #TradeSetup #CrudeOil #MarketAnalysis #TradingOpportunities #Commodities #OilMarket #Investing #PriceAction #OilPrices #TradingStrategy #ForexCommunity #InvestmentOpportunities #MarketUpdate
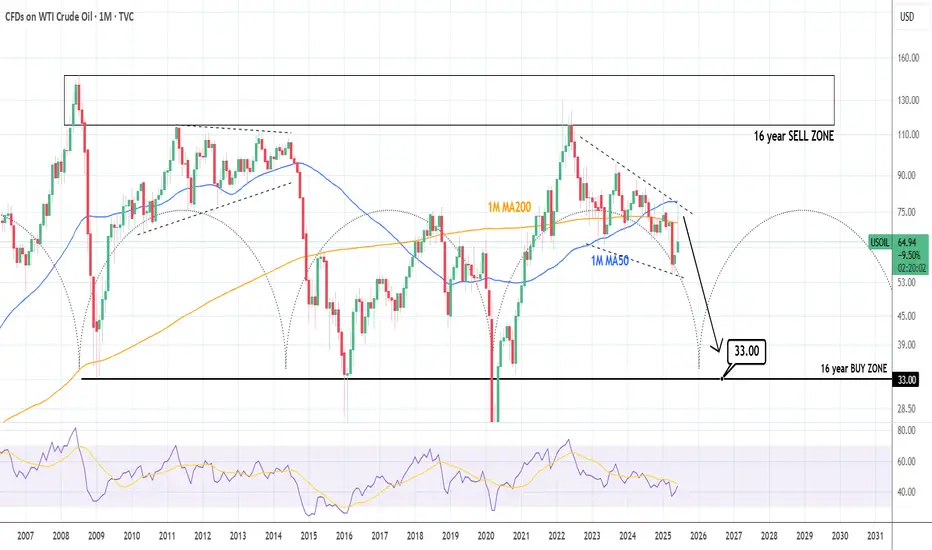
WTI CRUDE OIL: Brutal collapse expectedWTI Crude Oil has turned bearish again on its 1D technical outlook (RSI = 44.990, MACD = 0.310, ADX = 38.289) and is expected to accelerate the effect as based on the 16 year Cycles, late 2025 and most of 2026 should experience a price collapse. The most optimal Buy Zone starts at $33.00, it could go lower but that's a solid base from which to expect a bounce back above $110.00 by 2028.
## If you like our free content follow our profile to get more daily ideas. ##
## Comments and likes are greatly appreciated. ##
USOIL HEIST ALERT: Thief Entry Loaded – Target Locked!🚨 The Ultimate US OIL / WTI Heist Plan – Thief Trading Style 🎯💸
Hey Money Makers, Hustlers, Market Bandits! 🌍
Hola, Ola, Bonjour, Hallo, Marhaba! 👋🌟
We’re back with a slick WTI energy market heist based on our 🔥Thief Trading Style🔥—powered by a mix of technical & fundamental strategies. The vault is wide open and the bullish loot awaits!
🗺️ Strategy Brief:
We’re aiming for a clean bullish getaway near the high-risk MA zone—where traps are set and bearish robbers lurk. Watch out for overbought zones, trend reversals, and consolidation ambushes.
📈 Entry Point:
“The vault is open! Enter the bullish heist at will.”
Look to place Buy Limit Orders around swing highs/lows or pullback levels on the 15m–30m timeframe.
🛑 Stop Loss:
Set your Thief SL around the recent swing low using the 3H timeframe (example: 60.300).
Adjust based on your risk appetite, lot size, and number of entries.
🎯 Target: 65.200
That's where we celebrate the score, traders! 🥂💸
📊 Heist Justification (Fundamentals + Sentiment):
The WTI market is currently bullish, fueled by a mix of:
✅ Macro economics
✅ COT data
✅ Seasonal trends
✅ Intermarket signals
✅ Inventory & storage dynamics
📌 For full analysis and future target breakdowns, check the linkk in our profilee 🔗👀
⚠️ Important Alert – Manage Your Risk During News:
🚫 Avoid fresh entries during major news releases
✅ Use trailing stops to protect running gains
Stay sharp, stay safe.
💥 Hit the Boost Button if you support the Thief Strategy!
Join the crew, ride the wave, and let’s rob the market like pros 💼🕶️💰
📅 Stay tuned for the next master plan. Another heist is always around the corner.
Until then – steal smart, win big! 🐱👤🔥

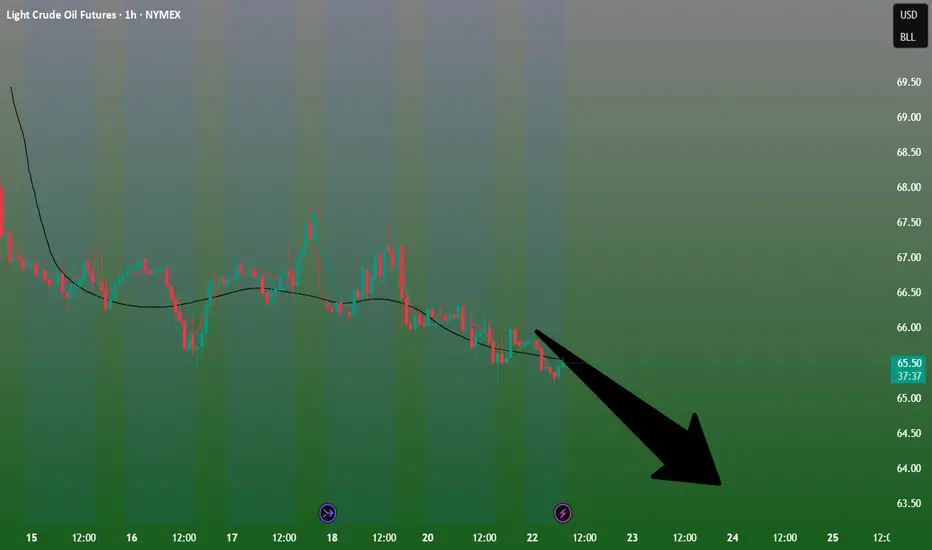
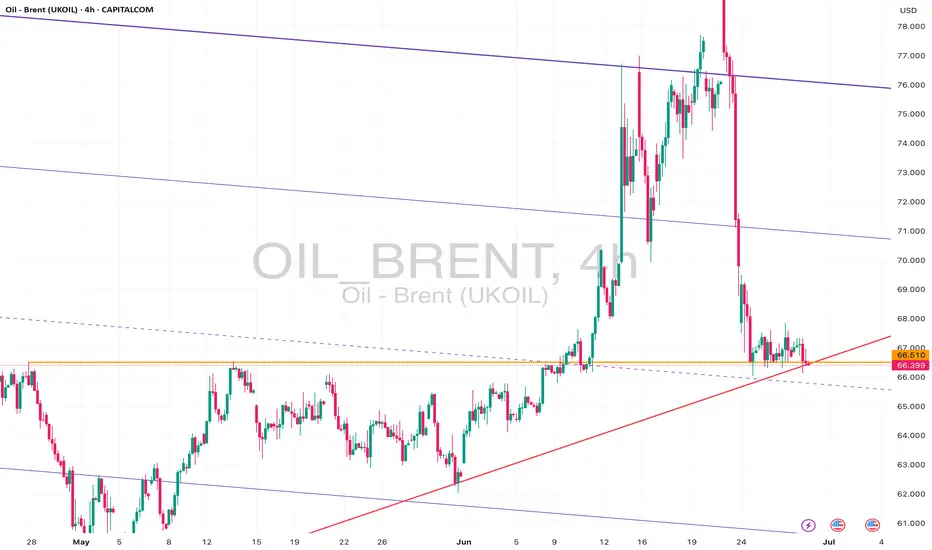
Brent Oil – Bearish Break or Bounce from Long-Term Support?Brent Oil is hovering just above critical support near 66.00, with a clear bearish structure visible across timeframes:
🔎 15m & 1h:
Price action is consolidating near the ascending support trendline drawn from early June lows. Short-term price structure shows lower highs and lower lows, suggesting continued downside pressure.
📉 4h & 1D:
The recent sell-off from above 78.00 has pushed Brent back into the lower region of the broad descending channel. Daily and 4h charts show price testing confluence between the horizontal support at ~66.00 and a long-term rising trendline. A confirmed close below this level could accelerate bearish momentum towards 64.00 or even 62.00.
⚠️ Key Levels:
• Support: 66.00, 64.00, 62.00
• Resistance: 67.00, 69.00
• Bias: Bearish – price remains in a clear downtrend unless buyers reclaim above 67.50 with strong volume.
📌 Outlook:
As long as Brent holds below 67.00 and the descending trendline caps rallies, my bias is bearish. A breakdown of 66.00 on higher timeframes would open the door for a move towards lower channel support levels. However, if buyers defend and push back above 67.50, we could see a short-term relief rally.
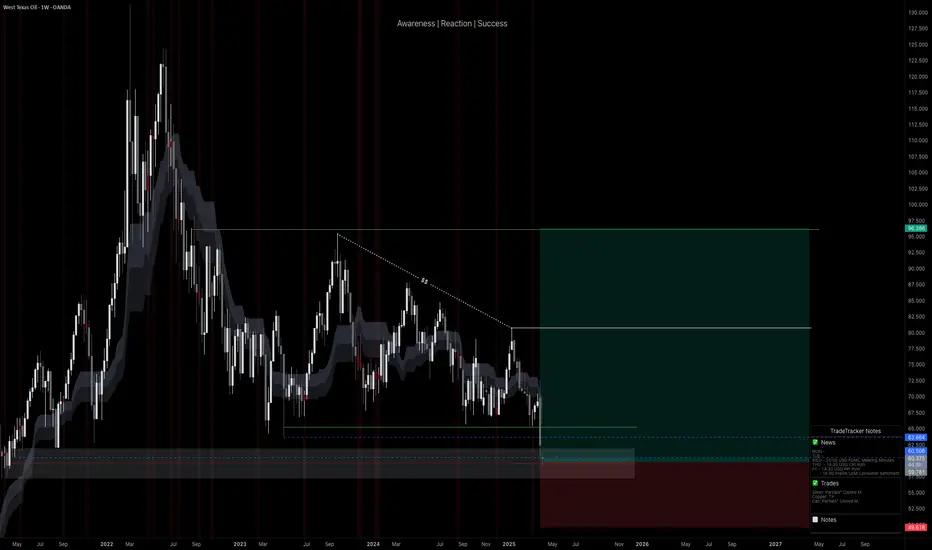
Tariff Panic = Opportunity | WTI Long SetupWTI Oil has finally dipped into my long-watched buy zone, driven by macro fear and an aggressive tariff agenda. The current drop aligned perfectly with my long-term execution plan. I’ve placed this trade based on key historical demand levels with my stop-loss and take-profit clearly defined. I’m prepared for deeper drawdown, but this area remains high-conviction for me. Execution > Prediction.
Technicals:
• Key Level: Price tapped into a major demand zone dating back to 2021 lows, which had been protected ever since.
• Liquidity Sweep: This drop mitigated every low formed post-2021 — clearing out late longs and stop hunts.
• Trendline Break Anticipation: I expect a potential trendline breakout from the long-term descending structure.
• SL/TP Defined: This trade has structure. It’s not a hope-based setup, it’s pre-planned and managed.
• Consolidation + Accumulation: This is where strong hands prepare, and I’m joining in.
Fundamentals:
• Tight supply, rising global demand, and structural underinvestment in oil exploration.
• Chinese reopening + Russian ban tighten market availability.
• Central banks expected to support demand via easing cycles.
• Oil Bearish Catalyst (Short-Term):
• US tariff wave: Trump announced a total 54% tariff on China and baseline tariffs on all trading partners.
• Escalating fears of global economic slowdown pushed prices to $58.80, a 4-year low.
The bearish panic gave bulls like us a gift. This is how real trades are born - not in euphoria, but in blood.
Note: Please remember to adjust this trade idea according to your individual trading conditions, including position size, broker-specific price variations, and any relevant external factors. Every trader’s situation is unique, so it’s crucial to tailor your approach to your own risk tolerance and market environment.
CRUDE set to fire 82 $ 90 $ 104 $ ????Crude Daily Elliot waves count suggest big UP setup in progress right now
55 $ key level to watch for buyer Extension point
Due to amid middle-east war situation may trigger Up move impulse wave towards 82 $ to 104 $ range
EW count are keeping changing during different price action in different time frame & multiple forecast .
this educational based chart as per EW theory method