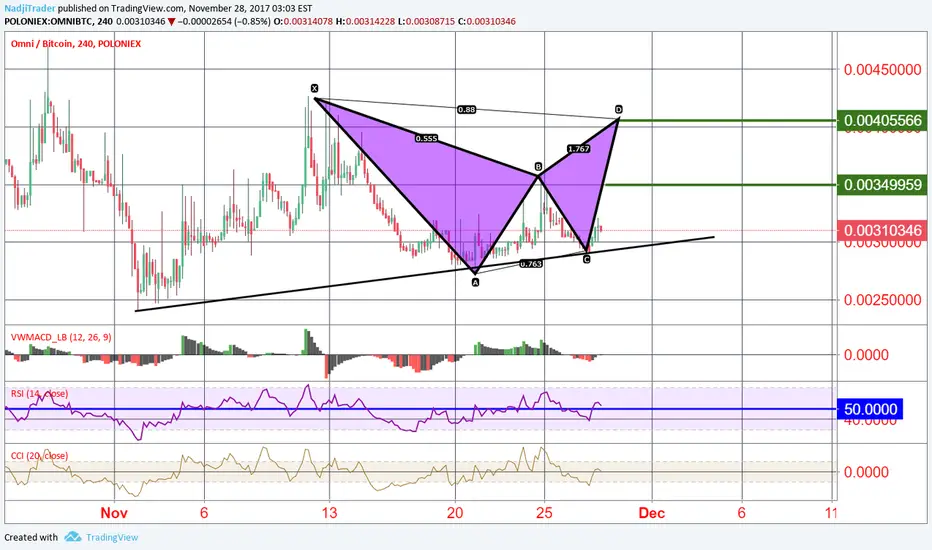
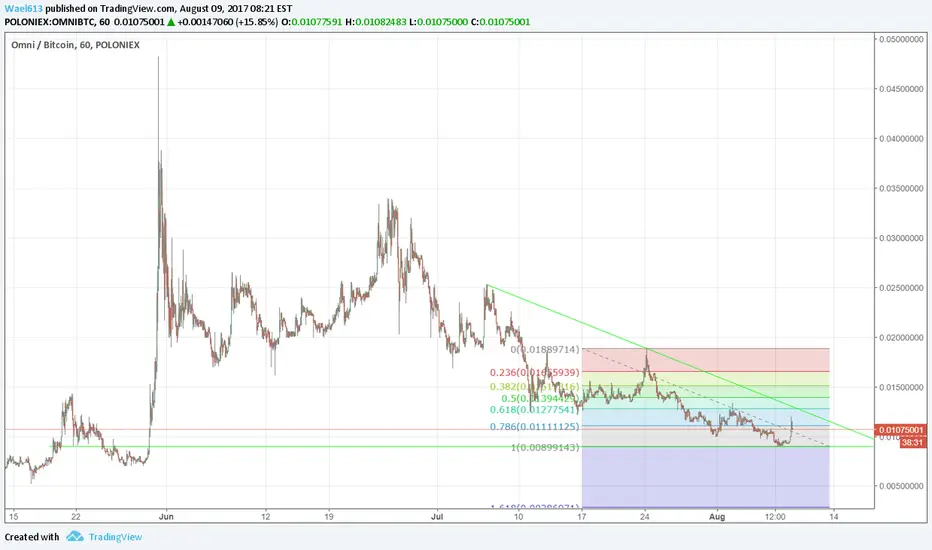
OMNI headed back to glory OMNI/BTCWatch these white fib levels very carefully. It could easily break the 61.80 fib level and at the same time break the forming young downtrend.
It look like a very good set up and I'm patiently waiting for the break out. My final target would be the 127 fib level.
OMNIBTC

Omni (OMNI) - Buy Long Opportunity (675% Profits Potential)OMNI, this is a trade analysis that is exclusive for you, but this is also a trade that will put your patience to test. This trade will test your patience because it is already overloaded on the daily chart, but it is a good buy for the longer weekly term.
So, are you in for trading it and making huge profits in a weeks times, or will desperation take the best you, and tell you to run and hide?
We will know really soon. Let's start this trade.
*** Indicators:
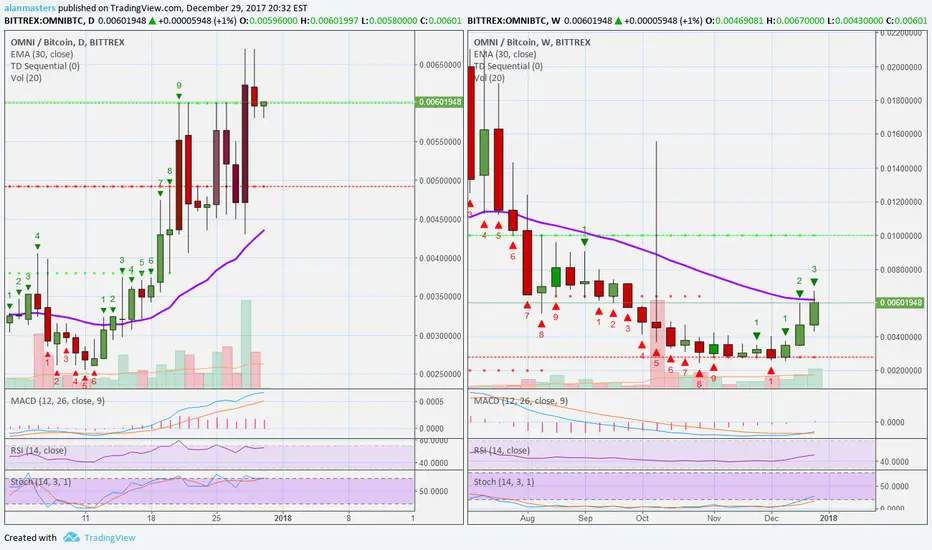
- I put up two chart in the opening of this trade. On the left you can see the daily chart, which is obviously overloaded and looking to go down. On the right side, you can see the weekly chart, where the action is just about to start. So what would you do? To trade or not to trade? Do I want to make money? Can I wait for two days?
- The short term is bearish, the daily chart, so let's forget about that, there is no fun in looking at a coin that it is going down.
- Now, look at the weekly chart. This is the one on the right. You might think that the candles there are pretty small and that there isn't much action, but that is not the case. As an example, candle #2 had a low of 0.0034 and a high of 0.0060, that's almost a 100% swing in price, in just 1 week. The next candle, candle #3, also had a huge swing in price, with prices going as low as 0.0043 and as high as 0.0067. Now, there is something to learn here, regardless if you choose to join this trade or not.
- The weekly candles are doing something pretty interesting, specially for someone that wants to learn to understand what are the charts trying to say. Each week, the lowest point is higher than the previous week and the highest point is higher than the previous week. So you have higher highs and higher lows. The key word being higher. This is also true for the first candle.
- What I just described above, its called a bullish signal. A signal that says the bulls want action. Which means that they are working to push the price up.
- The next indicator to look at is the MACD. It clearly shows a curve and a "cross over", which is the blue line crossing the orange line in order to start moving up. This type of set up is bullish for several reasons. One is the obvious one, the curve shows that the indicator isn't pointing downward anymore, it is now pointing upward, and, since it is sitting at the bottom, it has plenty of room for growth.
- The RSI & STOCH are also pointing up. The weekly chart is bullish, the daily chart is overloaded.
- So, this is a pretty simple set up. You wait in the daily movements for the price to go down so that you can buy low, and then expect to see positive upward action in the weeks to come.
- I know that you like these classes, because I am also learning as I go. So use this information to your advantage, and when joining this trade, make the BEST POSSIBLE CHOICE.
- Here is the daily chart without looking at a close up. The rise you see on the left, is not as big as you really thought, and the long term shows that this is really a small pump. This is a great trade to make profits where otherwise most people would run.
*** Instructions:
Buy-in: 0.00470 - 0.00650
Stop-loss: 0.00404
Targets:
(1) 0.0151
(2) 0.0202
(3) 0.0252
(4) 0.0300
(5) 0.0365
(6) 0.0450
(7) 0.0691 (New all time high)
Note: These targets are reference points to sell on the short and long term. Sell when you feel comfortable with your earnings. Buy low and sell high. Not all targets are meant to be reached.
*** Message
To trade or not to trade?
Why would I ever spend time complaining, when there's a lot of money to be made?
Am I right or is he wrong?
Whatever the answer to my question, I just don't want to make the choice.
To trade or not to trade?
Again, I understand. I have to make my own decisions, if I want to become successful in this game.
Ok, let's stop. Is it him or is it me?
It doesn't really matter, buy your coins and go to sleep.
Namaste.
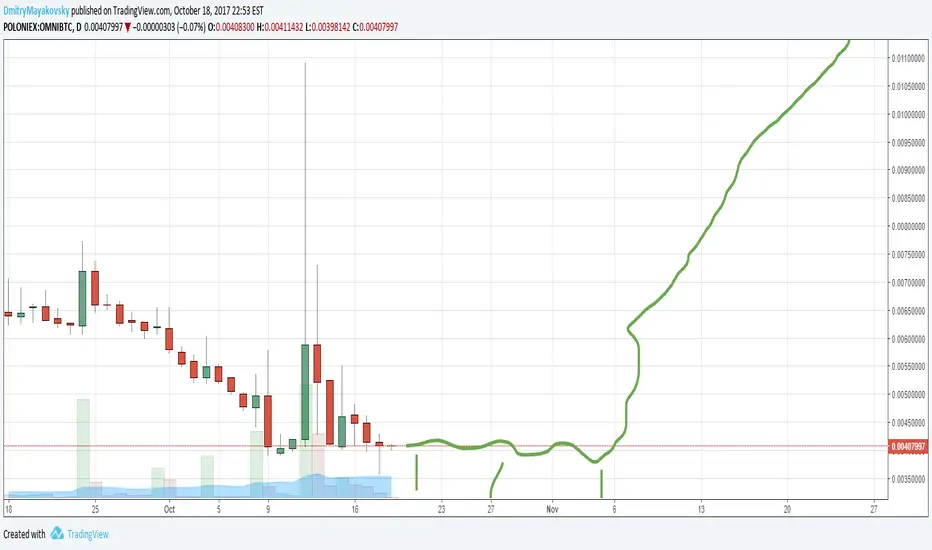
OMNIBTC breakout imminentThis coin will have kumo breakout sideways in a couple of days (29/30 Dec) and has the potential to develop fast.
Bullish signals:
The price has crossed kijun-sen upward in the cloud = medium bullish
Tenkan-sen has crossed upward over kijun-sen in the cloud = medium bullish

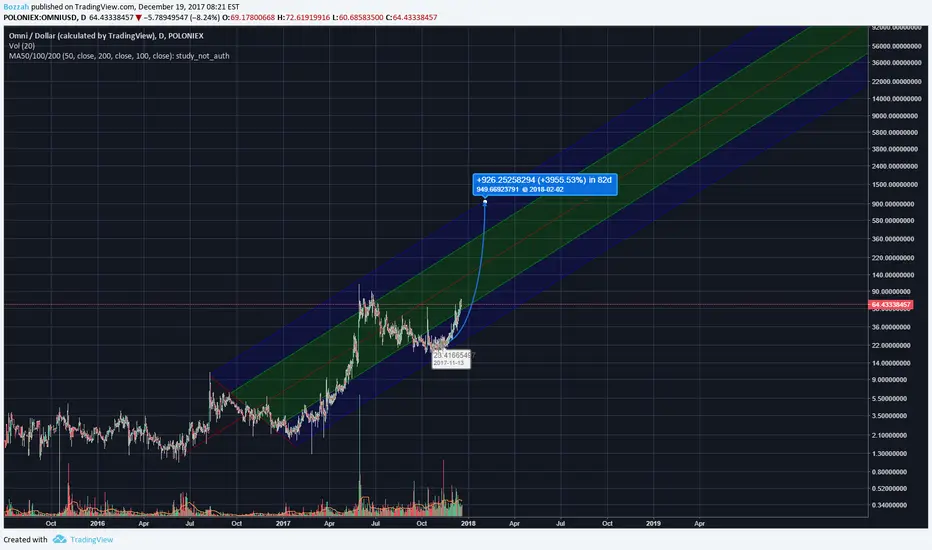
Moon mission?Looking at the logarithmic chart of $OMNI/$USD . With the recent release of a new version, $OMNI is due for a massive pump.
Target is anything from 800 to 1000 USD.
You can check out the $OMNI/$BTC chart as well to see a classical megaphone pattern that appears to be starting to move to the upside.
OMNI in best buy zone , we can see big bump in the next week buy and hold from best zone with stop limit 550000
target 1 = 980000
target 2 = 1200000

Omni / BitcoinOMNI - The rocket goes to the moon soon, we prepare for flight, we ask all on landing.
Omni ThoughtsLooking like a good coin to get into. Its cheap and has a lot of potential If you can buy it at the level 1 fib I think you would be getting a great price. Strong support at .09 buying as close to that will secure you more profits.
XCPBTC LAGGING WITH OMNIBTCFRACTAL LAG AGAINST OMNIBTC AND PUMP LINES UP WITH BITCOIN SEGWIT. 0.04 TARGET

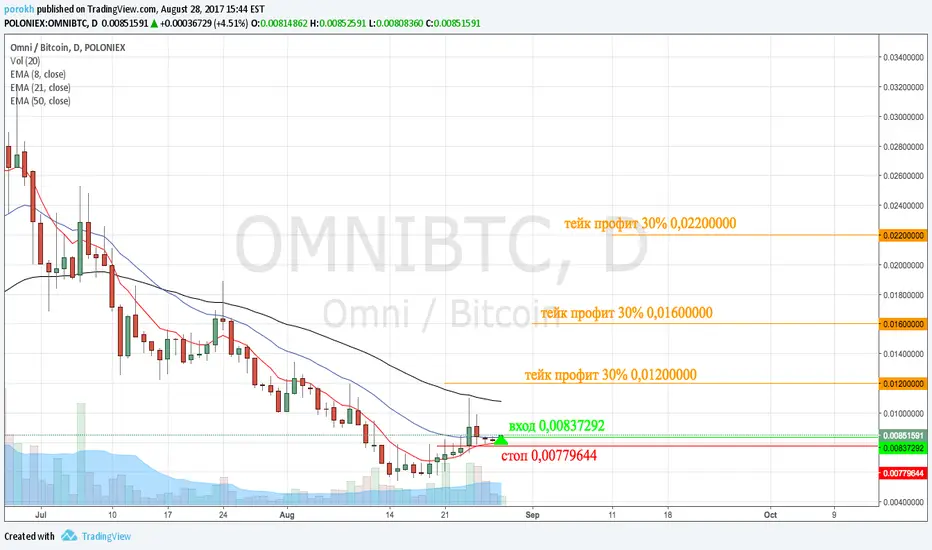
OMNI BTC Trading Tip For The Next DaysOMNI BTC Trading For The Next Days based on trending lines and support lines.
Hi guys, here are some tips for OMNI/BTC trading. Watch carefull for breakouts. We can see longterm support lines and one shortterm support line. There is top high line too and if we break that then price is gonna get even more up. Watch down support lines, if the price braeaks thoselines, rice i gonna fall a little bit until strong support line.

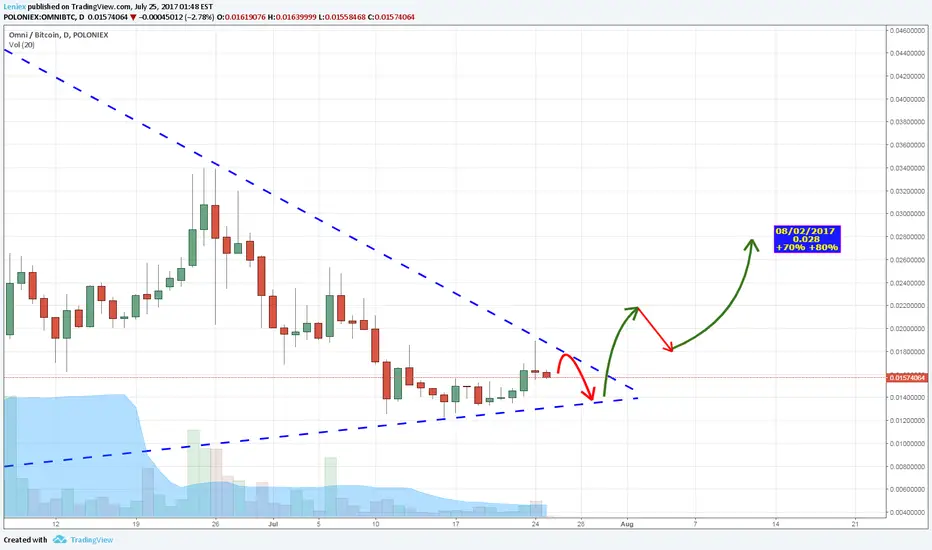
OMNI is about to break freeWatch the fork in witch its going now. And the second arc pair is broken, so OMNI gonna test 3rd arc pair in a very close time. Target is fib 1.0 then 1.618


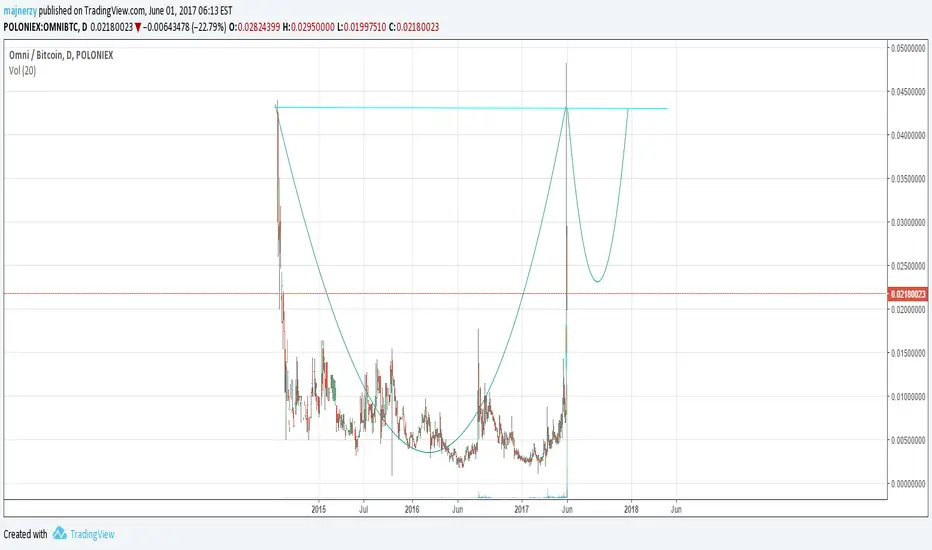

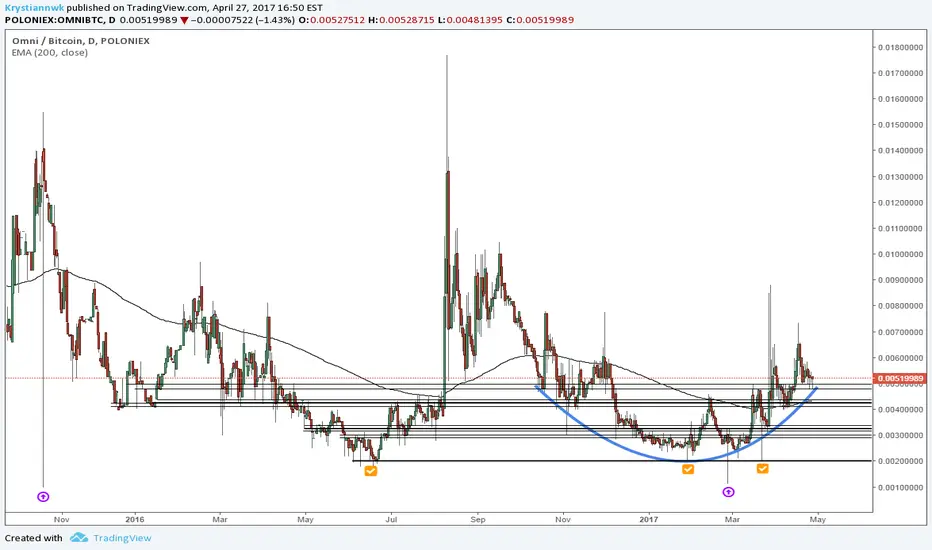
OMNIBTC chart packed with all sorts of patterns and formations There are many interesting formations on this chart. First of all is double bottom where pair reached 0.00100000 in March this year and October 2015. It is clearly visible on weekly chart. We have upside down head and shoulders formation created from doji candles (it’s look better on hourly chart) . Rounded bottom (marked with blue curved line) . Pair is trading above 200 Ema which is bullish sign. This pair also established support level around 0.0020000 which is marked with bold black line.
I marked with black parallel lines most of the GAP above the 0.0020000 area so you can see how market is reacting to them (GAP’s are treated as the solid support to push higher which is suggesting strong bullish potential) .
This pair with all the mentioned formation looks very bullish to me and I’m pretty sure that this pair will reach 0.0150000 or maybe 0.020000 in future.