BTC analysis, supports 116k, targets 122k, caution below 115.9k__________________________________________________________________________________
Technical Overview – Summary Points
__________________________________________________________________________________
Bullish momentum confirmed on all timeframes (1D to 1H).
Key supports: 115,960 / 117,423 / 117,700. Main resistances: 119,573–119,800–122,318.
Volumes overall normal to moderately high, no climax.
Risk On / Risk Off Indicator: strong buy signal for all higher TFs, neutral on 30m/15m (momentary exhaustion).
ISPD DIV neutral across all frames, no extreme or behavioral signals.
MTFTI trend: up / strong up across the board.
__________________________________________________________________________________
Strategic Summary
__________________________________________________________________________________
Main bias: confirmed bullish, high-range maintained between 116k–122k.
Opportunities: buy on validated pullbacks between 116k–117.7k, take partial profits under 119.5k–122k.
Risk areas: sharp downside below 115,960 with potential extension to 112k/110k.
Macro catalysts: PCE (slightly above consensus), Fed on hold, moderate volatility. No negative crypto catalyst in sight.
Action plan: Tactical stop-loss below 115,960, defensive management within range.
__________________________________________________________________________________
Multi-Timeframe Analysis
__________________________________________________________________________________
1D – Support: 115,960 (Pivot Low), Resistance: 119,573–122,318. Strong momentum, resistance clusters.
12H/6H/4H – Bullish structure, moderate volume participation, consolidation under major resistance, pullbacks defended.
2H/1H – Compression between pivots, patience before breakout or support retest.
30m/15m – Tight consolidation, Up momentum but neutral behavioral signals, compression pre-move.
Risk On / Risk Off Indicator : Strong buy on all TFs except intraday, neutrality on 30m/15m (temporary stall).
ISPD DIV : No euphoria/fear, median persistent zone.
Volumes slightly above average, healthy structure.
Summary: Technical and fundamental confluence, upper range maintained, no reversal signals present.
__________________________________________________________________________________
Summary and Strategic Plan
__________________________________________________________________________________
Main bias: confirmed bullish on all frames, but increased caution above 122k.
Plan: tactical buy only on validated pullback/price action, defensive profit-taking near resistance.
Stop-loss below 115,960. Major invalidation under this threshold (low liquidity area).
Monitor reactions to upcoming macro events (PCE/Fed) and any escalation in geopolitics.
__________________________________________________________________________________
Macro/Fundamentals & On-chain
__________________________________________________________________________________
US Macro: PCE YoY above forecast (2.6% vs 2.5%), Fed on hold, USD under pressure.
No systemic negative crypto alerts. IMF to classify BTC as “national wealth” from 2026.
On-chain: Large liquidity test absorbed, 97% of BTC supply in profit, network consolidation in 117k–122k.
Specific risk on break <115k: potential acceleration towards 110k.
__________________________________________________________________________________
Summary: BTC/USDT is in a structural range 116k–122k with a dominant bullish bias, supported by technicals, strong macro and on-chain content. Accumulating at supports and defensive sells near resistance remain optimal until confirmation of a directional breakout.
Suggested stop-loss: <115,960.
Moderate risk until the next major macro/event catalysts.
__________________________________________________________________________________
Onchain

Strategic Multi-Swing Analysis – Pivots and Post-FOMC Outlook__________________________________________________________________________________
Technical Overview – Summary Points
➤ Sustained bullish momentum on BTCUSDT across all swing timeframes.
➤ Key supports: 116400–117400 (likely rebound), major supports: 105047–114674.
➤ Main resistances: 119000–120000 (short term), major ceiling at 123240 (1D/12H).
➤ Risk On / Risk Off Indicator: "Strong Buy" signal – tech sector leadership confirmed.
➤ Volumes normal to moderately elevated, no excess or behavioral anomaly (ISPD "Neutral").
➤ No euphoria or capitulation flags; general wait-and-see attitude, FOMC event ahead.
__________________________________________________________________________________
Strategic Summary
➤ Strategic bullish bias remains as long as 116400/117400 supports hold.
➤ Opportunity window: buy pullbacks towards 117400–116400 with tight stops; clear invalidation below 115900.
➤ Risks: FOMC-induced volatility, increased leverage on alts, potential capitulation if key support breaks.
➤ Catalysts: FOMC communication, geopolitical context (no immediate threat), background risk-off climate not yet triggered.
➤ Action plan: Prioritize post-event reaction over anticipation; maintain strict technical protection.
__________________________________________________________________________________
Multi-Timeframe Analysis
1D: Uptrend confirmed. Price above all major supports. Strong resistance at 123240, key support at 105047, normal volumes, Risk On / Risk Off Indicator "Strong Buy", ISPD "Neutral".
12H: Bullish bias. Resistance cluster 120002–123240. Intermediate supports 114674/111949. Momentum/volume supported, no excesses.
6H: Bullish near range top, supports at 114674/111949, ceiling at 120002–123240. Solid Risk On / Risk Off Indicator.
4H–2H: Up momentum, resistance 119003–120002–123240, supports 116474/117800. Moderate/normal volumes.
1H: Strong uptrend, thick resistance at 119000–120000, immediate supports 117800/116474. Slight volume uptick ahead of FOMC.
30min–15min: Resistance 119003–120000 (~H4 pivot). Intraday support 117400–117800/118200. Both Risk On / Risk Off Indicator and ISPD neutral, normal volumes, bullish as long as 116474 holds.
SYNTHESIS: Broad bullish confluence on MTFTI from 1H to 1D/W.
Supports at 116474/117400 are key pivots for maintaining bullish swing view.
No behavioral alerts or extreme volumes.
Consolidation/waiting likely before FOMC release – monitor reactions at pivot zones.
__________________________________________________________________________________
Strategic decision & macro
Opportunities: Swing bullish scenario favored as long as key supports hold, buy strategic pullbacks, reverse on clear break.
Main risk: FOMC volatility, altcoin excesses, possible post-announcement fake moves. Active monitoring essential.
Macro/on-chain: No excess, BTC realized cap > $1T; aggressive rotation into alts, high open interest. No capitulation. Major on-chain & technical support aligned at 114500–118000.
Action plan: Favor reactivity (post-FOMC), tight stops, progressive take profits at 119500–123240 resistance. No aggressive pre-positioning.
__________________________________________________________________________________
Macro catalysts overview
FOMC expected: status quo, market sensitive to any Powell tone shift.
Global macro: latent risk-off, geopolitical drivers closely watched.
BTC stable, no technical disruptor in the immediate term.
__________________________________________________________________________________
Final Decision Summary
Robust technical setup with a clear bullish bias. Optimal entries on 117400-116400 pullbacks, stops below support, active management needed during FOMC. No on-chain excess; constructive background unless exogenous shock or resistance failure (119000–123240). Stay alert for breakout/reject pivot.
__________________________________________________________________________________

Bitcoin Bullish Momentum, Swing Setups on Support Pre-ECB__________________________________________________________________________________
Technical Overview – Summary Points
__________________________________________________________________________________
Strong bullish momentum confirmed on all timeframes >1H; structure Up.
Major supports: 105100, 111980, 115736; main resistance: 122318 (ATH).
Volumes normal at all timeframes except 30min (very high at lows, institutional absorption).
No behavioral anomaly signals (ISPD DIV neutral, Risk On / Risk Off Indicator = "STRONG BUY" everywhere except 15m/30m).
Multi-timeframe alignment, only 15m/30m in minor divergence (Down, no structural impact).
__________________________________________________________________________________
Strategic Summary
__________________________________________________________________________________
Bullish swing/mid-term bias confirmed: Optimal opportunities on pullbacks 117900–116467.
Risk/stop zone: below 115736 USDT (key multi-frame pivot).
Catalysts: ECB (24/07, volatility expected); strict monitoring post-announcement.
Plan: swing entries on pullback, strict risk management, reduce exposure before macro events.
__________________________________________________________________________________
Multi-Timeframe Analysis
__________________________________________________________________________________
Daily (1D) : Consolidation after ATH, strong supports (105100, 111980). Strong momentum, Risk On / Risk Off Indicator at "STRONG BUY," ISPD neutral. Normal volumes.
12H/6H : Price oscillating near upper pivots (115736, 116467). Buyers in control. "STRONG BUY" generalized.
4H/2H : Range 116467–119676, Up momentum. Swing setups/favorable to buyers on weakness.
1H : Full confirmation of the bullish bias. 116.5–117K area = key support for scalp/swing.
30min/15min : Minor short-term bearish divergence, increasing volumes, no structural warning. Possible scalping on bullish reaction 117800–116467.
Risk On / Risk Off Indicator = "STRONG BUY" on all timeframes (>1H). Only micro-risk: "Down" divergence on 15/30min, to be watched.
Main risk: $130K area (Glassnode major statistical resistance), possible capitulation below 115736 (swing invalidation).
Targets: 122–130k.
Macro: Reduce exposure before 24/07 (ECB), adjust stops if extreme volatility.
__________________________________________________________________________________
Fundamental & On-Chain Summary (Glassnode, July 22, 2025)
__________________________________________________________________________________
BTC in price discovery, all holder cohorts in profit (>95% STH).
Profit-taking rising but no climax detected; market is "breathing".
Major support: $110K; major resistance: $130K.
Attractive risk/reward outside euphoria zones. Stop advised <115736.
No immediate disruptive macro catalyst. Watch for volatility spikes at ECB decision (24/07).
__________________________________________________________________________________
Actionable Synthesis & Plan
__________________________________________________________________________________
"Swing long" favored on pullback 117900–116467 / stop below 115736.
Scalping weaknesses 117800–116467 on bullish reaction, monitor post-ECB confirmation.
Reduce leverage/exposure ahead of ECB.
R/R ratio >2 on bullish swing scenario; strict stop-loss.
Robust bullish context, valid technical structure. Active approach required short term: seize pullbacks, protect stops, adjust post macro-news.

Bitcoin Swing Reinforcement, Strategic Stops Below 115k__________________________________________________________________________________
Technical Overview – Summary Points
__________________________________________________________________________________
Momentum : Strong bullish trend on all timeframes above 1h (MTFTI dark/gray, “Strong Up” confirmed).
Supports/Resistances :
Key supports: $104,000–$110,000 (HTF), $116,000–$118,000 (STF).
Strategic resistances: $120,000–$122,000 (HTF), ATH $125,000.
Volumes : No excess, healthy and regular flows.
Risk On / Risk Off Indicator : Strong BUY across all higher timeframes, US tech sector momentum is bullish.
ISPD DIV : Neutral across all TFs, no extreme behavioral signals.
Multi-TF behavior : Bullish confirmation down to 1H; neutral/profit-taking mood on 15min–5min.
__________________________________________________________________________________
Strategic Summary
__________________________________________________________________________________
Overall bias : Strong bullish as long as the $116,000 zone holds.
Opportunities : Swing entries on pullbacks $116,000–$118,000; first take-profits at $122,000–$125,000. Potential extension up to $130,000 if on-chain momentum persists.
Risk zones : Below $115,000 = invalidation, structural downside risk (swing closure recommended).
Macro catalysts : No imminent major macro event, structurally mild volatility. Geopolitical hand neutral for now.
Risk management : Mandatory stop $114,800–$115,000, current risk/reward >2:1 on the bounce zone.
Action plan : Buy on clean retracement above 116k–118k, actively track STH profit-taking, reactively adjust if major S/R clusters break.
__________________________________________________________________________________
Multi-Timeframe Analysis
__________________________________________________________________________________
1D : Supports 104k–110k, major resistance 120k–125k. Risk On / Risk Off Indicator STRONG BUY. ISPD DIV neutral, volumes regular. MTFTI Strong Up.
12H : S/R 117.5k–119.3k, strong support 115k–116k. Risk-on sectorial momentum active. Volumes unaltered, confirmed uptrend.
6H : Resistance 119.3k, support 116k. Still strong buy, healthy flows, technical uptrend confirmed. Bounce ops 116k–117k.
4H : Support 117.5k–118.2k. Resistance 120k–121k. Risk On / Risk Off Indicator only buy, general up. No abnormal volume.
2H : Support 118k/116k, resistance 120k. Sectorial momentum intact, uptrend solid, best scalping/retest at 118k.
1H : Support 118k, res. at 119.5k then 120k. Sectorial momentum strong, no volume/ISPD excess.
30min : Support 118k, resistance 119k/119.8k. Slight momentum drop, context healthy. Fast entries on rebounds.
15min : Support 118.2k, resistance 119.3k. Risk On / Risk Off Indicator neutral. MTFTI micro-volatile. Volumes steady.
__________________________________________________________________________________
Decision Synthesis
__________________________________________________________________________________
Confluences : Bullish alignment across HTFs, strong sector momentum, healthy volumes, no behavioral excess.
Divergences : Slight short-term fading on lower TFs. Adjustment signal, not a trend reversal.
On-chain : All holders in profit, early STH profit-taking but no structural top. Potential extension 122–130k$ before local exhaustion zone.
Risks : Drop below 115k would invalidate the swing dynamic. Geopolitical stress to be monitored, but little short-term transmission.
Strategy : Buyers to reinforce between 116k–118k, secure partials above 122k. Strict stop below 115k.
__________________________________________________________________________________

Bullish momentum holding, accumulation zones in focus__________________________________________________________________________________
Technical Overview – Summary Points
➤ Strong bullish momentum across all timeframes.
➤ Key supports: 104–110k$ and 110–115k$; pivot resistance: 124k$.
➤ Normal volumes, no panic or exhaustion phases detected.
➤ The Risk On / Risk Off Indicator consistently supports the bullish trend, with minor short-term slowing.
➤ No behavioral alerts (ISPD DIV), multi-timeframe structure fully aligned.
__________________________________________________________________________________
Strategic Summary
➤ Structurally bullish bias as long as supports above 104–110k$ hold.
➤ Tactically seek long entries on retracements to 110–115k$ (preferred swing bias).
➤ Fast profit-taking zone above 124k$ or on loss of key support clusters.
➤ Macro environment neutral to slightly positive, no urgent negative catalysts.
➤ Action: prioritize long trades on pullback, strict stops below 104k$, reduce sizing before major news releases.
__________________________________________________________________________________
Multi-Timeframe Analysis
1D:
- Strong 124k$ resistance, major supports at 104.5k$ & 108–110k$ (technical and on-chain clusters).
- Risk On / Risk Off Indicator: strong buy, balanced volumes.
- Buy zone = pullback to 108–110k$; rapid profit-taking on break of 124k$ without macro confirmation.
12H:
- Distribution below 124k$ resistance, optimal support at 110–115k$.
- Risk On / Risk Off Indicator bullish, clear bullish confluence.
- Wait for confirmed break to extend; buy dips.
6H / 4H:
- Failed breakout at 124k$, solid supports at 110–115k$.
- Momentum intact, stable volumes, healthy structure.
- Dip accumulation recommended as long as supports hold.
2H / 1H:
- Active defense of 110–115k$ support and pivots at 115–118k$.
- Risk On / Risk Off Indicator very favorable (swing pullback entries).
- Stable volumes, no exuberance.
30min / 15min:
- Moderated momentum, micro-range below 120k$.
- Treat every dip as an opportunity to join the main trend.
Cross-summary: As long as >110k$ holds, each pullback is an accumulation opportunity. Only a persistent break below 104k$ invalidates the bias.
__________________________________________________________________________________
Fundamental & On-chain Analysis
Macro: US CPI above expectations, no Fed rate cut expected, neutral to risk-on environment. No immediate negative news, volatility under control.
Calendar: increase caution before key macro releases, reduce swing exposure ahead of FOMC/high-vol days.
On-chain: major accumulation supports 104–110k$; watch for loss of STH in profit momentum.
Strong coherence between technical and on-chain clusters, but remain watchful for euphoric tops >124–130k$.
__________________________________________________________________________________
Strategic conclusion and action plan
Trend: Bullish unless crash below 104k$.
Action: Prioritize buying pullbacks at 110–115k$, strict stops under key pivots.
Swing window possible up to 130k$ if no on-chain/macro overheating.
Increase prudence if break >124k$ occurs without macro/sector momentum.
As long as the multi-timeframe structure holds and on-chain support clusters are respected, every pullback to 110–115k$ should be seen as a buy opportunity. Key watch: breakouts above 124k$ without macro confirmation and on-chain STH/profit stress signals.
__________________________________________________________________________________

Bitcoin Key 116800 Support Tested, US CPI as Decisive Catalyst__________________________________________________________________________________
Technical Overview – Summary Points
➤ Bullish momentum maintained across all major timeframes (1D to 1H). Key supports held at 116800-117200. Very high volume on low timeframes, indicating distribution/recharging. Risk On / Risk Off Indicator shows Buy across major TFs, micro-buy opportunity signaled on 15min. No extreme behavioral signals, except short-term positive micro-signal.
__________________________________________________________________________________
Strategic Summary
➤ Cautious bullish swing bias as long as 116800-117200 holds. Monitor strong tech sector momentum (Risk On / Risk Off Indicator). Heightened risk zone if support breaks (downward targets: 111000/110500/107200). Main catalyst: US CPI release—active trading management advised before/after. Tactical approach necessary: stop below 116200, TP 119000/120000. Closely watch low timeframe volumes and ISP signals.
__________________________________________________________________________________
Multi-Timeframe Analysis
➤
1D: Bullish, multiple supports at 10510/107200/11050-11190, resistance at 123000/119000-120000. Strong Risk On / Risk Off Indicator acquisition, normal volumes, no behavioral overheating.
12H: Momentum intact, 116800-117200 key area. Volume normal, stable mature market, no emotional excess.
6H: Bullish retest validated on 116800, rising volume but no dramatic spikes, key moment for trend.
4H: Dynamic support at 116800, resistance 119000-120000. Uptrend, healthy as long as support holds.
2H: Very high volume amid consolidation/reloading, increased volatility around 116800.
1H: Still Up, but extreme volume, increased caution. Possible stop hunting.
30min: Slowdown, volume still very high, micro-correction or local exhaustion.
15min: Micro-correction but ISP buy triggered; potential short-term bounce.
Key alignments: All TFs 1D–1H Up, supports held. 30min/15min correction on volume excess.
Major confluence: 116800-117200 = absolute pivot: break = correction, bounce = further up.
Divergences: Extreme volume not confirmed by ISP, except 15min.
Technical zone of action: Bullish scenario confirmed if bounce on 116800; invalidation on breakdown.
__________________________________________________________________________________
Macro & Fundamental Analysis
➤ No major macro event in the very near term
➤ Sole catalyst ahead: US CPI release, watch for possible whipsaws
➤ Institutional flows (ETF AUM record highs); on-chain stability, visible accumulation
➤ Volatility tightly compressed, coiling for next breakout on impulsive move
➤ Geopolitical noise present but limited direct impact in short term
To watch: post-CPI reactions, low timeframe volumes, defense/break of 116800-117200 cluster, micro ISP 15min signal, volatility & ETF institutional flows.
__________________________________________________________________________________
Summary & Action Plan
➤ Preferred scenario: Cautious swing long if 116800-117200 support cluster holds, stop <116200, TP 119000-120000+
➤ Invalidation: Prolonged breakdown of 116800: exit, wait for signal resynchronization.
➤ Catalysts: US CPI, watch for whipsaws (<1h pre/post-release).
➤ Risk management: Avoid adding if extreme volumes persist without ISP buy on short TFs (30m/1H), close monitoring ahead of data.
➤ On-chain context: Record volatility compression—major move likely soon; spot supply clustered—expect amplified reactions.
__________________________________________________________________________________
Bitcoin facing breakout, active management recommended__________________________________________________________________________________
Technical Overview – Summary Points
Strong bullish momentum across all timeframes (MTFTI “Strong Up”).
Key supports: 110,483–111,949. Major resistances: 118,689–119,499.
Volumes normal to slightly elevated. No anomaly or climax.
Behaviour: early caution signals on ISPD DIV (4H–2H), sector “sell” trigger on the Risk On / Risk Off Indicator (15min).
__________________________________________________________________________________
Strategic Summary
Overall bullish bias on all timeframes. Structural uptrend confirmed, but early behavioural/sector divergence at short term.
Buy zones: pullback to 110,483–111,949. Stop/alert below 110,483 H4/H6 close.
Opportunities: tight trailing above 118,689 to capture extension. Partial take profit advised in upper range (118,689–119,499) if divergences persist.
Risks: geopolitical risk-off catalysts, start of selling extension, or loss of support.
Plan: active management required, avoid overexposure, plan for key break levels, readiness to exploit imminent breakout.
__________________________________________________________________________________
Multi-Timeframe Analysis
1D : Price above all pivots, strong momentum. Key resistance in play (119,499), supports at 110,483/105,054. Volumes normal, bullish alignment.
12H : Confluence of resistances (119,499–115,495), structure intact, buy opportunity on retrace. No major alert.
6H : Strong buying extension, pure momentum. No excess signals.
4H : First divergence (ISPD DIV “sell”). Consolidation on resistance, consider partial profit-taking.
2H : Bullish momentum but ISPD DIV “sell” and moderately high volumes. Localized euphoria risk.
1H : No excess, post-breakout consolidation.
30min : Extreme consolidation, decelerating volumes, possible fatigue.
15min : Sector “sell” trigger (Risk On / Risk Off Indicator “Sell”). Trend remains up, but caution is advised.
Multi-tf summary:
Bullish alignment across all horizons. Short-term behavioural caution, but trend remains unchallenged as long as above 110,483–111,949.
__________________________________________________________________________________
Synthesis & Strategic Bias
Multi-timeframe momentum confirmed, watch supports at 110,483–111,949.
Buy on valid retrace, take profit at highs if behaviour diverges.
Break below 110,483 (H4/H6 close) = invalidation signal.
Key triggers: geopolitical news, broken supports, selling spikes.
Base scenario: likely imminent directional breakout (volatility). Watch for spikes on major headlines.
__________________________________________________________________________________
Fundamentals and Macro News
Uncertain backdrop (Fed, US inflation, bonds & FX), no major macro trigger in 48h but latent volatility.
Crypto: Bitcoin stable, general accumulation, no violent distribution detected.
Geopolitics: rising tensions (Iran, Ukraine). Can prompt sharp risk-off if escalation occurs.
No major macroeconomic event scheduled (empty calendar).
__________________________________________________________________________________
On-chain Analysis
Accumulation phase for all holders, >19k BTC/month absorbed. Extreme volatility compression (coiling).
Realized & implied volatility is exceptionally low, setting up violent move.
ETF (IBIT BlackRock): record accumulation. Downside break could trigger psychological stress.
Baseline: technical & on-chain setup disfavors bears. Any exogenous shock accelerates volatility.
__________________________________________________________________________________
Strategic Recap & Action Plan
Bullish bias validated, risk of market fatigue on short-term signals.
Buy on controlled pullback, tight trailing at highs, partial profit-taking in 118,689–119,499 band.
Swing stop below 110,000 (H4); total invalidation if daily support fails.
Expect directional move + volatility on next impulse (8–48h).
__________________________________________________________________________________
Conclusion
BTC remains in a primary bullish trend, supported by on-chain accumulation and extreme structural compression. Only active management (profit, leverage, stops) optimizes R/R and prepares to respond to an imminent, directional volatility event. Stay proactive and plan!
__________________________________________________________________________________
BTC Multi-TF Analysis: Bull Bias Holds, All Eyes on Resistance__________________________________________________________________________________
Technical Overview – Summary Points
__________________________________________________________________________________
Momentum: Very strong bullish bias across all major timeframes. No selling signal detected; slight micro-pause on 15min.
Key Supports / Resistances: Immediate resistance at 111,000–112,500. Critical supports: 108,000–109,000, then 105,000. Any lasting break below 107,500 is a key alert.
Volume: Healthy, balanced volumes. Some moderate surges on 1H/2H, but no climax.
Risk On / Risk Off Indicator: Strong Buy across all TFs except 15min (partial pause).
Multi-TF behavior: Complete convergence. No sign of distribution. ISPD DIV neutral overall.
__________________________________________________________________________________
Strategic Summary
__________________________________________________________________________________
Dominant bias: Bullish, confirmed by both technical and on-chain context.
Opportunities: Add on retracements to major supports (108k–109k, potentially 105k). Target breakout >112.5k for extension or further swing adds.
Risk/Alert Zones: Breakdown <107.5k (especially with high volume/macro event). Congestion zone at 111–112.5k: monitor reactions and volumes closely.
Macro catalysts: FOMC, Jobless Claims, Bond Auction (see economic calendar). Adjust sizing before and after.
Action plan: Gradual buys on major supports; heightened monitoring pre-US announcements (avoid overexposure during high-volatility). Structural stop below 107.5k; for swing, <105k ideal.
__________________________________________________________________________________
Multi-Timeframe Analysis
__________________________________________________________________________________
1D: Structurally solid market above key supports. No divergence or selling signals. Resistances: 111,500–112,500. Main support: 105,050.
12H: Dominant buyer pressure. Key support at 107,500–108,000. No speculative excess.
6H: Marked accumulation. Multi-TF resistance at 111,000–111,500.
4H: All trends aligned; focus on resistance 111–112k.
2H: Ongoing momentum. Moderate volume. Watch 107,400–108,000 for dips.
1H: Reinforced bullish bias; no short-term weakness.
30min: Opportunities on any pullback to supports (110,400, 109,000).
15min: Micro-pause on sector momentum. Potential consolidation below 111k–111,500.
Risk On / Risk Off Indicator: Strong Buy on all TFs except 15min (neutral, no sell).
ISPD DIV: Neutral across the curve, no behavioral excess detected.
__________________________________________________________________________________
Cross Analysis & Executive Summary
__________________________________________________________________________________
Confluences: Major bullish bias. Risk On / Risk Off Indicator in Strong Buy (except 15min). Balanced volumes. ISPD DIV neutral.
Dissonances: Micro-pause on 15min momentum under resistance (possible very short-term consolidation).
Opportunities: Pullbacks to 108k–109k or even 105k, clear breakout above 112.5k.
Risks: Break below 107,500 (key alert), high volume+rejection under 111–112.5k (possible profit-taking).
__________________________________________________________________________________
Macro & On-chain Focus
__________________________________________________________________________________
Macro: Awaiting FOMC (late July), key US macro data (Jobless Claims, 30Y Bond Auction). Neutral to potentially high volatility environment around economic catalysts.
On-chain: Long-term holder supply at ATH. US ETF inflows positive. Healthy on-chain: little short-term top risk. Key on-chain threshold at 98.3k (Short-Term Holder Cost Basis).
Institutional: No panic, ongoing “disciplined accumulation”, no excess euphoria.
__________________________________________________________________________________
Operational Action Plan
__________________________________________________________________________________
Closely monitor 111–112.5k resistance: reactively adapt based on price/volume.
Gradual re-entries on major supports if no behavioral anomaly or excessive selling volume.
Structural stop <107.5k, swing invalidation <105k.
Swing opportunity window post-FOMC if dovish or calm.
Adjust exposure and risk management around key macro dates.
__________________________________________________________________________________

Bitcoin - The ultimate breakdown for 2025/2026Welcome to my channel and this analysis. In this analysis I will dive deep in the current Bitcoin’s bullmarket. I will examine charts from the monthly, weekly, daily and 4H charts, and also on chain data. This will be a complete insight in Bitcoin’s price.
------------------------
Monthly timeframe
Logarithmic BTC chart
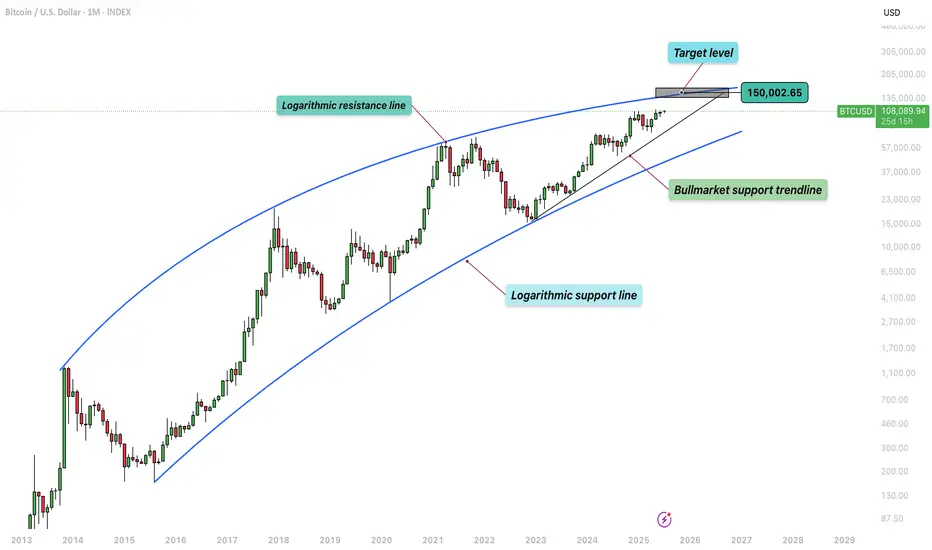
This chart presents a long-term logarithmic analysis of Bitcoin using monthly candles, covering the period from around 2013 to mid-2025. The structure is defined by two major curved lines representing a logarithmic resistance and support channel, which frames Bitcoin's price movement over more than a decade. These lines form a dynamic, upward-sloping price corridor, capturing Bitcoin's historically exponential price behavior and cyclical nature. The vertical axis uses a logarithmic scale to better reflect percentage-based changes, which is critical when analyzing an asset like Bitcoin that has grown from under $100 to over $100,000 in just a few years.
The chart displays clear multi-year cycles. The first notable cycle begins in 2013, followed by a significant correction in 2014–2015. A new bullish phase emerges between 2016 and 2018, peaking near $20,000. This is followed by a crash into 2018. A longer accumulation period precedes the 2020–2021 rally, which reaches a high around $69,000 before another sharp decline. From the bottom in late 2022 or early 2023, Bitcoin begins another uptrend, forming a steep rise along a newly established bullmarket support trendline. This trendline represents a more aggressive, linear support structure within the broader logarithmic curve, showing the strong momentum driving the current bull phase.
By July 2025, Bitcoin is trading around $108,000, advancing steadily toward the upper boundary of the long-term logarithmic resistance. A key element of this chart is the target level marked at approximately $150,000, which aligns closely with the point where the current trajectory intersects the upper logarithmic resistance. This zone has been highlighted as a likely area of interest, possibly signaling a market top or at least significant resistance, based on Bitcoin's past behavior. Historically, Bitcoin has tended to reverse sharply or consolidate after reaching this upper boundary, making the target zone an area of potential distribution or heightened volatility.
The bullmarket support trendline serves as a short- to medium-term structure within the larger logarithmic channel. As long as price holds above this line, the current bullish structure remains intact. A breakdown below this trendline could indicate a loss of momentum and trigger a broader correction.
The use of logarithmic trendlines underscores Bitcoin’s tendency to move in exponential growth cycles, shaped by macroeconomic trends, halving events, and adoption waves. The resistance and support boundaries function as dynamic guides for long-term expectations rather than rigid barriers.
The stoch RSI crosses
This chart provides a technical overview of Bitcoin on a monthly timeframe using candlestick analysis and the Stochastic RSI (Stoch RSI) oscillator to distinguish between bull and bear market phases. The Stochastic RSI, shown at the bottom of the chart, is a momentum oscillator derived from the RSI rather than price directly, making it particularly useful for identifying overbought and oversold conditions in trending markets. The key thresholds are the 80 level at the top and the 20 level at the bottom, which respectively indicate overbought and oversold zones.
The chart spans from 2017 to mid-2025, clearly separating bull and bear markets using vertical red lines and labeled annotations. Each major cycle aligns with movements in the Stoch RSI indicator. Notably, crosses above the 80 line (into overbought territory) are often associated with late-stage bull market tops or strong bullish continuations. Crosses below the 20 line (into oversold territory) typically align with bear market bottoms or the start of new accumulation phases.
Starting with the December 2017 peak, the Stoch RSI crossed above the 80 level, reaching extreme overbought territory. This cross occurred at the height of that bull cycle, signaling a likely exhaustion of momentum. Not long after this peak, the market entered a bear phase, confirmed by the downward cross of the Stoch RSI below the 80 level, and eventually below 20, leading into the 2018–2019 bear market.
By August 2019, the Stoch RSI crossed below the 20 level, signaling oversold conditions. Although this did not immediately launch a new bull market, it did suggest the market was bottoming out. This was followed by a gradual recovery and another decisive upward cross above 80 around April 2021, right in the midst of the strong 2020–2021 bull run. That cross confirmed the continuation of upward momentum and coincided with Bitcoin reaching new all-time highs.
As the price peaked in late 2021 and early 2022, the Stoch RSI again turned downward and dropped below the 20 threshold, marking another prolonged bear market. This downtrend was confirmed as the oscillator remained suppressed in the oversold zone for most of 2022.
The Stoch RSI is now moving again towards the overbought territory. This means that bulls have the control in the market and likely to push higher.
RSI with the consolidation and resistance trendline
This chart presents a broader monthly view of Bitcoin's price action alongside the Relative Strength Index (RSI), revealing a compelling structural alignment between price momentum and long-term resistance dynamics.
At the top of the chart, the candlestick pattern shows a clear upward trend spanning across multiple market cycles. A long-term resistance trendline has been drawn that connects the major highs from the two previous bull markets, specifically the peaks in late 2017 and late 2021. This resistance line acts as an upper boundary to the macro trend and, so far, the current price action in 2025 has not yet tested this long-term resistance. In fact, while Bitcoin has recently reached above $100,000, it remains below the ascending resistance trendline, suggesting that there could still be room for price to move higher before encountering the next major overhead challenge. The structure implies a potential upward continuation if momentum sustains, and the price may attempt to test this historical trendline in the near future.
Below the price chart, the RSI indicator offers additional insight into the underlying strength of this move. A descending RSI trendline connects the previous overbought peaks from 2017 and 2021, forming a macro resistance trendline in momentum that mirrors the structure seen in price. This declining RSI resistance has not yet been reached in the current cycle, implying that momentum still has space to grow before hitting a potential exhaustion point. The RSI is currently capped within a relatively tight consolidation box, with values fluctuating between the mid-60s and low-70s.
200W SMA crosses above the previous ATH
This chart illustrates the long-term price action of Bitcoin, focusing on the relationship between the 200-week simple moving average (SMA) and previous all-time highs (ATHs). Historically, when the 200-week SMA crosses above the previous cycle’s ATH, it has coincided with periods near the cycle tops. For example, in December 2017 and January 2022, the 200-week SMA moved above the prior ATH, which closely aligned with significant market peaks.
In the current cycle, however, the 200-week SMA has not yet crossed above the previous ATH from 2021, which is around $68,889.04. This is notable because, in past cycles, this crossover has typically marked the later stages of a bull run. The fact that this crossover has not yet occurred suggests that Bitcoin may still have room to move higher before reaching a new cycle top. However, it is important to recognize that this does not guarantee further upward movement. Even if Bitcoin’s price consolidates or moves sideways for an extended period, the 200-week SMA will gradually rise due to its lagging nature and could eventually cross above the previous ATH without a significant price rally.
Lets now move to the weekly charts and analyse where we are.
------------------------
Weekly timeframe
Support and resistance trendlines
This chart shows Bitcoin’s price action on a weekly timeframe, highlighting three key trendlines. Two resistance trendlines are drawn from the peaks of the last two major cycles, forming an upper boundary for price action. These lines act as potential resistance zones, indicating areas where previous rallies have topped out and where the current price could face selling pressure if it approaches these levels again.
Additionally, there is a clearly defined rising trendline that serves as bull market support. This trendline has been respected throughout the current cycle, connecting the higher lows since the market bottomed out in late 2022. As long as Bitcoin’s price continues to hold above this bull market support trendline, the overall bullish structure remains intact. This suggests that the uptrend is still healthy and that corrections or pullbacks, as long as they stay above this line, are part of a normal, sustainable bull market. If the price were to break below this support, it could signal a shift in market sentiment and potentially a deeper correction. For now, maintaining support on this trendline is a positive sign for the ongoing bull market.
Bearish divergence
The chart shows that Bitcoin has formed three consecutive price peaks, with each new high surpassing the previous one. This indicates that, from a price perspective, the market has maintained its upward momentum over this period. However, when looking at the Relative Strength Index (RSI) below the price chart, a different pattern emerges. Each time the price has made a new high, the RSI has registered a lower high, resulting in a clear bearish divergence. This is visually reinforced by the downsloping trendline that can be drawn across the RSI highs, in contrast to the uptrend in price.
Bearish divergence between price and RSI, as seen here, often signals underlying weakness in the buying momentum, even as price continues to rise. It suggests that each successive rally is being driven by less enthusiasm or participation from buyers. Given this setup, it is possible that the RSI could revisit the downsloping trendline in the near future. If this occurs, the price might make a marginally higher high, potentially forming a third peak slightly above the current level. This would maintain the divergence and could act as a warning sign for traders to be cautious about the sustainability of the current uptrend.
Stoch RSI
This chart presents the weekly price action of Bitcoin alongside the Stochastic RSI indicator. What stands out is the clear cyclical pattern in the Stoch RSI, where it tends to reach oversold levels roughly once every half year. These oversold readings have historically aligned with significant local bottoms in the price, signaling favorable buying opportunities for traders and investors. After reaching these low points, the Stoch RSI typically trends upward, eventually entering the overbought zone.
When the Stoch RSI enters overbought territory, as it does several times on this chart, it often coincides with local price peaks. These moments serve as warnings that the market may be overheated in the short term, and traders should be cautious about opening new long positions. The overbought readings suggest that a pullback or period of consolidation could be imminent, as the market works off excess bullish momentum.
Currently, the Stoch RSI is once again in the overbought zone. This suggests that Bitcoin may be vulnerable to a further pullback or at least a pause in its upward movement. While this does not guarantee an immediate reversal, it does mean that risk is elevated.
Failed breakout/liquidity grab
This weekly Bitcoin chart illustrates a strong and consistent uptrend that has been developing since late 2023. Each major move begins with a clear breakout above previous consolidation zones, followed by a retest of the broken resistance, which then acts as support, confirming the trend's strength. These retests tend to hold well, setting up for new bullish impulses.
In the earlier stages, we see BTC breaking out of a range around the $48,851 support level. After a successful retest of that zone, the price surged and entered a new consolidation phase just below $73,643. A second breakout occurred from this level, again followed by a retest that confirmed it as a new support level. This pattern reflects textbook bullish market structure: breakout, retest, and continuation.
However, the current price action shows something different. BTC has returned to its previous high around the $109,301 resistance level. Unlike the previous times, where strong bullish candles closed above resistance, this attempt has only pierced above the level with a wick, indicating potential exhaustion or hesitation. The highlighted label "Failed breakouts / Liquidity grab" suggests that these wick movements may have been attempts to trigger stop orders and gather liquidity before a possible retracement.
Now we will dive deep into the daily timeframe.
------------------------
Daily timeframe
Resistance, bullflag and Stoch RSI
This daily chart of Bitcoin reveals a period of consolidation just below a key resistance zone, which aligns with the previous all-time high area. BTC has been ranging within this red-marked resistance block, showing clear hesitation from buyers to push beyond it with conviction.
During this consolidation, a well-formed bull flag structure appeared, a bullish continuation pattern, signaling potential for further upside. The breakout from this bull flag occurred earlier this week, providing initial bullish confirmation as price pushed briefly above the upper boundary of the flag. However, the breakout lacked follow-through. Instead of sustaining momentum and closing decisively above resistance, BTC appears to have experienced a fake-out, with price now retracing back inside the prior range.
This failed breakout is particularly notable given the context of the Stochastic RSI indicator, which is currently in the overbought zone.
------------------------
4H timeframe
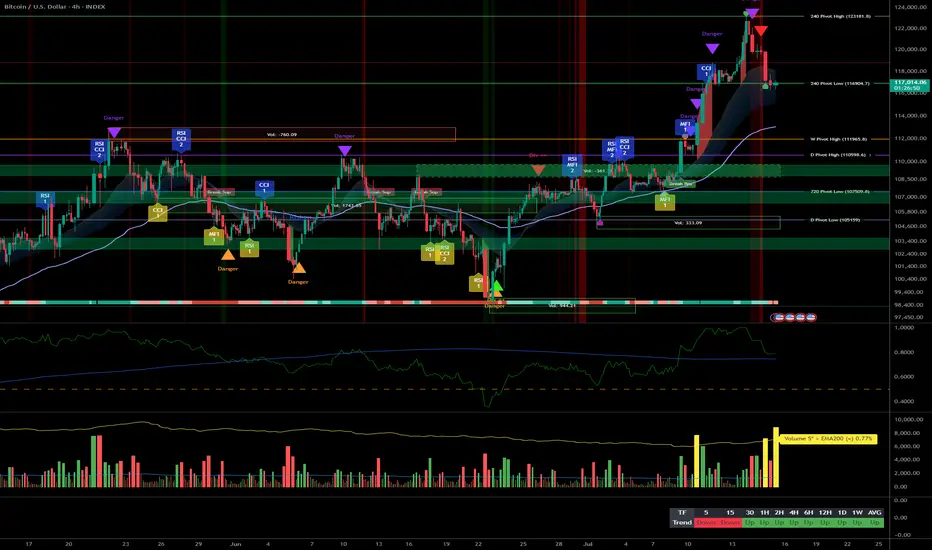
4H FVG and liquidity grab
This 4-hour chart of Bitcoin shows a clear structure where price has recently formed an equal high around the $110,612 level. Equal highs are often seen as zones where liquidity builds up, since many stop-loss orders from short positions typically rest just above them. This makes the area particularly attractive for a potential liquidity grab.
At the moment, BTC appears to be in a short-term retracement phase after rejecting from this equal high region. During this move, price left behind a bullish Fair Value Gap (FVG), which is a zone of inefficiency where price moved too quickly to fill orders. This FVG is now acting as a potential support zone. The chart suggests that BTC may revisit this FVG to rebalance before making another attempt to break through the equal highs.
If BTC can hold the FVG and generate upward momentum, a move above the equal highs becomes more likely. In that case, the resting liquidity just above those highs could be targeted, leading to a quick wick or breakout move before price potentially reverses again.
------------------------
Liquidation heatmap
1 month
This Binance BTC/USDT liquidation heatmap clearly shows that the majority of the liquidity is stacked to the upside. The bright yellow and green bands, which represent areas of high liquidation potential and leverage exposure, are heavily concentrated just above the current price levels, especially around the $111,000 to $114,000 zone. This indicates that many traders have short positions with stop-losses placed above these highs, making them prime targets for potential liquidation events.
As price moves closer to these high-liquidity zones, the probability increases that market participants, particularly larger players or algorithms, may push BTC upwards to trigger those stops and liquidate those positions.
1 week
The current price is hovering around the $108,000 range, with clear liquidity clusters forming both below and above this level. What stands out is the dense liquidation zone just below the current price, this suggests that many traders have placed long positions with stop-losses slightly under this support range. These positions create an opportunity for a liquidity sweep, where price briefly dips down to trigger liquidations, fill larger buy orders, and shake out weaker hands.
After such a sweep, the heatmap shows an even larger cluster of liquidation liquidity sitting just above the highs, especially around the $110,000 to $114,000 region. This is likely composed of stop-losses from short positions and breakout traders who entered too early. The concentration of liquidity here creates a strong incentive for price to target this zone after clearing the downside liquidity.
------------------------
Fear and greed index
Today
The Fear and greed today is at 66, meaning greed. This level suggests that market sentiment is optimistic, but not yet euphoric or irrational. In practice, it often means buyers are confident, and there’s still room for price continuation before we enter extreme greed territory
1 year chart
This chart displays the Crypto Fear & Greed Index over time, offering a visual representation of sentiment cycles in the Bitcoin market.
When examining the past year, you can see how sentiment has recovered significantly from the fear zone (below 30), especially from late 2024 into early 2025. This shift in sentiment aligned with BTC's price climbing back toward previous highs, indicating that sentiment is responding directly to price structure and bullish momentum.
------------------------
BTC exchange reserve
This chart, sourced from CryptoQuant, provides a clear visualization of the relationship between Bitcoin’s exchange reserves (blue line) and BTC price (white line), over a multi-year period. The key insight is the rapid and consistent decline in Bitcoin held on exchanges, especially noticeable from mid-2023 onward.
From around 2022, the amount of BTC on exchanges remained relatively stable. However, beginning in late 2022 and accelerating through 2023 into 2025, we see a shart and uninterrupted drop in exchange reserves.
This ongoing withdrawal trend typically signals accumulation behavior by investors. When BTC is withdrawn from exchanges and moved into cold storage or long-term wallets, it often reflects growing conviction among holders that price will rise and they don’t intend to sell in the short term.
------------------------
Final thoughts
This is a complete Bitcoin analysis for the community with a top-down analysis!
I have worked out a complete insight in the Bitcoin price with different analysis and on-chain data.
I would be excited if you boost, comment and share the analysis with your friends for the work that I have put in this analysis for everyone.
Bitcoin Robust Bullish Structure, Key Entries at 105k & 100k__________________________________________________________________________________
Technical Overview – Summary Points
__________________________________________________________________________________
Bullish momentum confirmed across all timeframes : Structure remains healthy, no behavioral anomalies detected.
Key supports: Main HTF pivot around $98,000–$100,000; first intermediate support zone at $105,000.
Major resistances: Critical area between $109,000 and $112,000, dense pivot and volume profile confluence.
Volumes: Normal to very high depending on TF, no speculative excess; gradual rise hints at possible expansion phase.
Risk On / Risk Off Indicator : Strong Buy from daily to 1H, shifting to neutral on shorter timeframes (30min–15min).
ISPD DIV/Mason's line: Predominantly neutral histogram, no overheat or capitulation detected.
Multi-timeframe behavior: Robust underlying structure, increased volatility but no massive selling stress.
__________________________________________________________________________________
Strategic Summary
__________________________________________________________________________________
Global bias: Bullish dominance as long as $98k–$100k holds.
Opportunity zones: Buy on pullback to $105k, swing confirm above $111k with volume/ISPD validation.
Risk / Invalidation: Stop loss below $98k; extra caution on macro/Fed events.
Macro catalysts: Fed/NFP-US (July 2–4), monitor behavior via ISPD DIV (blue to red).
Action plan: Structured and tactical long bias, “no trade” zone before major US releases, immediate stop on support break.
__________________________________________________________________________________
Multi-Timeframe Analysis
__________________________________________________________________________________
1D: Bullish momentum, no overheat. Pivot 98–100k = strategic fallback.
12H–6H: Signs remain bullish, no anomalies, intermediate supports at 105–107k.
4H–2H: Positive consolidation, rising volumes; possible accumulation on 105k dips.
1H–30min: Multiple resistances under 110–112k, very high volumes, maintain vigilance for sudden spikes.
15min: Extreme volatility, but no clear seller excess; watch for “trap” formation.
Risk On / Risk Off Indicator : Strong Buy on main timeframes, shifting to neutral/buy on 30min/15min (breather zone).
ISPD DIV/Mason's line: No buyer capitulation, overall neutral histogram.
Summary: Bullish cross-timeframe alignment, only macro events may trigger a break.
Key economic calendar
- 07/02: Powell speech – Potential added risk-on boost.
- 07/02: US tariff updates – Possible volatility.
- 07/04: NFP, ISM... High expected volatility.
Action : Heightened caution pre-announcements, validate through volume/ISPD.
On-chain: Dominant HODLing, no dumping, stable institutional volume.
Macro: Fed, inflation, geopolitics under watch.
Tactical: Spot any warning via ISPD or volume cluster.
__________________________________________________________________________________
Conclusion & risk management
__________________________________________________________________________________
Strong bullish bias as long as $98k–$100k holds .
Optimal buy on $105k/$100k dips, swing confirm on $111k break .
Outside of US events: strict tactical discipline required .
Absolute invalidation zone: break below $98k (HTF + STH cost-basis) .
Remain vigilant for ISPD red + volume spike / macro headlines .
__________________________________________________________________________________

Bitcoin Uptrend Momentum, Key Buy Zone at 106.3K–105.9K__________________________________________________________________________________
Technical Overview – Summary Points
__________________________________________________________________________________
Momentum : Uptrend confirmed across all timeframes ≥1H; no signs of exhaustion or overheating.
Major supports : 106,319, 99,581, 98,133 USD
Major resistances : 108,239, 108,685, 111,949 USD (ATH)
Volume : Normal on higher TFs, very high on 30min/15min (potential breakout or institutional shake-out).
Behavior : Risk On / Risk Off Indicator = Strong Buy from 1D to 1H, neutral on 15min; ISPD DIV neutral across all TFs (no extreme behaviors).
__________________________________________________________________________________
Strategic Summary
__________________________________________________________________________________
Bias : Bullish as long as 98,133 is held on daily closes; structural buying pressure confirmed.
Opportunities : Swing accumulation on pullbacks to 106,319–105,900; targeting 108,700 then 111,949 on breakouts.
Risk : Geopolitical catalyst or break below D Pivot Low 98,133.
Macro catalyst : No major events (Fed, CPI, NFP) over the next 48h. Watch Powell’s speech (2 July).
Action Plan : Long entry on pullback to 106,300–105,900, stop <105,900, targets at 108,700 then 111,900. Exit on daily close below 98,133.
__________________________________________________________________________________
Multi-Timeframe Analysis
__________________________________________________________________________________
1D – Daily : Strong uptrend; balanced volumes; supports at 98,134 / 99,581; resistance at 108,239–111,949.
12H/6H/4H : Positive confluence. Accumulate on any return to support; no behavioral excesses detected.
2H–1H : Rising volumes, no divergences; strong timing for entries on dips.
30min/15min : Very high volume (breakout/shake-out); structure remains bullish. 15min Risk On / Risk Off Indicator =Neutral → watch for short-term consolidation or traps but broader trend holds.
Clear bullish confluence on all TFs ≥1H, with no behavioral or macro warning.
Short-term risks on micro-TFs (extreme volume, possible shake-out).
Accumulation zone on 106,300–105,900 pullbacks, invalidation below 98,133.
__________________________________________________________________________________
Cross-Analysis & Strategic Synthesis
__________________________________________________________________________________
Trend : No reversal signals. All indicators (volume, price action, Risk On / Risk Off Indicator) point to trend continuation.
Macro & newsflow : Monetary status quo, no negative catalyst in the short term. Only open risk: geopolitical tensions, closely monitored.
On-chain & fund flows : Ongoing ETF inflows, stable capitals, strong HODL trend, SSR stable.
Risk management : Stop <105,900, hedge on geopolitical signals.
Summary:
All TFs ≥1H aligned in bullish cycle, corrections = structured long accumulation opportunities.
Key buy zone: 106,300 – 105,900; prudent stop <105,900; main targets 108,700 and ATH.
Closely monitor for Powell/Fed headlines.
__________________________________________________________________________________

Critical Range 106,036–108,300, Sector Support Remains Bullish__________________________________________________________________________________
Technical Overview – Summary Points
__________________________________________________________________________________
Momentum: Bullish across all timeframes ≥1H (MTFTI UP); corrective compression seen on 15m/30m as short-term selling momentum decelerates.
Support/resistance: Major defensive cluster at 106,036–106,210; multiple resistances at 108,272/108,790 and 110,530–111,980. No excesses or validated breakdowns.
Volume: Historical average across all timeframes, no abnormal flows, no signs of euphoria.
Risk On / Risk Off Indicator: "Strong Buy" signal on all timeframes except 15m (neutral); sector momentum confirmed, software leadership maintained.
Investor behavior (ISPD DIV): Mostly neutral except for a micro-buy on 15m, no extremes of fear or euphoria.
__________________________________________________________________________________
Summary
__________________________________________________________________________________
Global bias: Remains bullish in the medium term, mature range, no imminent trigger catalysts.
Opportunities: Technical bounce/entry favored on 106,036–106,210 if support cluster holds and ISPD DIV validated. Conservative profit-taking below 108,000–108,300.
Risk areas: Confirmed breakdown (1H/4H close <106,036 with high volume and MTFTI reversal). Recommended stop <105,900.
Macro catalysts: Awaiting US data (PMI/ISM/JOLTS). Watch for macro surprises or FOMC. Low expected volatility until late July.
Action plan: Range-buy near support cluster, active stop/profit management, volume watch, confirm with intraday micro-signals.
__________________________________________________________________________________
Multi-Timeframe Analysis
__________________________________________________________________________________
1D: Consolidating below major resistance >110k. Momentum and Risk On / Risk Off Indicator solid. No volume catalysts.
12H–4H: Bullish structure preserved, compression under resistance, supports holding (106k–106.5k), average volume.
2H–1H: Compression, repeated tests of 106,036 support, buying appears at each rebound; no clear selling continuation.
30min–15min: Technical correction, micro-bearish divergence on Risk On / Risk Off Indicator, but ISPD DIV buy marker on 106,036–106,210 cluster. Stable volume.
Summary: All ≥1H timeframes are bullish; 15m/30m show corrective compression in a mature, defended range.
Strategic Outlook:
- BTCUSDT continues to consolidate in a mature range with a multi-frequency support cluster at 106,036–106,210.
- Broadly UP trend, robust Risk On / Risk Off Indicator, no exogenous catalysts.
- Opportunity zone on cluster support test; confirm any bounce with returning flows or 15m behavioral signal.
- Key stop <105,900, progressive profit-taking below 108,000–108,300.
- Macro watch (PMI, ISM, FOMC) essential to anticipate volatility pickup or trend change.
On-chain / Macro: No short-term systemic risks. General wait-and-see, no stress or euphoria. Consolidative setup.
Risk / Reward: Adjust leverage and strict risk control; ratio ≥3:1 maintained as long as cluster support holds.
Recommended management: No chasing, favor range-buy approaches, dynamic stops, and gradual profit-taking on resistance.
__________________________________________________________________________________

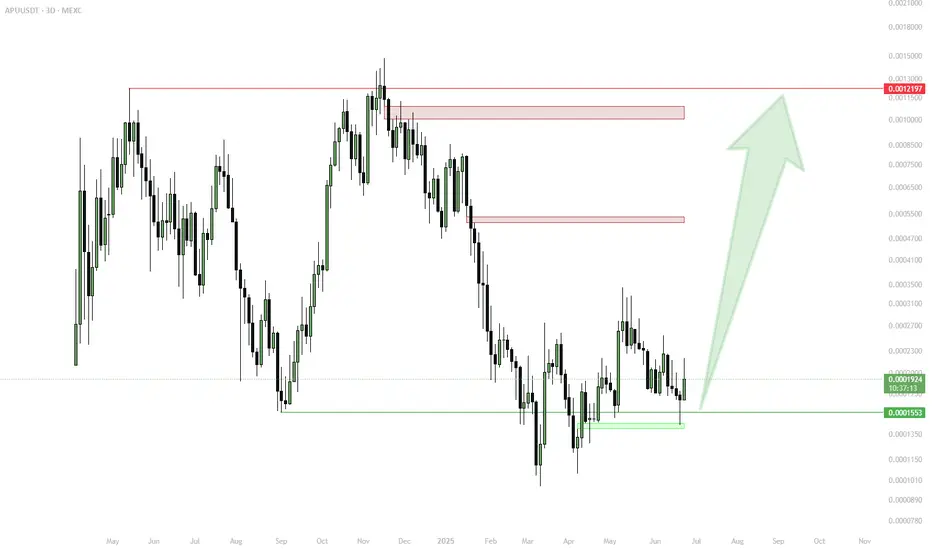
APU Spot Entry — Following Smart Money, Eyeing Meme Rotation✅ Entry based on smart money signal, positive meme sentiment
✅ Strong support at 0.0001548–0.0001553
✅ Upside targets: 0.00052, 0.00112, main at 0.00122
Active Plan:
Hold spot as long as 0.0001548 holds and meme rotation remains strong
Watch for reaction at support to add or manage risk
Monitor meme sector for continued momentum
Profit Targets:
Partial profit: 0.00052 / 0.00112
Main target: 0.00122
🚨 Risk Warning:
Close spot if support at 0.0001548 fails or meme trend weakens
Avoid averaging down below key support
BTC multi-timeframe: bullish momentum and strong support zones__________________________________________________________________________________
Technical Overview – Summary Points
__________________________________________________________________________________
Momentum: Clear bullish bias across all timeframes (MTFTI Up everywhere except 5min). Weak selling pressure, no distribution or capitulation signals.
Support/Resistance: Key resistances: 110647–109554 (HTF). Major supports: 102756 (D Pivot Low), 98330 (720 Pivot Low). Multiple buy zones on retracement.
Volume: Recent volumes below "extreme" threshold, no euphoria/capitulation detected.
Multi-TF Behavior: Global bullish alignment, volatility present intraday, but no confirmed reversal risk. Risk On / Risk Off Indicator shows no major anomaly.
__________________________________________________________________________________
Strategic Summary
__________________________________________________________________________________
Strategic Bias: Structurally bullish market. Prioritize tactical buys on pullback, active risk management.
Opportunities: Reinforce long positions on $106k/$103k/$100k retrace. Partial targets below 110–111k.
Risk Zones: Rejection under 106500–107000 with extreme volume spike = short-term top signal. Invalidation if H1 < 106k or H4 < 102.7k.
Macro Catalysts: US calendar (GDP, durable goods, jobless claims), geopolitics (Russia/Ukraine). No systemic alert, but caution required.
Action Plan: Filter entries on technical supports, exit on extreme sell volume or macro shock.
__________________________________________________________________________________
Multi-Timeframe Analysis
__________________________________________________________________________________
1D: Compression below historical resistances (109–111k), solid momentum, potential buy zone 102750–98330.
12H: Multiple resistances, uptrend, support confluence 102756–106530 pivot key.
6H: Price under resistance cluster (106530), possible profit-taking on rejection, strong support 102756.
4H: High-range structure, reinforced supports, next breakout could trigger acceleration with volume.
2H: Pivot zone 106500–107200, caution below close, buy zone on correction.
1H: Support stacking structure, no clear breakdown, critical node, aggressive buy 106100–105800.
30min: Compression at range high, caution on buying resistance, key spots 106000/104500.
15min: Possible buyer exhaustion under 108k, tactical buy on support 106000–106500 if confirmed.
Summary: Strong bullish alignment, same key supports, no panic. Risk On / Risk Off Indicator neutral, controlled market, possible whipsaw on short-term TFs but no major reversal sign.
__________________________________________________________________________________
Macro, News & On-Chain Analysis
__________________________________________________________________________________
Macro: Fed and traditional markets calm, no monetary alert. Israel/Iran ceasefire, increased volatility in Europe (Russia/Ukraine). Moderate risk-on sentiment.
Calendar: June 26: US durable goods/GDP/jobless claims (potential volatility).
On-chain: BTC range $100–110k, fundamental support $93–100k, no panic/capitulation. Low spot volumes, bullish digestion phase.
__________________________________________________________________________________
Conclusion
__________________________________________________________________________________
Dominant bias: Up/moderately bullish in short term, focus on retracement buying.
Risk management: Stop H4 < $102.7k, H1 < $106k, scalping: break of 106k with extreme volumes.
Action zones: Reinforce on $106k/$103k/$100k retrace, partial TP below 110–111k, extension if confirmed breakout.
Monitor: Volume, support reactions, macro catalysts.
Summary:
Technical and on-chain context remains bullish; best approach is tactical buying on pullback with dynamic stops. Stay agile in case of extreme selling volume or macro shocks. Act on signals, protect capital.
__________________________________________________________________________________
Upward Momentum, Caution Near 106,500–110,000 Resistance__________________________________________________________________________________
Technical Overview – Summary Points
Momentum: Strong bullish bias on mid/long-term (1D-4H), short-term "Down" divergences (1H/2H). Overall alignment, no capitulation/euphoria signals.
Key supports / resistances: Supports at 103,300/102,600 (D Pivot Low, 720 Pivot). Major resistances: 106,480–109,952. Price compression under daily/weekly resistance, technical rejection risk.
Volumes: Normal to moderately high, 1H abnormal volumes signal possible squeeze.
Multi-TF: Bullish confluence 1D–6H, short-term Down divergences, caution required for late long entries under resistance.
Risk On / Risk Off Indicator: "Strong Buy" signal consolidated across all timeframes except 15min (neutral ST), sector bullish.
ISPD DIV: Neutral on all TFs – no behavioral overheating or exhaustion.
__________________________________________________________________________________
Strategic Summary
Overall bias: Bullish HTF setup (1D–4H), buy opportunities on dips towards 103,300/102,600, stop <102,000.
Risk zones: 106,480–109,950 = resistance cluster, active management required. Technical invalidation below 102,000.
Macro catalysts: Window of increased volatility 15:00–16:00 UTC (CB Consumer Confidence & Powell speech). Middle East geopolitics = “wildcard”, caution on any escalation.
Action plan: Buy on pullback, manage actively >106,000, mandatory protection during news hours, reassess post-macro-volatility.
__________________________________________________________________________________
Multi-Timeframe Analysis
1D & 12H: Upward momentum confirmed, solid supports, no exhaustion signals, Risk On / Risk Off Indicator "Strong Buy".
6H–4H: Technical and behavioral confirmation, constructive volumes, caution near immediate resistances.
2H–1H: Short-term downside divergence, 1H very high volumes = potential squeeze or shakeout, active caution required under resistance.
30min–15min: Consolidation/digestion; Risk On / Risk Off Indicator neutral at 15min, no impulsive entry point yet.
Summary: Robust up-structure on HTF, buy-side strategies on dips favoured, active management imperative near resistance and macro volatility events.
__________________________________________________________________________________
Fundamental, On-Chain & Macro Risks Analysis
Macro news: No immediate catalysts except USD news (CB Consumer Confidence, Powell) at 15:00-16H00 UTC, source of temporary volatility – no prevailing trend in question at this stage.
On-chain / Market: High volumes, institutional leadership, no “retail” panic, no flush/fomo, healthy structure.
Leverage: OI >$95B, stablecoin dominance, risk contained except on external triggers (macro, geopolitical).
Geopolitics: Middle East context = spike risk, active management mandatory on escalation.
__________________________________________________________________________________
Summary:
• Dominant bias Up (buy on dips >102,600), active management below major resistances (106,500–110,000).
• Key stop <102,000 (invalidation).
• Increased risk window: 15:00–16:00 UTC (USD news).
• Monitor leverage, adjust exposure ahead of key catalysts.
Bitcoin Key $103K Supports Tested, Swing-Bullish Opportunity?__________________________________________________________________________________
Technical Overview – Summary Points
__________________________________________________________________________________
Strong bullish momentum on daily, fueled by the Risk On / Risk Off Indicator and MTFTI structure.
Major supports identified at $102,600 – $103,300, high confluence (4H, 12H, 1D).
Resistances clustered between $106,000 and $110,000 (240 & D Pivot High, W Pivot High).
Volumes generally neutral; no buyer/seller climax.
Directional trends diverge: overall swing remains bullish, short-term intraday still corrective.
__________________________________________________________________________________
Strategic Summary
__________________________________________________________________________________
Global Bias: Structured bullish as long as supports >$102,600 are preserved.
Opportunities: Longs on retest of major supports, favoring daily/4H trend-following. Reactive shorts only on rejection at $104,500–$106,000.
Risk zones: Below $102,600 = structure break. Prioritize cash/hedging.
Macro catalysts: Waiting for September FOMC. Monitor geopolitical risks (MENA).
Action plan: Gradual entries on pullbacks, disciplined stops below pivots, prudent sizing outside confirmed breakouts.
__________________________________________________________________________________
Multi-Timeframe Analysis
__________________________________________________________________________________
1D & 12H : Bullish trend confirmed by the Risk On / Risk Off Indicator and MTFTI. Major supports intact ($102,600–$103,300). Volumes neutral, market in wait mode. Swing long favored.
6H & 4H : Upward momentum, no significant bearish signals. “Buy the dip” valid above support; healthy structure as long as key levels hold.
2H, 1H : Early micro-divergence signals (MTFTI Down short term), increased caution. Favor entries on confirmed correction or breakout only.
30min, 15min : Intraday correction, neutral/bearish volumes, aggressive long setups discouraged. Scalping only on exhaustion spikes, strict stops.
ISPD DIV summary : No excess/panic, mature consolidation/range context.
Risk On / Risk Off Indicator summary : Bullish across all TF except very short-term (>15min neutral).
__________________________________________________________________________________
Fundamental & On-chain Synthesis
__________________________________________________________________________________
Fed: status quo, US macro softening, market waiting.
Geopolitical tensions: potential for increased volatility.
On-chain: institutional predominance, low network pressure, no panic selling or retail euphoria.
Off-chain: high derivatives volume, OI > $96B. Squeeze risk if catalyst emerges.
__________________________________________________________________________________
Decision Matrix – Execution Plan
__________________________________________________________________________________
Swing Long: Entry $103,200 – $103,800, stop <$102,400, target $107,000+ (RR>2:1)
Scalping Short: On confirmed rejection $104,500 – $106,000, stop >$106,400, target $103,400 (RR>1.5:1)
Strict risk management below major supports, position proactively on volatility/news.
Cash/out below $102,400 or with major geopolitical headlines.
Stay flexible; alternate range-buy/take profit until breakout volume or FOMC news.
__________________________________________________________________________________

Bitcoin Multiframe: Key clusters to watch before FOMC__________________________________________________________________________________
Technical Overview – Summary Points
__________________________________________________________________________________
Momentum: Dominant bullish structure across all major timeframes (MTFTI = Up).
Supports/Resistances: No HTF pivot engaged; key on-chain support at $97.6k, resistance at $115.4k.
Volume: Central oscillation within range; no major surges observed, consolidation on micro-TF.
Multi-timeframe behaviors: Bullish structure dominates, technical pullback on 4H-1H-15min without major breaks.
__________________________________________________________________________________
Strategic Summary
__________________________________________________________________________________
Overall Bias: Structurally bullish as long as key supports hold (97.6k–104.5k zone).
Opportunities: Buy confirmed dips on on-chain cluster/H4-H2 area, target 110–115k extension post-FOMC positive catalyst.
Risk zones: Extreme volatility expected around FOMC (June 17–18); strict risk management, avoid overexposure.
Macro catalysts: FOMC (rate decision, dot plot), Fed leadership stability, Israel-Iran geopolitical tensions.
Action plan: Patience until FOMC; favor setups on clear price reaction, tight stops below 97.5k (on-chain support).
__________________________________________________________________________________
Multi-Timeframe Analysis
__________________________________________________________________________________
1D: Bullish momentum, price at range center ($106k). Watch for pivot break.
12H: Persistent bullish bias, confluence with 1D.
6H: Expected consolidation, bullish structure.
4H: Technical pullback, bullish structure remains. Key anticipated support 105k–104.5k.
2H: Likely move towards lower range. Up bias confirmed.
1H: Technical correction within overall Up trend.
30min/15min: Seller sequence, trend intact, no major break.
Risk On / Risk Off Indicator remains “Up” across all frames, boosting the positive view despite short-term correction.
Executive summary:
Strong bullish convergence from Daily → 15min timeframes.
Ongoing short-term pullback, no HTF pivot breaks.
Any break below $97.6k would invalidate the swing bullish scenario.
__________________________________________________________________________________
Macro, Economic Calendar, On-chain & Risk Management
__________________________________________________________________________________
Macro:
FOMC imminent (June 17–18): waiting – volatility on rate/dot plot.
Geopolitical risk (Iran-Israel): sustained global risk-off may escalate.
BTC shows strong resilience at 106k.
Economic calendar (key points):
June 17–18: FOMC — maximum impact (stocks, FX, crypto)
June 17: Fed leadership rumors — potential volatility, BTC stable
June 17, 08:30 UTC: USA — retail sales (May/core)
On-chain:
Key support at $97.6k (STH cost basis), resistance at $115.4k.
Long-term holders are distributing, but bullish accumulation pressure intact.
Clustering may amplify short-term directional moves.
Key scenarios:
Bullish: Extension to 110–115k if FOMC positive, stop below 97.6k.
Bearish: Break of 97.6k = risk of drop towards 92.9–95.4k.
Management: Avoid exposure pre-FOMC, active monitoring, strict stops.
Patience & discipline: Only size up with post-FOMC validated reaction or confirmed breakout. On-chain cluster = invalidation radar for bullish bias.
__________________________________________________________________________________
BTC/USDT: Sector Momentum and Decision Zone Ahead of the Fed__________________________________________________________________________________
Technical Overview – Summary Points
➤ Strong multi-timeframe bullish momentum, confirmed by the Risk On / Risk Off Indicator signaling “Strong Buy” across all timeframes (daily, 12H, 6H, 4H down to intraday).
➤ Major supports (102,600–104,250 $) act as the market’s anchor; the 105,800–106,100 $ resistance remains the key level to break for a confirmed further bullish leg.
➤ Volumes are weak to normal, with no recent distribution, climax, or panic/extreme behavior (ISPD DIV neutral); market remains rational.
➤ Short-term TFs (1H, 2H) are more hesitant—favoring consolidation/range, suitable for scalping or risk management rather than directional breakout trades.
__________________________________________________________________________________
Strategic Summary
➤ Dominant bullish technical context, but facing key resistance, with macro and on-chain signaling for active caution.
➤ Opportunity: Buying pullbacks on 104,250–102,600 $, targeting extension if clean breakout above 106,100 $. Partial profit-taking into the 110–111k $ highs.
➤ Risk zone: Invalidation if there is a decisive break <102,000 $ or major red volume climax on failed resistance retest.
➤ Key catalysts this week: Fed/FOMC decision, major geopolitical events.
➤ Plan: Favour methodical accumulation pre-Fed, reinforce/swing post-announcement according to technical resolution.
__________________________________________________________________________________
Multi-Timeframe Analysis
1D : Trading below broad 105,800–111,000 $ resistance, Risk On / Risk Off Indicator strongly positive, normal volumes, no euphoria (ISPD DIV neutral). Healthy structure, upward bias confirmed.
12H/6H : Consolidation at major support; recent rebounds from 102–104k, no exhaustion signals. MTFTI Up but 2H-1H corrective divergence.
4H/2H : Range market, major supports defended, no breakout yet. MTFTI locally Down, indicating mild internal corrective dynamic.
1H/30min/15min : Intraday range, technical micro-bounces, weak directional bias, moderate volumes, no abnormal behavior. Scalping preferred below resistance, rigorous risk management.
Risk On / Risk Off Indicator : Strong aligned buy signal across all TFs, sector environment supportive.
__________________________________________________________________________________
Multi-Timeframe Key Points Summary
Strong bullish market, behavioral and technical stability.
Breakout >106,100 $ = legitimate bullish extension, 110k+ target.
Invalidation below 102k $: go to cash, wait for stabilization.
Volatility expected around (Fed/geopolitical) events: adjust sizing/stops accordingly.
__________________________________________________________________________________
Fundamental, Macro & On-Chain Analysis
Fed (FOMC June 17–18): Major breakout/volatility catalyst.
Geopolitical tensions (Israel/Iran): Risk-off spikes expected, watch liquidity zones.
On-chain: Key support at 100–102k $; no major distribution, long-term holders remain strong, options/futures point to underpriced volatility risk.
Strategy: Prefer gradual accumulation on supports, reduce exposure pre-Fed, confirm new swings post-FOMC.
__________________________________________________________________________________
Action Plan Summary
Accumulate on pullback 104,250–102,600 $, stop below 101,900 $.
Breakout >106,100 $: Target 110k–111k $, partial TP, monitor volume/volatility.
Avoid overtrading pre-FOMC or amid major geopolitical news.
Risk/Reward >2 on pullback – strict management mandatory.
__________________________________________________________________________________
Conclusion & Context Mastery
The market remains structurally bullish and supported by the combination of technical, sector and on-chain factors. However, macro/geopolitical volatility requires increased caution as the FOMC approaches. Focus on support entries, avoid chasing resistance until confirmed, and apply tight stops in this catalyst-rich context.
__________________________________________________________________________________
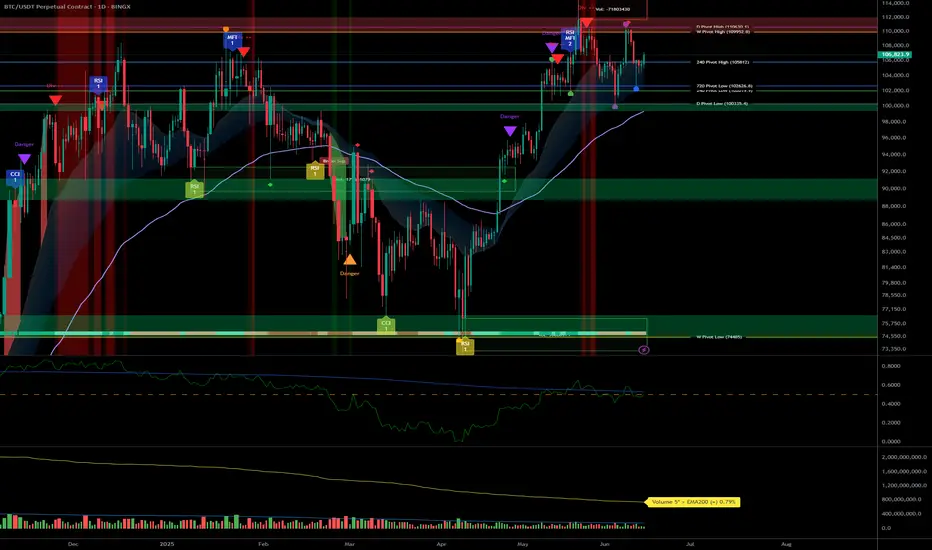
BTCUSDT: Pro Analysis, Major Swing Supports, Risk Focus__________________________________________________________________________________
Technical Overview – Summary Points
__________________________________________________________________________________
Momentum & Trends : Short-term consolidation (<1H frames), dominant uptrend 2H–1W. BTC market structure is “Up” across all higher timeframes.
Supports/Resistances :
Major supports: 100,300 – 101,600 USDT (1D/4H/2H pivots)
Resistances: 109,000 – 111,500 USDT (1D/W/12H pivots)
Volume : Recent bearish climax absorbed, back to normal volumes, no current excess.
Multi-TF Behavioral Read : Behavioral indicators (ISPD DIV) are neutral; no extreme sentiment. Risk On / Risk Off Indicator confirms structural buy-side.
__________________________________________________________________________________
Strategic Summary
__________________________________________________________________________________
Global Bias : Bullish trend on high TFs, technical consolidation short term.
Opportunities : Swing entries on return ≥101.6k, TP at 109k/111.5k. Manage position sizes actively before Fed.
Risk Zones : Invalidation <100.3k daily; key area to monitor. Short-term stop-loss below 99.9k.
Macro Catalysts : FOMC (June 17–18) = expected volatility, no major macro risk now. Watch Mideast tensions. Rising tensions in the Middle East (Israel/Iran): volatile climate, potential risk-off sentiment on certain assets, but no widespread panic; to be monitored in case of rapid escalation (possible increased BTC volatility).
Action Plan : Favor gradual entries on major supports, reduce leverage pre-macro events, active volatility and stops monitoring.
__________________________________________________________________________________
Multi-Timeframe Analysis
__________________________________________________________________________________
1D / 12H: Key support at 100.3k–101.6k, major resistance 109–111.5k. Repeated rejections at resistance, mature range. Normal volume, consolidating momentum.
6H / 4H: Strong lateral structure, ISPD/Volume neutral. Technical play around 101.6k, gradual profit-taking below 109k.
2H / 1H: Start of institutional reaction (moderate to high volumes). Bearish climax absorbed, possible short-term rebound at local support 99.9k–101.6k.
30min / 15min: Micro-range, short-term consolidation, some volume spikes on corrections. Downtrend confirmed on lower TFs, despite macro/swing bullish confluence.
ISPD & Risk On / Risk Off Indicator Summary:
ISPD DIV = Neutral across all timeframes.
Risk On / Risk Off Indicator = STRONG BUY on all horizons (US tech strong).
Cross-timeframe Synthesis : BTC market is accumulating on supports under favorable tech sector influence. Short-term consolidation seen as post-shakeout setup for potential resumed uptrend.
__________________________________________________________________________________
Final Synthesis & Operational Plan
__________________________________________________________________________________
BTC market remains in a dominant swing bullish bias, supported by tech sector momentum and on-chain inflows. Key support zones (100.3–101.6k) offer attractive technical swing entries, with targets at 109–111.5k. However, strict risk management is essential ahead of the upcoming FOMC, rising Middle East tensions (Israel/Iran), and the potential for sudden volatility spikes.
Strategy: Maintain bullish exposure with partial profit-taking and reduced leverage into macro/geopolitical events. Systematic stops remain below 99.9k.
__________________________________________________________________________________

BTCUSDT: Strong bullish trend, 102k–106k supports heavily defend__________________________________________________________________________________
Technical Overview – Summary Points
__________________________________________________________________________________
Momentum : Bullish trend remains dominant from 1D down to 1H. Corrective consolidation on shorter timeframes (15/30min).
Key supports/resistances : 102,000, 104,800, 106,000 (key supports) – 109,500, 110,800–111,000 (major resistances and ATH zone).
Volume : Normal to moderately high depending on local volatility. No climax or distribution/absorption anomalies.
Multi-TF behaviour : Risk On / Risk Off Indicator at “Strong Buy” across all >2H timeframes, ISPD DIV neutral, no detected capitulation or excess behaviour.
__________________________________________________________________________________
Strategic Summary
__________________________________________________________________________________
Global bias : Strongly bullish on swing/daily horizon, healthy consolidation on short timeframes.
Opportunities : Favour swing entries on retests of 102k–106k supports, dynamic stops below 102k.
Risk zones : Break and close below 104,800, especially 102,000 = bullish bias invalidated.
Macro triggers : FOMC unchanged, stable US context, focus on upcoming inflation/employment data.
Action plan : Actively monitor pivot zones and on-chain behaviour; act on confirmed breakout signal or deep retest.
__________________________________________________________________________________
Multi-Timeframe Analysis
__________________________________________________________________________________
1D / 12H : Pivot support at 102k–106k, resistance 109.5k–111k. Bullish bias maintained, no excess volume, Risk On / Risk Off Indicator confirmed “Strong Buy.” Market remains mature, no concerning distribution.
6H / 4H : Structured supports 104.8k–106k, resistances 108.3k–110.8k. Healthy consolidation, swing buyers strong.
2H / 1H : Dense supports 105.6k–106.2k, barrier 109.5k–110.8k. Positive momentum, no extreme ISP/volume signals.
30min / 15min : MTFTI “Down” trend—micro-consolidation after extension. No stress, digestion/reload phase.
Multi-TF summary : Strong bullish alignment above 1H. Micro TFs in low-risk consolidation—entry opportunity on clear retracement.
__________________________________________________________________________________
Cross-analysis, synthesis & strategy
__________________________________________________________________________________
Confluences : Stable macro, on-chain & technical supports aligned, no panic or excess volume. Risk On / Risk Off Indicator “Strong Buy” dominates daily/swing horizons.
Risks/unexpected : Potential sharp volatility if breakout >111k or sub-102k support break.
Optimal plan : Defensive buying on support, tight stop <102k, active management post-macro data.
On-chain : Strong recovery since $101k, matured supply, solid STH cost basis at $97.6k.
Caution window : Wait for US data release before heavy positioning; favour scalping/swing on confirmed signal.
Objective : Leverage multi-indicator confluence, stay flexible/reactive if structural break.
BTC market retains strong bullish markers on all ≥1H timeframes. No behavioural or volume stress. Best approach: defensive buys near supports, tight stops, watch for macro releases. Stay reactive to ATH breakout or support break—act on confluence, adjust if structure fails.
__________________________________________________________________________________
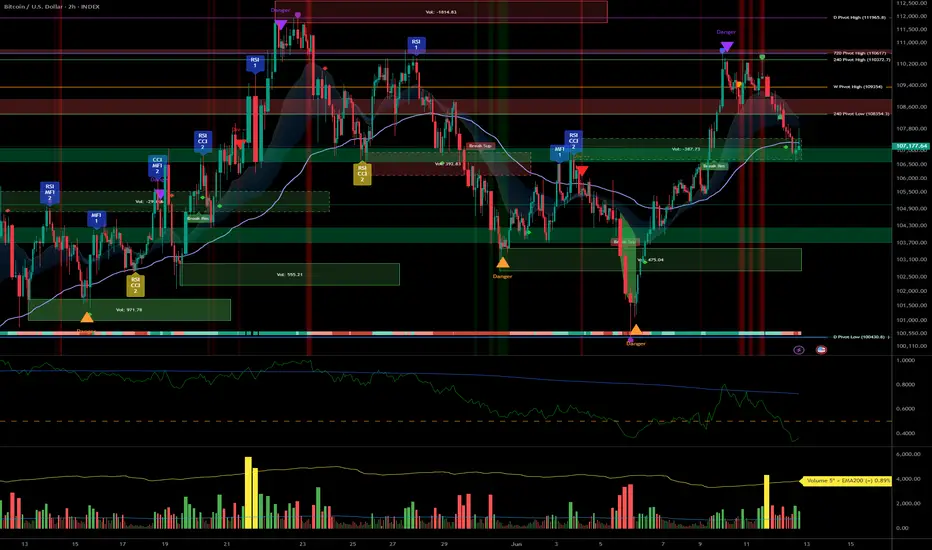
BTC: Strong bullish trend, key resistance 111–112k in focus__________________________________________________________________________________
Technical Overview – Summary Points
__________________________________________________________________________________
Strong bullish momentum across all timeframes (1D to 15min).
Major supports: 100335, 104940, 106743 – multi-timeframe confluence, natural risk management levels.
Key resistances: 109952 – 111949 (historical pivot zones).
Risk On / Risk Off Indicator clearly favoring "Risk On" (strong buy). Tech sector in leadership mode, favorable context.
Volumes normal to moderately elevated, no major behavioral anomalies (ISPD DIV neutral).
No significant divergence between technical and behavioral indicators detected.
__________________________________________________________________________________
Strategic Summary
__________________________________________________________________________________
Overall bias : firmly bullish, but tactical caution just below 111,000–112,000.
Opportunities : prioritize buys/reloads on pullbacks to 104,900–100,300.
Risk zones : clean break below 103.7k ⇒ risk of acceleration to 95.6k; invalidation if daily close <103,700$ or >2 sessions <97,100$.
Macro catalysts : Fed decision (06/18), US CPI (06/12), Trump speech (06/10); anticipate higher volatility.
Action plan : engage tactically below resistance; recommended swing stop-loss at $97,000; active management after each catalyst event.
__________________________________________________________________________________
Multi-Timeframe Analysis
__________________________________________________________________________________
1D : Massive support 100k-103k, critical resistance 111–112k. Robust momentum and context, no behavioral overheating.
12H : Steady staircase progression, intermediate supports respected (104940–106743), healthy volumes, ongoing up-trend.
6H : Bullish background, no excessive flow or defensive behavioral signals.
4H : Resistance zone test (111949–109952), structure remains solidly up, no reversal detected.
2H : Slightly rising volumes on resistance test, no behavioral excess. Positive momentum.
1H : Active resistance test, moderate volumes. Bullish structure intact.
30min : Micro-consolidation below resistance, no excessive volume/behavior. Trend up.
15min : Volume spike on last upward move, rapid normalization. Reload possible if breakout above 110k is confirmed.
Multi-timeframe summary : Bullish confluence, no strong reversal signal as long as support at 103.7k holds.
Risk On / Risk Off Indicator : Strong buy, tech sector leading, no structural risk detected in capital rotation.
__________________________________________________________________________________
Synthesis & Decision-Making
__________________________________________________________________________________
Dominant structure : BTC market structurally bullish, supported by multi-timeframe converging supports and solid tech sector.
No behavioral anomaly (ISPD DIV neutral); volumes under control; only vigilance below 111–112k due to matured seller pressure.
Macro context : Fed’s rates unchanged expected, major catalysts nearing with potential for significant volatility.
On-chain analysis : active distribution from long-term holders, critical area 103.7k–97.1k, demand must absorb “long-duration” supply.
Trading recommendation : favor buys/reloads on pullback (104,900–100,300); tactical caution under 111–112k; swing stop-loss at $97,000 advised.
BTC structurally bullish, but approaches a critical phase: robust multi-timeframe supports, positive macro momentum, no excessive behavioral exuberance. Heightened vigilance required below 111–112k due to pressure from long-term holders; dynamic risk management needed around major macro events.
__________________________________________________________________________________

Bitcoin Strong Momentum Below Key Resistance__________________________________________________________________________________
Technical Overview – Summary Points
__________________________________________________________________________________
Momentum: Strong bullish momentum across higher timeframes. Generalized “Up” alignment via MTFTI, strong leverage from the Risk On / Risk Off Indicator (Strong Buy on all timeframes except temporary 2H Down).
Supports / Resistances: Price evolving just below major resistances (107643.9, 109952.8, 111949) and holding above key defensive zones (104940/105287.8, then 100353/100335).
Volumes: Average on higher timeframes, very high/accelerating on 30min/15min (potential buying climax or local volatility spike).
Multi-TF/ISPD DIV Behaviour: ISPD mostly neutral, but “Sell” warning on 30min during volume peaks (risk of quick profit-taking or fake breakout).
__________________________________________________________________________________
Strategic Summary
__________________________________________________________________________________
Global Bias: Ultra-bullish. Momentum structure supported by technical/sectoral/on-chain convergence.
Opportunity: Buy on defended pullbacks (support 104940/105287.8) or daily confirmation > 107700. Extension toward 109950–111949 upon pivot breakouts.
Main Risk: Extreme volumes + ISPD Sell alerts (30min) = caution, speculative excess/whipsaw possible, quick profit-taking, lack of macro catalyst (weekend proximity).
Macro Catalysts: No urgent catalysts (macro stable, low exogenous risk).
Action Plan:
Tactical entry on defended pullbacks or validated daily signal > 107700.
Stop-loss below 104940 (pivot), swing validation below 100335/100353 (on-chain).
Active management of 107600–107700 zone (potential climax/local capitulation).
__________________________________________________________________________________
Multi-Timeframe Analysis
__________________________________________________________________________________
1D (Daily): Strong momentum, price just below pivots, no sell signal. Supports: 100300/93337.4.
12H: Similar structure, buyers in control, potential dip under 107600–109900.
6H/4H: Ongoing bullish impulse, test of the critical 107640–107644; no signs of weakness bar minor consolidation.
2H: Only TF Down, technical breakout underway, “Up” signal restoring (watch for fakeout below 107600).
1H: Strong Up momentum, breakout confirmed, next candle confirmation needed.
30min/15min: Record volumes, ISPD Sell at 30min: high “bull trap” risk. Microsctructure strongly bullish but high post-spike volatility risk.
Risk On / Risk Off Indicator: Strong Buy on all major timeframes.
Bullish Confluences:
Up alignment (all majors except 2H), breakouts, confirmed sectoral momentum.
Very high volumes = new trend or potential buying climax.
Short-term risks:
ISPD Sell + extreme volume 30min/15min = possible local exhaustion.
Critical zone: 107600–107700. Watch out for fake breakouts!
__________________________________________________________________________________
Strategic Bias – Pro Summary
__________________________________________________________________________________
Technical: Setups remain bullish. Pivot breaks “open” the target zone up to 109950–111949. Stops below 104940 (pivot), swing validation sub 100335/100353. Switch to active management on exhaustion signals (vol spike or ISPD Sell).
On-Chain: Mature distribution; upside limited without new catalyst, but 103700/104940 zone remains pivotal.
Macro: No bearish macro/news catalyst short-term, technical dominance prevails.
Operational Summary:
Tactical bullish stance.
Favor buying dips toward 104940–105287.8.
Partial profit-taking above 109950.
Switch defensive on daily break 104940/104000.
__________________________________________________________________________________
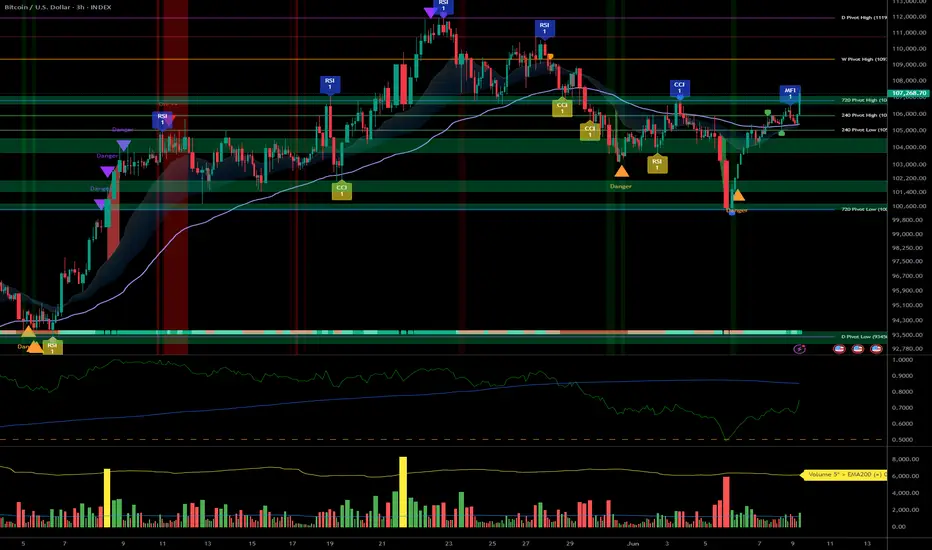
BTCUSDT Analysis – Pivot 103k/106k, strategy and key zones__________________________________________________________________________________
Technical Overview – Summary Points
__________________________________________________________________________________
Momentum : Bullish structure on 1D/12H (MTFTI “Up”), but short-term consolidation (1H-2H “Down”). Momentum exhaustion observed.
Key Supports/Resistances : Resistances: 105287.8 / 106743.9 / 109952.8 / 111949. Supports: 103033.3 / 100333.3 / 93337.4. Repeated rejections below 105-106k, active testing of 103-100k supports.
Volume : Normal or slightly elevated on all timeframes. No capitulation or euphoric extremes detected.
Multi-TF Behaviour : Strong sector leadership (Risk On / Risk Off Indicator = “Strong Buy” across all frames; growth stocks > market). No behavioural anomalies on ISPD DIV. High-cycle consolidation below resistance.
__________________________________________________________________________________
Strategic Summary
__________________________________________________________________________________
Overall Bias : Neutral/bullish as long as 103k/100k holds. Bullish momentum intact, but short-term caution warranted.
Opportunities : Defensive buys/technical pullbacks above 103k; scalp/range trading 103-106k.
Risk Zones : Confirmed breakdown below 100k or acceleration in LTH distribution.
Macro Catalysts : Next FOMC June 17-18; no major short-term events identified (recent neutral macro, FOMC is key for swings).
Action Plan : Prioritize strict stops (≥3%) near pivots, consistent monitoring of behaviour/volume. Avoid overexposure pre-FOMC.
__________________________________________________________________________________
Multi-Timeframe Analysis
__________________________________________________________________________________
1D : Structuring range below 109952.8-111949 resistances. Bullish HTF trend, but momentum pausing. Average volume. Risk On / Risk Off Indicator “Strong Buy”. No extreme ISPD signals (neutral).
12H – 6H : Consolidation; supports holding, no euphoric confirmation (normal volumes, ISPD DIV neutral). Sector leadership unchanged.
4H : Compression below 105287.8. Moderate volume. Defensive resumption on supports. MTFTI bullish. Dynamic risk: monitor for sell-side capitulation.
2H – 1H : Technical correction, active retest of 105k (range 103-105k). Absorption volume. MTFTI “Down”.
30min – 15min : Short-term positive bias above 103k. Risk of false break if volume remains low. Risk On / Risk Off Indicator “Buy”/“Strong Buy”.
Cross-Indicators : Market leadership confirmed: Risk On / Risk Off Indicator = Strong Buy on all frames >15min. No excess behaviour or significant divergences detected. Key ranges: 103k-105k. On-chain: heavy LTH profit-taking but no panic.
Summary : BTC market in post-cycle-high congestion phase, structurally robust, but momentum recalibrating with fewer “easy trades.”
__________________________________________________________________________________
Cross insights & on-chain summary
__________________________________________________________________________________
On-chain (Glassnode) : Top at $111.8k, correction to $103.2k by LTH profit-taking. Spot accumulation on $103.7k/$95.6k. Upside limited unless fresh buying flows return.
Macro events : Awaiting FOMC; no recent surprises. Price action and levels dominate short-term strategy.
Stops/invalidation : Swing long defended at 103k/100k (stop <100k H4). Partial short/sell below 106743.9/109952.8. Dynamic targets: 106-109.9k; extension: 111.8k if breakout on volume.
__________________________________________________________________________________
Conclusion & Actionable Plan
__________________________________________________________________________________
Market condition:
- High consolidation, ranging below major resistances.
- Long-term bullish, short-term momentum fading.
- Neutral/bullish if 100-103k holds.
- “No macro — only levels” until FOMC or volatility catalyst.
Tactical decision:
- Trade technically, stops ≥3% under supports.
- Defended buys at 103k (stop <100k), partial profit 106-109k.
- Continuous monitoring of volume/on-chain zone reaction.
- Aggressive exit/hedge below support, target 96k/83k.
__________________________________________________________________________________
100% analysis based on TradingView multi-TF, Glassnode on-chain, macro calendar and risk management.
__________________________________________________________________________________
