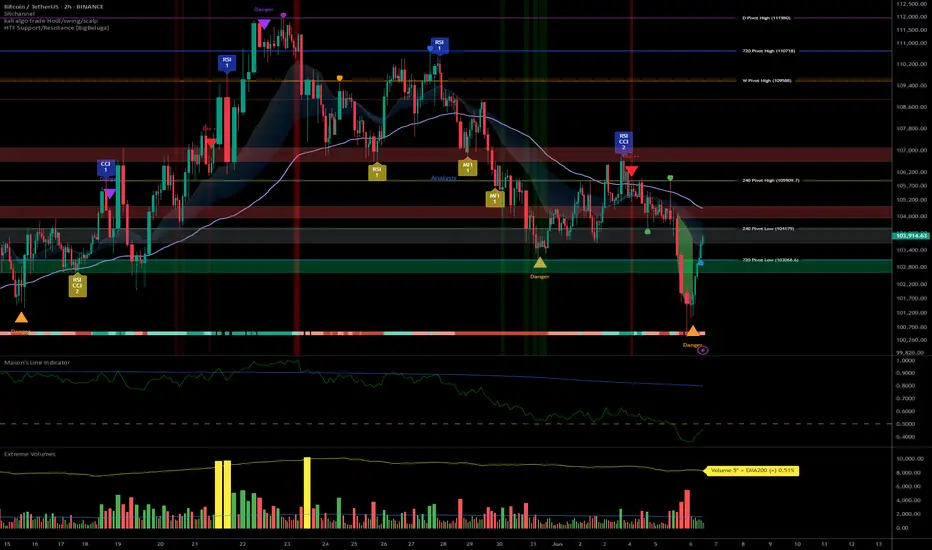
BTCUSDT Analysis – Pivot 103k/106k, strategy and key zones__________________________________________________________________________________
Technical Overview – Summary Points
__________________________________________________________________________________
Momentum : Bullish structure on 1D/12H (MTFTI “Up”), but short-term consolidation (1H-2H “Down”). Momentum exhaustion observed.
Key Supports/Resistances : Resistances: 105287.8 / 106743.9 / 109952.8 / 111949. Supports: 103033.3 / 100333.3 / 93337.4. Repeated rejections below 105-106k, active testing of 103-100k supports.
Volume : Normal or slightly elevated on all timeframes. No capitulation or euphoric extremes detected.
Multi-TF Behaviour : Strong sector leadership (Risk On / Risk Off Indicator = “Strong Buy” across all frames; growth stocks > market). No behavioural anomalies on ISPD DIV. High-cycle consolidation below resistance.
__________________________________________________________________________________
Strategic Summary
__________________________________________________________________________________
Overall Bias : Neutral/bullish as long as 103k/100k holds. Bullish momentum intact, but short-term caution warranted.
Opportunities : Defensive buys/technical pullbacks above 103k; scalp/range trading 103-106k.
Risk Zones : Confirmed breakdown below 100k or acceleration in LTH distribution.
Macro Catalysts : Next FOMC June 17-18; no major short-term events identified (recent neutral macro, FOMC is key for swings).
Action Plan : Prioritize strict stops (≥3%) near pivots, consistent monitoring of behaviour/volume. Avoid overexposure pre-FOMC.
__________________________________________________________________________________
Multi-Timeframe Analysis
__________________________________________________________________________________
1D : Structuring range below 109952.8-111949 resistances. Bullish HTF trend, but momentum pausing. Average volume. Risk On / Risk Off Indicator “Strong Buy”. No extreme ISPD signals (neutral).
12H – 6H : Consolidation; supports holding, no euphoric confirmation (normal volumes, ISPD DIV neutral). Sector leadership unchanged.
4H : Compression below 105287.8. Moderate volume. Defensive resumption on supports. MTFTI bullish. Dynamic risk: monitor for sell-side capitulation.
2H – 1H : Technical correction, active retest of 105k (range 103-105k). Absorption volume. MTFTI “Down”.
30min – 15min : Short-term positive bias above 103k. Risk of false break if volume remains low. Risk On / Risk Off Indicator “Buy”/“Strong Buy”.
Cross-Indicators : Market leadership confirmed: Risk On / Risk Off Indicator = Strong Buy on all frames >15min. No excess behaviour or significant divergences detected. Key ranges: 103k-105k. On-chain: heavy LTH profit-taking but no panic.
Summary : BTC market in post-cycle-high congestion phase, structurally robust, but momentum recalibrating with fewer “easy trades.”
__________________________________________________________________________________
Cross insights & on-chain summary
__________________________________________________________________________________
On-chain (Glassnode) : Top at $111.8k, correction to $103.2k by LTH profit-taking. Spot accumulation on $103.7k/$95.6k. Upside limited unless fresh buying flows return.
Macro events : Awaiting FOMC; no recent surprises. Price action and levels dominate short-term strategy.
Stops/invalidation : Swing long defended at 103k/100k (stop <100k H4). Partial short/sell below 106743.9/109952.8. Dynamic targets: 106-109.9k; extension: 111.8k if breakout on volume.
__________________________________________________________________________________
Conclusion & Actionable Plan
__________________________________________________________________________________
Market condition:
- High consolidation, ranging below major resistances.
- Long-term bullish, short-term momentum fading.
- Neutral/bullish if 100-103k holds.
- “No macro — only levels” until FOMC or volatility catalyst.
Tactical decision:
- Trade technically, stops ≥3% under supports.
- Defended buys at 103k (stop <100k), partial profit 106-109k.
- Continuous monitoring of volume/on-chain zone reaction.
- Aggressive exit/hedge below support, target 96k/83k.
__________________________________________________________________________________
100% analysis based on TradingView multi-TF, Glassnode on-chain, macro calendar and risk management.
__________________________________________________________________________________
Onchain

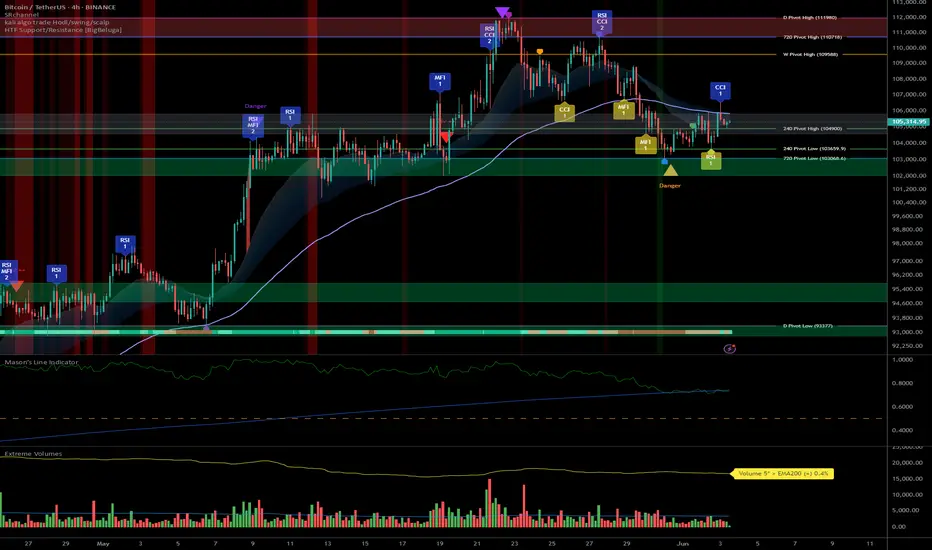
BTC Tactical rebound or flush? Decision point at $103700 support__________________________________________________________________________________
Technical Overview – Summary Points
➤ Strong overall momentum across all swing/weekly timeframes, clear advantage to buyers.
➤ Key support at 103,700–104,000 USDT (chart/on-chain confluence, maximum visibility on all timeframes).
➤ Major technical resistance zone at 111,000–112,000 USDT (ATH + HTF pivots).
➤ Volumes normal to moderate, no directional climax or emotional excess in short and mid-term.
➤ Risk On / Risk Off Indicator remains strongly positive, indicating persistent sector outperformance.
➤ Only short-term weakness detected: temporary bearish trend on 2H/1H/30min/15min, typical of a short-term flush within a bullish structural context.
__________________________________________________________________________________
Strategic Summary
➤ Main bias: Bullish for swing approaches as long as $103,700 holds on closing.
➤ Opportunity: Buy on support on any retest 103,700–104,000 USDT with stop <102,000 USDT.
➤ Partial target: Take profits at 105–106k, then 111–112k.
➤ Risk zones: Confirmed break below 103,700 USDT with high volume = potential flush to 97–98k or even 95–96k.
➤ Catalysts: Quiet macro calendar until NFP (06/06) & FOMC (mid-June) — increased monitoring as these events approach.
➤ Action plan: Tactical intervention on support pullback, reduce exposure before major events.
__________________________________________________________________________________
Multi-Timeframe Analysis
1D/1W : Major structure fully bullish. No underlying reversal, stable volume, solid momentum. Risk On / Risk Off Indicator fully “On Risk”, no behavioral excess.
12H/6H: Sector momentum and volumes validate all swing-long entries on dips. Key supports 103,700–104,000 USDT consistently defended across timeframes.
4H/2H: Bullish bias maintained, healthy structure. Slight intraday weakness: 2H softens, moderately high volumes without extremes.
1H/30m/15m: Short-term bearish bias across all LTF — profit taking impact, typical technical flush on support. Bearish signals do NOT invalidate HTF bullish trend, but require tactical vigilance.
Risk Summary: A fast drop below 103,700 USDT with volume would validate a flash liquidation scenario to 97–98k. Pullback in mature bull phase, strongly defended at the key support: timing for “mean reversion” on volume reaction, else wait for lower setups.
Risk On / Risk Off Indicator: Still “On Risk”, strong tech/growth sector momentum on daily/swing.
ISPD: No behavioral excess, neutral/median histogram across timeframes.
Volumes: Normal/moderate, no exhaustion spike nor major selling.
On-chain: Mature distribution, LTH profit-taking; key supports at $103,700, $97,100, $95,600.
__________________________________________________________________________________
Strategic Synthesis & Bias
Market in mature bullish consolidation, HTF structure robust as long as 103,700 USDT holds.
Active opportunity window until NFP & FOMC: prioritize swing/mean-revert setups.
Required stop for any trade: strictly below $102,000.
Smart monitoring of volumes & sentiment: confirmed support break + volume = wait for lower rebound.
No excessive panic or exuberance signals: strong RR if re-entering the main range.
Actively manage exposure approaching macro events.
Operational summary:
• Buy at 103,700–104,000 USDT, stop <102,000.
• Partial profits at 105–106k, final offload at 111–112k.
• Reduce exposure ahead of NFP/FOMC.
• If break of 103,700 USDT: stop and wait for $97–98k or $95–96k.
__________________________________________________________________________________
BTC/USDT: Strong Bullish Alignment, All Signals Green (01/06/25)__________________________________________________________________________________
Technical Overview – Summary Points
__________________________________________________________________________________
Momentum: Bullish structure confirmed by Risk On / Risk Off Indicator (“BUY” across all timeframes).
Key Supports: 103k–104k, consolidated on every horizon (1D to 15min).
Resistances: 105.5k–108k (short-term), 110k as a main pivot.
Volume: Moderately high, with no climax or distribution signals.
Behaviour: Proprietary indicators (ISPD DIV) show strong bullish confluence across timeframes; no divergences or significant bearish signals.
__________________________________________________________________________________
Strategic Summary
__________________________________________________________________________________
Directional Bias: Dominant bullish bias across all timeframes.
Opportunities: Tactical entries on pullbacks to 103k–104k, main exits >108/110k.
Risk: Invalidation below 101k; watch for extreme volumes or major macro catalysts.
Catalysts: Strong global risk-on dynamics (tech rally, institutional flows, weak USD); monitoring SEC regulation and macro events (NFP, CPI, FED).
Plan of action: Buy defended support zones, reduce on exuberance >110k, dynamic stop below 101k, stay reactive ahead of major events.
__________________________________________________________________________________
Multi-Timeframe Analysis
__________________________________________________________________________________
1D: Major resistance at 110k (Pivot High), strong support 101–104k, Risk On / Risk Off Indicator “BUY,” healthy volume; maintained momentum.
12H: Confluent resistance 105.5–110k, support 102.5–104k, bullish indicators, no divergence or volume climax.
6H: Resistances 105.5/108k, solid support 103–104k, strict bullish confirmations.
4H: Clustered resistances 105.5/108k, dense support 103–104k, digestion phase in volume (healthy consolidation).
2H: Major pivots 105–108k, supports 103k/101.5k, strong demand on pullback.
1H: Barriers 105.5–106k, support 103.4–104.2k, no bearish signals.
30min: Spot resistance at 105.5k+, support 103.8–104.2k, microstructure favors buying, weak selling pressure.
15min: Support 104k, resistance 105.5–106k, intraday flow remains pro-buy on weakness.
Risk On / Risk Off Indicator: Consistent “BUY” signal across all timeframes — sector and behavioural momentum alignment.
ISPD DIV: Positive histogram, no red zones or distribution alerts.
Volumes: Normal to moderately high, no climax suggesting trend end.
Summary: Strong multi-timeframe technical alignment. Bullish momentum, firmly defended supports. No imminent reversal signals, healthy consolidation within dominant risk-on trend.
__________________________________________________________________________________
Strategic & Fundamental Synthesis
__________________________________________________________________________________
Technical bias: Strong bullish conviction as long as 103–104k is defended, supported by Risk On / Risk Off Indicator/ISPD.
Fundamentals: Macro momentum (Nasdaq/US tech rally, weak USD), OI and spot dominance high, growing euphoria (ATH ~111k), watch for potential distribution if buyer exuberance peaks (P/L ratio 12:1).
Scenarios: Buy on defended flows 103–104k, TP >108–110k; caution on extreme volume at support.
Macro: Anticipate reactions to major events (NFP, CPI, FED). If a key event is due within 48h: prudence, adapt post-release.
Opportunities: Potential rotation to altcoins (SOL/ETH), short-term swing as BTC momentum pauses.
Momentum prevails, but caution warranted on any volume spikes or major macro headlines. Market remains a buy at support, optimal strategy is dynamic pullback/TP management, strict discipline in case of high-volume sell-off.
__________________________________________________________________________________
Actionable Summary
__________________________________________________________________________________
Entry: Buy securely on 103–104.2k zone
Stop: Hard invalidation if <101k (on volume)
Take Profit: 108–110k+
Risk: Excessive on-chain euphoria, violent support break
Stay agile near major releases and watch flow rotations (BTC/ALT)
__________________________________________________________________________________
TradeCityPro | Comprehensive Bitcoin Analysis for 2025👋 Welcome to TradeCityPro Channel!
Let's go for the most complete BINANCE:BTCUSDT Bitcoin analysis you can see. In this analysis, we are going to examine the data from monthly to weekly to daily time frames and more in the most complete way possible!
🌐 Monthly Timeframe
In the monthly timeframe, as you can see, Bitcoin is positioned between two curved trendlines and has reacted to these zones multiple times.
The last time the price hit the bottom of this channel, it recorded a low of 16,000, after which the crypto bull run began. The top of this channel also coincided with the 69,000 peak in the previous bull run, allowing us to identify the end of that bull run.
One key point about this channel is that the slope of its trendlines is decreasing, and overall, a weakening trend in Bitcoin is observed, which is logical. This is because every time Bitcoin has made an upward leg, a massive amount of capital has flowed into it, so it naturally moves less in the subsequent leg.
This point might seem negative to newer market participants, as Bitcoin’s bull runs used to happen faster in the past, and the price moved more significantly in percentage terms. For example, the 2017 bull run saw Bitcoin grow by nearly 7,000%, while in the 2019 bull run, it grew by about 1,500%.
However, within this seemingly negative point, there’s a positive aspect: this reduction in volatility indicates Bitcoin’s maturity and that of the broader crypto market. When an asset has a large amount of capital invested in it, its volatility naturally decreases, but this also reduces the risk of investing in that asset.
For instance, gold currently holds the top spot globally with a market cap of 21 trillion dollars, while Bitcoin’s market cap is around 2 trillion dollars. This gap makes Bitcoin appear as a better investment choice at first glance, as its lower market cap suggests greater growth potential.
On the other hand, the risk of investing in Bitcoin is higher because it has less capital invested in it, and large institutions like governments prefer to invest in gold, earning lower returns over time compared to Bitcoin. For these institutions, the most important factor is risk optimization, and gold has proven itself as the lowest-risk asset over centuries.
So, overall, we can conclude that the more capital flows into Bitcoin, the lower its volatility becomes. As volatility decreases, it becomes a safer asset for investment, attracting more interest from large institutions.
Additionally, we should consider that if Bitcoin isn’t destroyed or proven to be a scam, it could become a safe-haven asset like gold in the future. Its supply is well-optimized, and due to the halving mechanism, its issuance is tightly controlled, which gives it an inherently bullish nature like gold.
Note that when I say Bitcoin’s movements are slowing down and more capital inflow reduces its volatility, I don’t mean it will stop moving upward. Rather, it means its cycles will take longer, and its movements will be heavier. For example, gold, despite its high market cap, still moved upward last year.
Currently, Bitcoin has started a new upward leg after rising from the 16,000 zone. It first reached the previous high, then, after reacting to the 0.5 Fibonacci Extension level (which overlapped with the 71,000 zone), it pulled back to the 57,000 zone and has now moved to the 0.618 level near 101,000.
Based on the candles formed in the monthly timeframe, it seems the upward movement is ongoing. If the 0.618 level is broken, the price could see a few more bullish candles. The next Fibonacci level is 0.786, near 165,000, and if the price movement extends a bit longer, this level could also overlap with the top of the curved channel.
In my opinion, the maximum potential for Bitcoin in this bullish cycle is between 160,000 and 180,000. However, keep in mind that this is just my personal view, and I’m not making decisions based solely on this analysis or planning to sell if Bitcoin reaches this range. This is merely a mental target, and if I see Bitcoin reaching this range with strong bullish momentum, there’s a chance it could break through.
In that scenario, if Bitcoin reaches this range without any trend weakness and with high momentum, I’ll update the analysis for you and examine higher targets Bitcoin could reach.
On the other hand, if I see Bitcoin’s momentum weakening and showing trend deterioration before reaching the resistance zone, I’ll adjust my perspective. If the trend reversal triggers I’ll discuss later are activated, I’ll exit the market.
In the RSI oscillator, we have very important zones that can help us assess the trend’s health. A ceiling at 77.65 has formed, which, if reached by RSI, could indicate a momentum-based market top. However, if this level is broken, the bullish scenario I mentioned is highly likely to occur, and the price could move beyond our expected target.
On the other hand, there’s a support floor at 58.90, and I believe the confirmation of the end of Bitcoin’s bull run will come with a break of this level in RSI. If RSI consolidates below this zone, bullish momentum will weaken, and the price will gradually enter a corrective phase.
Regarding volume, I should note that the decreasing volume in this timeframe isn’t reliable data because Bitcoin’s volume is spread across various exchanges, and comparing volume at this scale isn’t accurate or useful.
I have nothing more to say about the monthly timeframe. Let’s move to lower timeframes.
📊 Weekly Timeframe
Let’s dive into the weekly timeframe, where we can observe price movements in greater detail.
As you can see, after being supported at the 16,000 zone, Bitcoin faced a significant resistance at 31,000. Breaking this level kicked off the bullish trend. In the first leg, the price moved from 16,000 to 31,000, and after breaking 31,000 in the second leg, the upward move continued to 72,000.
One of the main reasons for this bullish cycle was the U.S. interest rate. Simultaneously with the breakout of the 31,000 zone, the U.S. Federal Reserve changed its policies and began lowering interest rates. This triggered a massive capital inflow into Bitcoin, initiating its bullish move.
During the corrective phase, the price oscillated between the 72,000 and 55,000 zones for several months. After breaking the 72,000 ceiling, another bullish leg took the price to 105,000.
One of the reasons for this bullish move was Trump’s strong support for crypto during the U.S. election. He frequently mentioned Bitcoin positively in his speeches and considered it part of his policies.
However, after Trump was elected president, he didn’t fully deliver on his promises. The imposition of tariffs not only impacted Bitcoin but also significantly affected the U.S. dollar, major company stocks, and indices like the S&P. As a result, Bitcoin dropped back to near the 72,000 zone.
Additionally, for the past few months, the U.S. Federal Reserve has not changed interest rates due to these tariffs. In all its statements, it has indicated that it’s waiting for the tariffs to be finalized and is in no rush to make decisions regarding monetary policy. Thus, in recent months, the interest rate variable has been effectively neutral, with the most significant fundamental news being the U.S. tariffs against China and Europe.
After Bitcoin’s drop to near 72,000, news of a 90-day agreement between China and the U.S. emerged, stating that tariffs would be lifted for 90 days to allow negotiations. This news was enough to restart the bullish move for Bitcoin and stocks like the S&P. As you can see, Bitcoin has now surpassed the 105,000 ceiling and is currently deciding its next move above this zone.
Looking at RSI, there’s a key support level at 44.75, where every time the price has hit this level, a new bullish leg has started. This level accurately indicated the 55,000 and 72,000 bottoms and has been very reliable.
However, there’s a clear divergence in RSI between the 72,000 and 105,000 peaks. The current peak above 105,000 is higher, but RSI is still forming lower highs, which could strengthen the divergence.
Currently, RSI is near the overbought zone and appears to be rejecting from the 70 level. If RSI is rejected from this zone, the price might fake out the 105,000 breakout and drop below it. If this happens, it would signal a significant trend weakness, greatly increasing the likelihood of a trend reversal.
However, if RSI consolidates above the 70 level and the price makes another bullish leg, we’ll still have divergence, but the trend weakness will be much less severe than in the fake-out scenario. If the price makes another bullish leg, our targets based on Fibonacci are the 130,000 and 160,000 zones.
In any case, if RSI forms a lower high compared to its previous peak and the price enters a corrective phase, I believe the 44.75 level will break, activating the divergence. If this happens, we’ll get a momentum-based confirmation of the bull run’s end, and we’ll then need to wait for a price-based confirmation.
Currently, the price confirmation for a trend reversal would first be a fake-out of the 105,000 breakout, with the main trigger being a break of the 72,000 level. If the price forms a higher high, we’ll need to wait and identify the trend reversal trigger based on market structure and conditions.
Personally, I believe Bitcoin will have another bullish move to the 130,000 zone, and simultaneously, dominance will move upward again. After this move, as Bitcoin consolidates or corrects, dominance will drop, leading to an altcoin season for a few months. After Bitcoin’s consolidation and the end of the altcoin season, the market’s bearish phase will begin, which I’ll discuss further if it occurs.
If you’ve bought Bitcoin at lower levels and are holding, I think you can continue holding, as there’s a high chance of another bullish leg, and we don’t yet have any confirmation of a trend reversal. I suggest continuing to hold until we get a clear reversal signal.
For buying Bitcoin on the spot market in this timeframe, it’s not possible to provide a trigger right now, as we’re at the end of a bullish leg, and the upward trend from 16,000 has been very prolonged. I believe we’ll see at most one more bullish leg, so if you’re skilled at trading, I suggest using this capital to open positions in futures to maximize profits.
Be cautious—I’m saying this only if you have trading skills, not to blindly open positions with all your capital without a trigger. That would only lead to losses.
If you haven’t bought any Bitcoin in this bullish trend yet, you can wait for the potential altcoin season. I suggest starting now to identify good projects so that when Bitcoin dominance shows bearish confirmation, you can buy the altcoins you’ve researched and profit from that market phase.
📈 Daily Timeframe
In the daily timeframe, as you can see, Bitcoin underwent a corrective phase, dropping to the 76,000 zone. After forming a base at this level, a bullish leg to 106,000 was triggered at 87,700.
Currently, the price is above the 106,000 zone but hasn’t consolidated above it yet. The reason I say it hasn’t consolidated is that market volume is decreasing after the breakout. Additionally, when the price breaks through a supply zone like an all-time high, significant momentum is required, but that hasn’t happened, and the price is ranging above this zone without significant movement.
If Bitcoin consolidates above this zone, the bullish move could continue. The targets we can consider are the 116,000 and 130,000 zones.
The RSI oscillator has a critical support at 59.78, which is a very important momentum level. If this level is broken, this bullish leg could end, and the market might enter a corrective phase. Volume is also slightly decreasing and showing some divergence with the trend, which is another sign of trend weakness.
If the price consolidates below 106,000, we’ll get confirmation of a fake-out of this breakout, and the price could move downward again. The lower support zones are 102,600 and 92,300.
If the price forms a lower high and low below 106,000, we can confirm a trend reversal. Breaking the 76,000 level would be the main confirmation of a trend change.
💼 4-Hour Timeframe
In the 4-hour timeframe, Bitcoin entered a corrective phase after reaching the 111,700 zone and has formed a descending triangle between the 106,000–107,000 range and a downward trendline.
The 106,000–107,000 range is a very strong support zone, and the price has tested this level multiple times but keeps forming lower highs compared to 111,700, increasing the likelihood of breaking this support zone.
On RSI, there’s a support level at 35.94, which is a very strong momentum zone. Breaking this level could confirm the entry of bearish momentum, increasing the likelihood of breaking the support zone.
With a break of the support zone and the 35.94 level in RSI, we can enter a short position. If the price forms a lower high and low below this support zone, we can confirm a trend reversal. The next key support zones are 101,600 and 93,700.
For the bullish trend to continue, breaking the downward trendline would confirm an upward move. If the trendline is broken, the price could rise to 111,700. Breaking the 111,700 level would be the main confirmation of the bullish trend’s continuation, activating the trendline breakout as the primary trigger.
🔍 Binance Open Interest is Surging as BTC Regains Bullish Momentum
Tracking what’s happening in the derivatives market has become essential, given the current market structure.
Derivatives volumes are significantly higher than those on spot markets or ETFs, especially on Binance, which ranks just behind the Chicago Mercantile Exchange in terms of volume.
As a result, derivatives activity can have a major impact on Bitcoin’s price, making on-chain data related to derivatives extremely valuable to monitor.
This has clearly been the case since BTC resumed its bullish trend, reflected in the rising Open Interest on Binance. It jumped from $7.5B on April 8th to over $11.2B today. We can also note that the 30-day and 50-day SMAs have just crossed back above the 100-day average. Derivatives activity has clearly helped fuel the price move, even though many short positions were opened along the way.
Seeing Open Interest climb is generally a good sign, as it gives the market momentum and can lead to strong upward moves. However, this kind of push tends to be fragile.
At the moment, we haven’t yet returned to a new Open Interest ATH on Binance, which may suggest that we’re not in a full-blown euphoric phase on derivatives markets just yet.
📊 Minimal Sell Pressure Despite STH & LTH Deposits on Binance
Keeping an eye on STH (Short-Term Holders) and LTH (Long-Term Holders) behavior gives us valuable clues about market sentiment.
In this update, we’re focusing on Bitcoin inflows to Binance from both STHs and LTHs. These flows help us measure selling pressure and get a feel for how price action might unfold.
Let’s start with STHs the group that tends to react quickly and emotionally to market shifts.
🧠 We’ve seen their behavior play out clearly in the past:
During the August 2024 correction, they sent over 12,000 BTC to Binance.
Then again, around late February to early March, during the tariff news-driven panic that pushed BTC below $80K, they dumped over 14,000 BTC.
But here’s the good news: right now, STH inflows are still moderate only about 8,000 BTC has been sent to Binance so far, which is roughly in line with the last correction.
🔍 As for LTHs, the numbers are even calmer.
Currently, just 86 BTC has flowed in from long-term holders—far lower than the 254 BTC seen before the last major top and way below the 626 BTC peak back in 2024.
📊 Bottom line?
Whether we’re looking at STHs or LTHs, there’s no real sign of strong selling pressure at the moment. Still, it’s worth watching in the context of ongoing demand—which remains relatively healthy for now.
Coinbase Premium Signals Strong Institutional Demand
There’s no doubt institutions are stepping in and no, it’s not just because of ETFs.
💡 Why not ETFs?
Because spot Bitcoin ETFs aren’t exclusive to institutions. Retail investors can access them just as easily, and in terms of raw volume, ETFs still don’t come close to the spot or futures markets.
That said, the inflows are still impressive: the 30-day average daily inflow is now over $330 million, and that trend is holding strong.
🚀 The Real Signal? The Coinbase Premium Gap
This metric tracks the price difference between Coinbase Pro (favored by U.S. professional/institutional investors) and Binance. Right now, the 30-day moving average of the premium gap is 55 a clear sign of heightened U.S. investor activity, which strongly points to institutional participation.
💰 Futures Activity Surges as Spot Demand Fades on Binance
Futures volume on Binance has been rising, while spot volume has dropped significantly in recent days even as Bitcoin broke into price discovery. This shift in volume composition is worth watching closely, as it provides important clues about the market’s internal strength.
Volume isn’t just a number—it reflects the type of demand driving the market. When demand comes from spot markets, it often suggests long-term conviction. In contrast, demand driven by futures markets tends to reflect short-term speculation, which can introduce instability.
Since May 5, we’ve seen futures activity increase modestly, while spot volumes have clearly declined. This suggests that the current price action may be fueled more by leverage and short-term bets than by solid, long-term buying.
Without strong spot support, trends powered by derivatives are more fragile and prone to sharp reversals. This environment calls for increased caution, especially for those considering new entries or leveraged positions.
⚡️ BTC Gains Bullish Momentum as Binance Open Interest Rises
Tracking what’s happening in the derivatives market has become essential, given the current market structure.
Derivatives volumes are significantly higher than those on spot markets or ETFs, especially on Binance, which ranks just behind the Chicago Mercantile Exchange in terms of volume.
As a result, derivatives activity can have a major impact on Bitcoin’s price, making on-chain data related to derivatives extremely valuable to monitor.
This has clearly been the case since BTC resumed its bullish trend, reflected in the rising Open Interest on Binance. It jumped from $7.5B on April 8th to over $11.2B today. We can also note that the 30-day and 50-day SMAs have just crossed back above the 100-day average. Derivatives activity has clearly helped fuel the price move, even though many short positions were opened along the way.
Seeing Open Interest climb is generally a good sign, as it gives the market momentum and can lead to strong upward moves. However, this kind of push tends to be fragile.
At the moment, we haven’t yet returned to a new Open Interest ATH on Binance, which may suggest that we’re not in a full-blown euphoric phase on derivatives markets just yet.
🔄 Bitcoin Heatmap Analysis
Let’s move on to the Bitcoin heatmap analysis, which was missing from this analysis and completes the most comprehensive data for these days. I hope it’s useful for you.
In the 6-month timeframe, Bitcoin has had a good upward trend but experienced a rejection after hitting orders in the 110,000–113,000 range. It’s currently in the 104,000 zone, with the most important support zone at 92,000, which is likely to hold.
In the monthly timeframe, we’ve broken through the 106,000 zone, which was a strong support level based on orders, but there isn’t a strong support zone immediately below. The next support level is 100,000–102,000, which could be a solid level, while the 110,000–112,000 zone is currently the most valid resistance level for Bitcoin.
In the weekly timeframe, a similar event has occurred. We’ve been rejected from the significant 110,000 resistance zone and are heading for further downside, but at a slow pace. In this timeframe, no specific support orders have been registered yet, and it will take some time for traders to place their buy orders on exchanges. However, even if we bounce from this level, we shouldn’t underestimate the 110,000 resistance.
📝 Final Thoughts
This is the most comprehensive Bitcoin analysis for the community.
We’ve done our best to collect the data comprehensively in this post for your awareness and present it to you in this analysis, hoping it has been useful for you!
Our team has worked on this analysis for several days, so we’d be thrilled if you boost, comment, and share the analysis with your friends.

HolderStat | Insane Profits in 9 Deals🚀 Wallet turned $5.9K into 25.78 ETH CRYPTOCAP:ETH (~$47.4k) with just 9 trades, netting a massive 2567% profit in 58 months! With avg buy at $705 & avg sell at $4,647, it’s proof that smart timing and patience pay off big in crypto! 🔥
ONDO FINANCE (EXPERIMENTAL)Institutional-Grade Finance, Now Onchain.
LSE:ONDO is building the next generation of financial infrastructure to improve market efficiency, transparency, and accessibility.
Bitcoin Advanced NVT Metric Produces Local Bottom Signal.What is Bitcoin Advanced NVT Signal?
Bitcoin Advanced NVT (Network Value to Transactions) Signal is a metric that measures the relationship between Bitcoin's market value and its transaction volume on the blockchain. Simply put, this signal shows how "healthy" Bitcoin's transactions (amount of BTC spent) are relative to its market value.
If NVT is high: Transaction volume is low, but the price is high. This indicates that Bitcoin might be overvalued.
If NVT is low: Transaction volume is high, but the price is relatively low. This suggests that Bitcoin might be undervalued or ready for a price increase.
The Advanced NVT Signal adds moving averages to make this ratio more sensitive, helping to better understand trends. In other words, it is used to determine whether Bitcoin is in an overbought or oversold zone.
Last 1 Year Performance
When we examine the performance of the Bitcoin Advanced NVT metric over the last year, we see that it generated 4 local bottom signals in 2024. These signals occurred on the following dates:
May 2, 2024 --> 30.78 (Bitcoin at 58K)
August 5, 2024 --> 35.82 (Bitcoin at 54K)
September 6, 2024 --> 35.81 (Bitcoin at 53K)
October 10, 2024 --> 38.21 (Bitcoin at 60K)
Daily closing prices are taken into account.
Current Situation
As Bitcoin has retreated from 108K to 91K recently, the Advanced NVT metric has pulled back to 38.13. Since November 11, 2024, the Advanced NVT metric has continued its downward trend and has recently entered the local bottom zone (-0.5xSD).
A rapid rise in a single day would certainly make many people happy. However, previous data shows that Bitcoin tends to continue accumulating for a while after entering this zone.
At the moment, there is no indication that the trend has reversed, but the Advanced NVT suggests that we are in a local bottom area.
Personal Opinion
I believe that the Bitcoin price will continue to accumulate within the blue box for a while and then resume its rally.
Thank you for reading.

CHAINLINK — 2024-5CRYPTOCAP:LINK The standard for onchain finance
The Chainlink standard continues to see adoption across the tokenization landscape, with recent developments in Q3 underscoring how Chainlink’s decentralized infrastructure plays a pivotal role in enabling smart, scalable, and secure tokenized real-world assets (RWAs). Companies such as 21Shares, Lympid, Superstate, and Sygnum are leveraging Chainlink services like Data Feeds, Proof of Reserve (PoR), and the Cross-Chain Interoperability Protocol (CCIP) to bring critical onchain transparency, connectivity, and real-time data to tokenized assets, including U.S. Treasury bonds and Ethereum ETFs. These integrations provide verifiable, onchain asset backing, which enhances user trust and facilitates the growth of decentralized finance (DeFi) applications such as collateralized lending and automated asset management. Chainlink’s infrastructure continues to enable firms to set new standards for transparency and reliability in both traditional and decentralized finance.

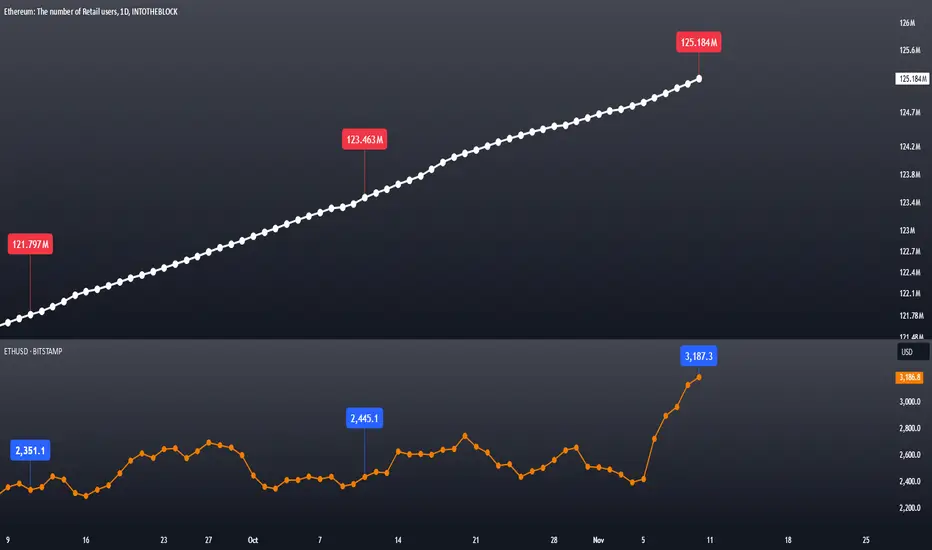
Ethereum Retail Investor Count Surges by 3.3 MillionEthereum Retail Investor Count Surges by 3.3 Million: The Road to an Altcoin Bull Run?
Analyzing Changes in Ethereum's Retail Investor Count
Over the past 60 days, we’ve observed a notable increase in the number of Ethereum retail investors. While the percentage increase may seem modest at 2.77%, this translates to approximately 3.3 million new retail addresses. With this rise over the past two months, the total number of retail investor addresses has reached 125.18 million.
Could Retail Investors Be the Catalyst for a Bull Market?
To answer this briefly: Yes.
In a bull run, new investors entering the market are expected to drive a significant increase in demand. When supply is limited or relatively scarce, as with Ethereum, this demand surge is anticipated to lead to a substantial price increase. Given that Ethereum is often seen as the “father of altcoins,” this trend holds even greater importance.
Why Is This So Significant?
The Key to an Altcoin Rally: Ethereum
Recently, Ethereum's price performance has lagged behind Bitcoin. In the last six months, for example, Bitcoin has gained 33%, while Ethereum's return has only been 10%. This discrepancy has left many altcoin investors disappointed. However, with Bitcoin dominance receding, we’re seeing Ethereum come back into the spotlight. Over the past week, while Bitcoin has risen around 19%, Ether has gained over 29%.
Following Ethereum's rally, the entire altcoin market is experiencing a period of relief and upward movement. This is why Ethereum's price trends and volatility are crucial for a potential altcoin bull run. Monitoring on-chain data here can provide critical insights.
How Can We Track This Data?
Conclusion
Through the IntoTheBlock & TradingView collaboration, you can track Ethereum's retail investor count under the "ETH_RETAIL" metric.
Observing whether there’s a corresponding increase in retail interest following the recent price surge can offer insight into the rally’s sustainability. If there’s no notable rise in the retail investor count, expecting a strong, lasting bull run might be overly optimistic. Thus, on-chain data sometimes serves as a leading indicator, and at other times, it confirms trends.
Thank you for reading.
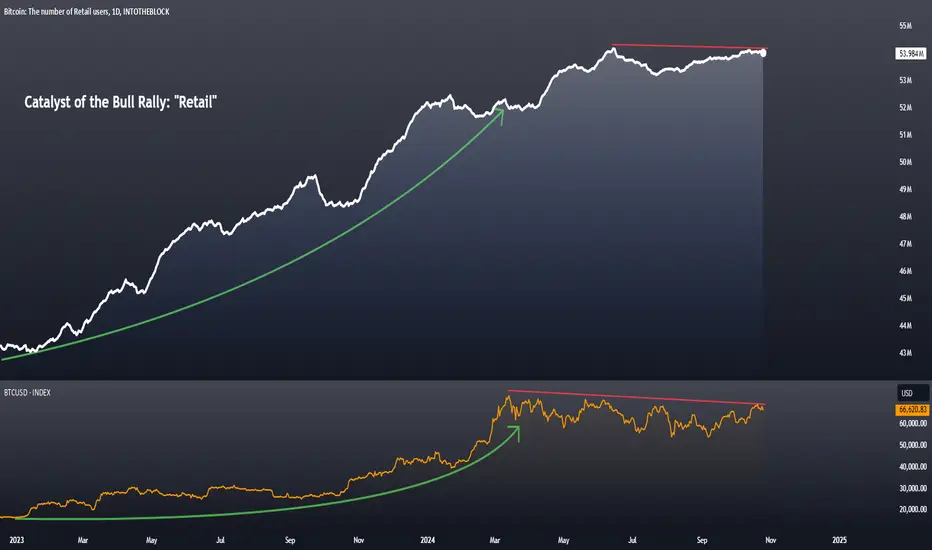
Catalyst of the Bull Rally: "Retail"Understanding the Past
When we examine the number of retail Bitcoin investors, we see that it stood at 43 million in January 2023. From that point onward, the number of individual investors increased steadily over 12 months, rising by 22% to reach 52.4 million, prior to the acceptance of Spot ETFs. Following the approval of Spot ETFs, this figure saw a slight decline, reaching 51.6 million by the end of February 2024.
However, the "ETF Bull" rally, led by the momentum of Spot ETFs, pushed the retail investor count upward, peaking in June 2024 at 54.14 million. After this peak, a downward trend in retail investor numbers began.
The Impact of Retail Investors on Price
Historical data reveals a close relationship between the growth in the number of retail investors and Bitcoin’s price movement.
Returning to January 2023, we observe that as the retail investor count rose significantly, Bitcoin’s price surged by over 300% in the same period. However, after reaching its peak in June 2024, the retail investor count plateaued, and Bitcoin’s price also struggled to reach new highs thereafter.
Conclusion
The rise in the number of retail investors remains a crucial catalyst for Bitcoin bulls. If this trend sees a strong resurgence, with retail investor interest growing substantially once again, Bitcoin's price could be poised to test new highs. Just as in the past, retail interest could provide the needed tailwind for Bitcoin; hence, renewed growth in the retail investor base may offer a vital opportunity for the next bull rally.
Thanks for reading.
Ethereum Whales Accumulate $ETH in Anticipation of ETF LaunchWallets holding at least 0.1% of the total supply have shown a consistently positive net flow over the past month, with a notable surge as Ethereum bounced back from its recent lows below $3k. This trend suggests accumulation in anticipation of the upcoming Ethereum ETF release, which is expected to occur around July 23rd.
Our outlook for the coming week is predominantly bullish. However, whether the ETF release becomes a 'sell the news' event hinges on the level of institutional demand for CRYPTOCAP:ETH

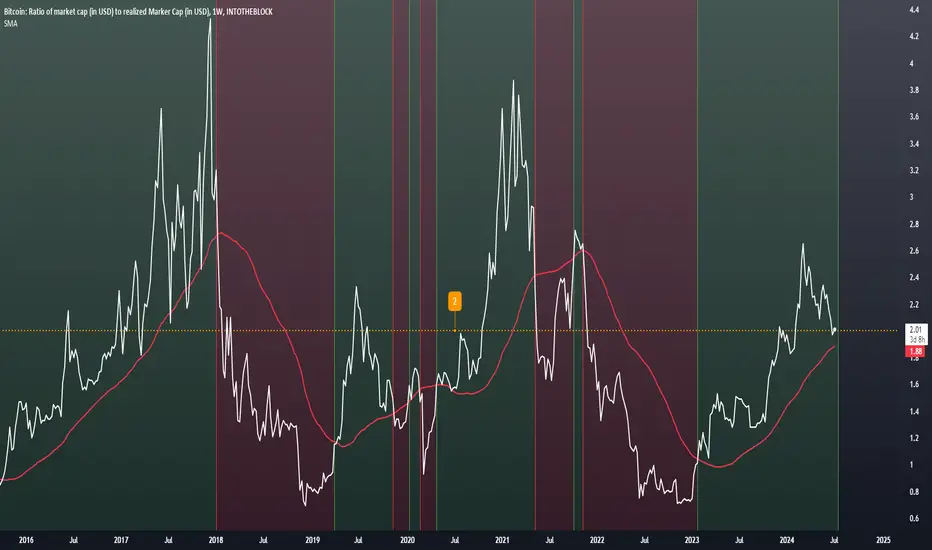
Bitcoin MVRV AnalysisHello friends,
Thanks to the collaboration between TradingView and IntoTheBlock, you can access this data for free on TradingView with the code "BTC_MVRV."
Today, we will dive deep into MVRV, the primary data I use for trend tracking in Bitcoin.
What is MVRV?
MVRV is calculated by comparing two main metrics: market value and realized value.
Market value is determined by multiplying the current market price of a cryptocurrency by its circulating supply. On the other hand, realized value considers the total value of all coins based on their last transaction prices.
The Market Value to Realized Value Ratio (MVRV) allows us to understand the profitability of Bitcoin investors and cyclically track trends.
Bull vs. Bear
If the Bitcoin MVRV ratio is above 1, it indicates that investors are in profit, while if it is below 1 investors are at a loss.
Generally, investors pay attention to the following two levels when examining MVRV. If the MVRV is below 1 the Bitcoin price is cold as the polar north, and if the MVRV is at or above 3.7, the Bitcoin price is hot as Sahara desert.
However, to add a different perspective and to detail trend tracking, I included the 52-week simple moving average. As you can see on the chart, it has become much easier to follow bear and bull trends. We can say that if the MVRV score is above the 52-week average, the bulls are strong; if it is below, the bears are strong.
Conclusion
Currently, the MVRV is at 2.03 points, while its 52-week average is at 1.88 points.
This situation shows us that we are still in a bull trend. As a bonus, when we examine the MVRV historically, we can observe that 2.00 points is an important level. We have witnessed that the momentum in bull trends increases if the MVRV can stay above 2.00 points.
Let's see what we will witness in the current bull trend.
Thank you for reading.
Bitcoin On-Chain: Is The Cycle Over Already?In this analysis I want to discuss a (most likely) unpopular view on the market. Namely, that the "cycle" is already over and that the peak is in for now.
Preface
This is not my most likely outcome for the markets. You can find my most likely outcome below:
Still, it's always advised to keep an open mind and explore different potential outcomes.
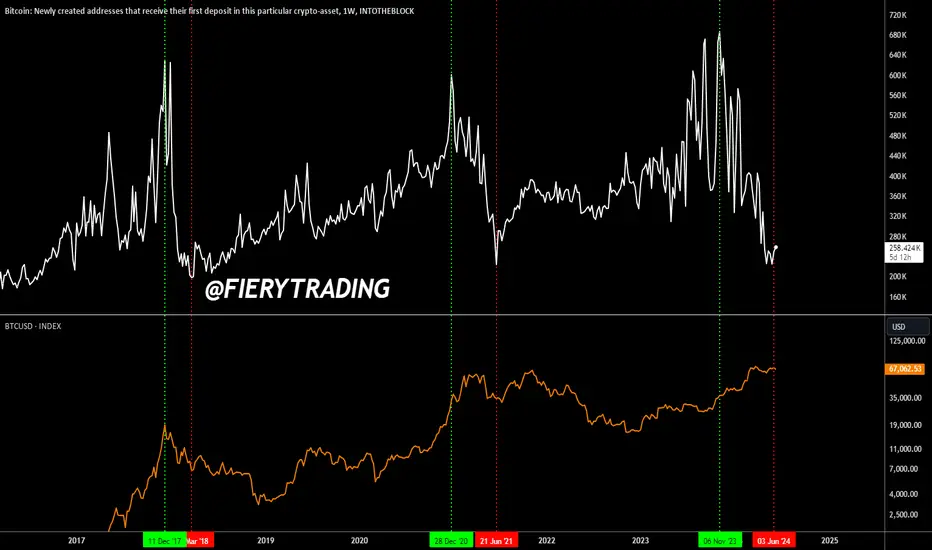
Overview
When we look at the last 7-8 years of Bitcoin's newly created addresses we can see that this value follows a clear boom-and-bust pattern. It peaks (green) during mania when everyone wants to step into the market and it declines after the market has topped (red).
For the people who are wondering about the November 2021 peak: on-chain data peaked in Q1-2021.
What this chart suggests is that the "mania" phase of the market cycle is over and that the top is either in or very close. Once the mania phase is over, crazy gains are more rare and trading is more difficult.
I'm interested to hear your thoughts on this idea. Like I said, it's not my most likely outcome, but it's possible that we've topped after the ETF mania.
AEROUSDTWhen getting ready for the Onchain summer festival, it is worth taking a look at the main AERO coin from the basechain cat.dex, the event sponsored by coinbase starts in June and will last until August. AERO freshness plus a small market cap and practical use. Targets on pp.

🔥 Bitcoin On-Chain: Completely Normal Correction!In this analysis we talk more about yesterday's analysis where I discussed the completely normal correction that BTC has been seeing. Furthermore, chances are that we will see more of those correction in the coming months.
As seen on the chart, Bitcoin sees multiple deep corrections (>20%) during bull-cycles. Sometimes they are less excessive, but >20% is generally the bottom.
Currently, BTC is trading around 11% from the ATH. It's not great, but looking at previous bull-cycles it can certainly get much worse.
For now, there's not a real reason for the bulls to worry. Yes, BTC is not really doing great at the moment, but did we really expect a move from 40k > 100k without any corrections?
Patience will reward you.
🔥 Bitcoin On-chain: You're Still EARLY This Cycle 🚨In this analysis I want to dive deeper into on-chain analytics, namely the amount of the BTC supply that has not moved in over 1-year (read: investors that hold BTC for >1 year).
This metric is important because it gauges the amount of hodlers in the market. Historically, the amount of hodlers always goes up during bear-markets and goes down during bull-markets.
Take a look at the previous three cycles. Hodlers only really started selling after BTC has made a new all-time high.
Seeing that the white line has only just started going down, we can safely assume that we're still early into the real bull-market and that we likely have another 6-12 months of bull period (historically) ahead of us.
Don't worry if you missed the boat on your favorite altcoin, you're still early.

Ether's Ascending Support Line at Critical PointJust like in BTC and everywhere else in the crypto markets, the trading volumes on ETH are also very low.
However, the main difference from BTC is that Ether's supply is now deflationary. Since the merge of the new consensus mechanism; Ether's circulating supply has been going down. (The first year in deflation).
And alongside this data, on-chain metrics show that ETH's total addresses with balance are at all time high levels >97.5m; total staked ETH are above 26m and that is a 20% increase over the last 90 days; with 127k depositors (stakers) over 17.7% increase in the 90 days.
The chart also looks promising with an ascending support line, however, it is at a very critical zone now. If it breaks down from here; we may see test of the previous resistance trend which I highlighted with dotted red line. Right now, we are testing the
But, due to the bullish fundamentals and on-chain metrics of ETH, I am expecting a bounce from here. Also, please keep in mind, I am a bit biased as I am a believer in Ether becoming the smart ledger of the world's assets.
Please do your own research,
Good luck!

Could this be BTC bear trap?Looks like a breakdown of a falling wedge pattern in BTC chart. However, the on-chain metrics tell us a very different story in terms of Bitcoin's current state.
According to on-chain data, as of last week, there are 47.87m addresses with a balance in Bitcoin network. This obviously excludes user balances on centralised exchanges. It is constantly increasing and is showing a very steady growth over the years.
Also the mining difficulty is increasing along with the hash rate, floting in all time high zones still:
30-Day High 446.96m TH/s as of Aug 15 2023.
In the last 90 days, miner outflows have reduced by -40%
Obviously, we can't purely rely on this data and therefore we look at chart patterns and technical chart indicators; and on that front, things are not looking very bright.
There is weak support levels on the price, volumes are down, RSI is not looking good and there is very low volatility.
We can only expect lower price levels with such charting; but it could all change with positive news from ETF decision. Lets wait and see if this becomes a bear trap or a lower low in the coming weeks.
Why BTC Remains Profitable: SOPR > 1, but Caution is AdvisedGiven the current stability of BTC prices, I wanted to shed some light on an important metric that indicates Bitcoin's profitability and discuss the significance of HODLing for the long term.
As many of you know, the SOPR (Spent Output Profit Ratio) is a widely recognized on-chain indicator used to determine the profitability of Bitcoin transactions. When the SOPR is greater than 1, it suggests that the average investor is selling their BTC at a profit. This metric has proven to be a reliable tool for assessing market sentiment and predicting potential price movements.
Recent data indicates that the SOPR for Bitcoin has consistently remained above 1, indicating that investors are making profits from their BTC holdings. This finding serves as a testament to the resilience and profitability of Bitcoin as a long-term investment. However, it is crucial to approach this information with a cautious mindset.
While the SOPR > 1 is undoubtedly a positive sign, it is essential to consider the broader context of the market. The stability of the BTC price plays a pivotal role in ensuring the sustained profitability of Bitcoin investments. Therefore, I urge you to exercise prudence and carefully monitor the market conditions before making investment decisions.
In light of this, I strongly encourage you to consider the long-term HODLing strategy for your BTC holdings as long as the price remains stable. The inherent volatility of the cryptocurrency market often tempts traders to capitalize on short-term gains. However, we can reap substantial future rewards by embracing a patient and strategic approach.
By maintaining a long-term perspective, we can navigate through market fluctuations and capitalize on the potential growth of Bitcoin. Remember, the true power of BTC lies in its ability to act as a store of value and a hedge against traditional financial systems.
In conclusion, while the SOPR > 1 indicates the profitability of Bitcoin transactions, it is crucial to exercise caution and consider the stability of BTC prices. Embracing a long-term HODLing strategy and diligent market analysis can help us make informed decisions and maximize our returns.
Let us move forward with a sense of responsibility and awareness, ensuring that we make the most of the cryptocurrency market's opportunities. Together, we can navigate these uncertain times and emerge as successful traders and investors.
As a fellow trader, I encourage you to adopt a long-term BTC HODLing strategy, provided the price remains stable. Let's stay vigilant, monitor market conditions, and make informed decisions to secure our financial future.
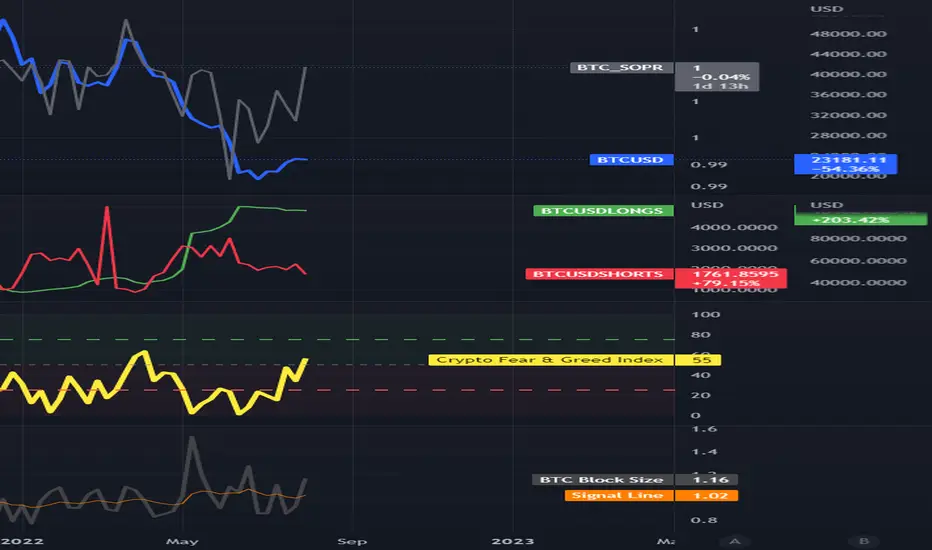
$BTCUSD SOPR, BFX Longs and Shorts, Greed, Liquidations.
This is one of the multi-chart evolving dashboards I use daily for crypto trading. This dashboard attempts to distill a broad scope of data and sentiment into glance value charts. The goal with such dashboards is to seek to stack probabilities to be on the right side of the percentages in every trade.
--
The top panel chart shows the SOPR (Spent Output Profit Ratio, (grey line, using the symbol $BTC_SOPR) overlay vs $BTCUSDT (Binance, in blue). The SOPR is a very simple indicator. It is the spent outputs expressed as a ratio and shown as an oscillator on the chart. The Bitcoin SOPR is the realised dollar value divided by the dollar value at creation of the output. Or simply: price sold divided by price paid.
SOPR showing under value 1 means that the on chain data has recorded a net realised loss for "spent" Bitcoin. SOPR showing over value 1 means net profit. Renato Shirakashi appears to be the inventor of SOPR for BTC, and he writes about SOPR: "In this analysis two important psychological turning points that significantly change the supply of bitcoin are going to be described by introducing a new oscillating indicator that signals when these major supply changes occur, using blockchain data." I interpret this reference to the psychology of "weak hands" getting flushed out of the market by selling at a loss as shown when SOPR sits below 1 for extended periods of time (bear), and when all the weak hands have left the market, we find a bottom.
Because I am an impatient learner, I needed further examples to understand fully. If someone sells you 1 Bitcoin at $50,000USD, that transaction is recorded on the blockchain. If you then sell it for $25,000USD, that is now a spent output which is obviously a negative 0.5 ratio, and would contribute to a SOPR lower than the value 1. Interestingly the SOPR tends to be very close to the value 1 nearly always. Which means that the aggregated data of all spent outputs is nowhere near as extreme as the example I gave (although I'm sure there are plenty of retail traders who bought the high and sold the bottom at a 50% loss).
If we rewind to extended periods of low points in the SOPR ratio, extended negative ratio periods coincide with low points. In the past 5 years the lowest ratio was around 0.88, which was December 2018, when the price of Bitcoin was heading lower than $4k USD. That particularly brutal bear market lasted 18 months and you can see that the SOPR was below value 1 for nearly the entire time, indicating that there was a long tail of weak hands realising losses the entire time.
---
Also present on the top chart is a brilliant little free indicator called Liq.Levels , wtf is all I can say, this a masterpiece of long/short liquidation data based on market maker behaviour in this case Binance's perpetual BTC/USDT leveraged futures (one of the most active retail leverage platforms). On this layout I have hidden all but the 25x liquidation points both short and long as it captures the widest spread and for the simplest visual as this is a glance-dashboard, on a single panel layout you can view the 50x and 100x which are tighter spreads. Liq.Levels also filters for a minimum of one million USD, so this is real value the market makers are getting out of bed for, essentially these levels are where the market maker really wants to push the price to. If you're new to leverage (don't do it! just buy at spot!), the reason they do this is to hunt the longs and the shorts and cause maximum liquidations (are you still trading with leverage?!).
---
The second panel is the famous Bitfinex Longs (green) and Shorts (red) . You can see currently the longs, since around the $39000 level went parabolic. The shorts are just tiny in comparison. The data from Bitfinex seems less erratic than those from other exchanges, so if you find looking at longs and shorts ratios useful, I'd suggest also looking at other websites to see the other major exchange long and short activity, liquidations, and ratios.
This info is used to monitor large moves by leveraged traders. While Bitfinex is not the best measure here (ideally you would want all major exchanges aggregated longs vs shorts, but I have not found such indicators on TV, only Bitfinex), you can check the data by comparing it to another exchange, for example Binance you can see that parabolic move the Longs made from the 11th of July to around the 14th of July (while the BTC price fell off a cliff from $30k to $20k), where the ratio of Longs vs Shorts on Binance also skewed heavily to the Long side.
This is another way to stack a probability. As the Longs level off and get flushed out (usually by mass liquidation!), this is another variable to find support or resistance. For example you can see the levelling off around 12 May 2022, Bitcoin's price found a short term bottom at $29k. Similarly and most recently you can see as the Longs levelled off from a hectic run up in the mid June 2022 selloff, the price found a short term bottom around $20k. You could say that recently or commonly this is a contrarian indicator, assuming that smart money is seeking to liquidate the maximum possible leveraged positions, so we can assume that generally these leveraged retail traders will largely make incorrect bets most of the time, hence historically as soon as Shorts leave the market, the price spikes up, and vice versa. So, another thing to watch.
---
Next we have a Crypto Fear & Greed Index , which as you can see nearly always oscillates in a tight rhythm with Bitcoin's price action. Above 75 (green dotted line) is extreme greed, below 25 (red dotted line) extreme fear. There are quite a few websites that attempt to measure crypto Fear & Greed, and even a variety of different indicators on TradingView, but this was the clearest visually I could find here. The inputs on this version according to the coder are stable coin flows (flight to safety), coin momentum (top 18 coin price relative to 30 day averages), and top 18 coin price high over the previous 90 days. So, it's interesting that despite this being at face value a rather complicated set of data with many inputs, that it just looks like a carbon copy of the Bitcoin chart. Bitcoin has a gravity that is inescapable for all things crypto right now.
The difference between looking at this indicator and simply looking at Bitcoin's chart is that it flattens out the action and has a set floor and a ceiling. You can see historically that the best buy times were when fear was at its "height" (where the yellow line is at its lowest). Another way to stack probabilities. At time of writing, is this a great time to buy? Fear appears to be leaving the market, we haven't had a commensurate price move up, so I'd be cautious. Like all these indicators, you can just overlay Bitcoin's price line and backtest the correlation in a few seconds. Buying when fear is at a maximum is usually easier said than done, though!
---
Lastly we have Liquidations by Volume , as per the coder this "shows actual liquidations on a per-candle basis by using the difference in volume between spot and futures markets." Blue line is futures volumes, yellow are spot volumes. The code for this indicator shows that it is the same BTCUSDT Perpetual Future's contract from Binance that we have in the Liq.Levels indicator, perfect.
Worth noting is that the community of coders at TradingView is a trader's dream. These sorts of customisable dashboards you can build are high value. Having worked for the largest international institutions I find many of these indicators are institutional grade and they have just a few hundred users sometimes, pretty crazy how early in the adoption curve we are with this. If you haven't experienced the "other side" of trading, compared to regular equities forex futures etc the TradingView tools and the crypto data and exchanges are just lightyears ahead.
Back to why look at liquidations? As institutions come into the market, and retail wallets on exchanges like Binance and many others continue to use leverage, the action in the derivative (in this case $BTCUSDTPERP) can and often does drive the price of the underlying. Market makers hunt the maximum liquidations, always. The market context is highly relevant here. During volatile periods it is a swinging contrarian indicator. If there has been massive green bars showing short liquidations pushing the price up, then we could be forming/hitting resistance levels and can see reversal/selloffs, and vice versa if there are massive red bars showing long liquidations pushing the price down, this can be hammering out support levels and we look to bounce. The longs and the shorts really do seem to be taking turns getting liquidated right now.
Also of relevance is the price action relative to the liquidations. Obviously if an institutional candle pushes the price up or down, there will be mass liquidations. But another scenario that occurs is when are light volumes on the derivatives such as $BTCUSDTPERP we have under the microscope here, but we have large Bitcoin price movements, then the reasons for the move can be understood differently, and we can use this and other contexts to draw conclusions such as for example a scenario where price goes up with light liquidations and derivative action, which could be interpreted as much stronger hands holding coins rather than simply margin calls.
---
Good luck!
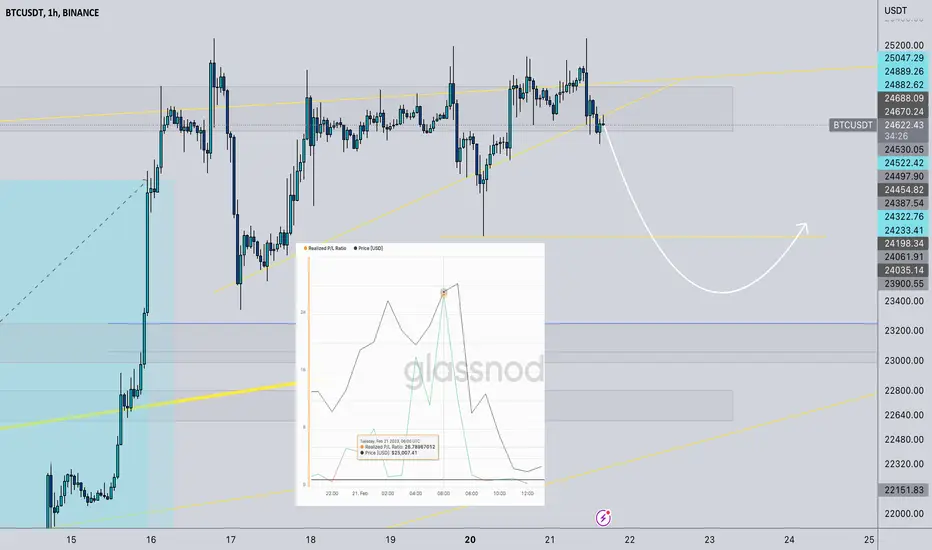
Bitcoin Supply ZoneHello traders
As you know bitcoin started to turn bullish weeks ago, market greed has increased, and dominance is above 42%.
On a day to day charts and the short term, Bitcoin hit a supply zone that is pretty strong in every timeframe.
I see a rejection from that zone, and I think this rejection might create a bearish momentum for the short term; in other word, I will call it a correction for a bullish trend.
I screenshotted a metric from Glassnode called realized Profit/loss Ratio, which shows that most of the network wallets are currently in profit. This is a risk for a price.
Note that this is an Intraday analysis and is only valid for a couple of days or even hours.
------------------------------------------------------------------------
What is your opinion? Comment below.
If you like the idea, please hit the boost button and follow me so you will get the updates. The information given is never financial advice. Always do your research too.
Good luck.
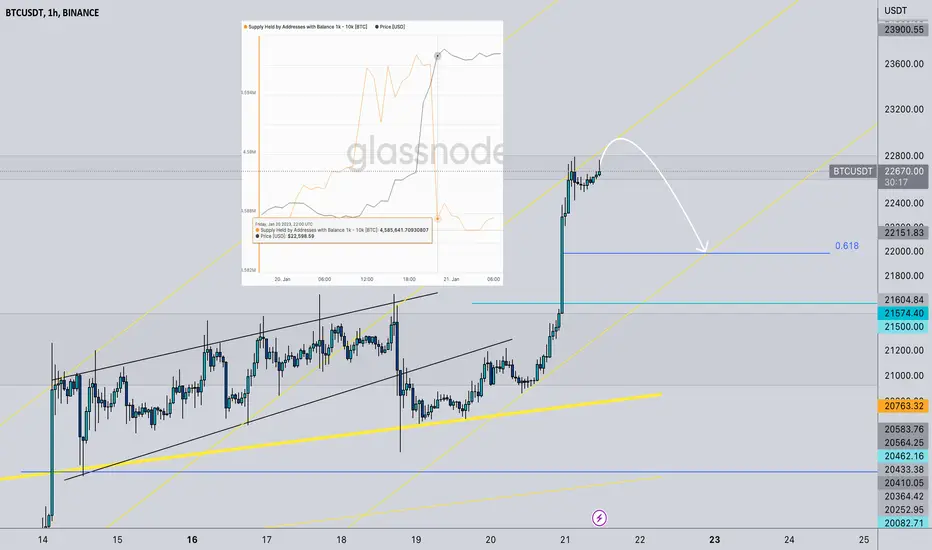
Correction of BitcoinHello Traders
As you can see in the chart above, Bitcoin is currently in a resistance zone which can cause capitulation.
I Screenshotted a metric from Glassnode called addresses with a supply of more than 1K, Which decreased drastically in the previous bitcoin bullish movement; this alone can confirm the technical scenario.
On the network data side, I saw most of the bitcoins that moved in the last day were mostly in profits—another risk to the price.
Note that this is an Intraday analysis and is only valid for a couple of days or even hours.
------------------------------------------------------------------------
What is your opinion? Comment below.
If you like the idea, please hit the boost button and follow me so you will get the updates. The information given is never financial advice. Always do your research too.
Good luck.
Correction and pullback For BITCOIN!!Hello Traders,
As you know, Bitcoin has rallied in the past few days, but it did not get corrected ever since.
Technically on the Logartmic chart, bitcoin has broken out of its bearish trendline. I expect the price to test its previous levels to get more liquidity to continue its bullish movement.
On the Onchain side, Long term holders moved their bitcoin in more than nine times in profit, which is a severe risk to the price. On the other metric I screenshotted from Glassnode, you can see that at the top of the price (today), Wallets moved their bitcoin in profit with a value of more than 60 million dollars. These two scenarios can confirm that a correction or a pullback is coming for the price.
Note that this is an Intraday analysis and is only valid for a couple of days or even hours.
------------------------------------------------------------------------
What is your opinion? Comment below.
If you like the idea, please hit the boost button and follow me so you will get the updates. The information given is never financial advice. Always do your research too.
Good luck.
