🤖 #BTCLIVE - 27.09 🤖🤖 #BTCLIVE - 27.09 🤖
TLDR:
Short-Term (-1 Day)
500:50- Bullish:Bearish
Mid-Term (1 Week+)
40:60
Bullish:Bearish
Long-Term (1 Month+)
40:60 - Bullish:Bearish
OVERVIEW:
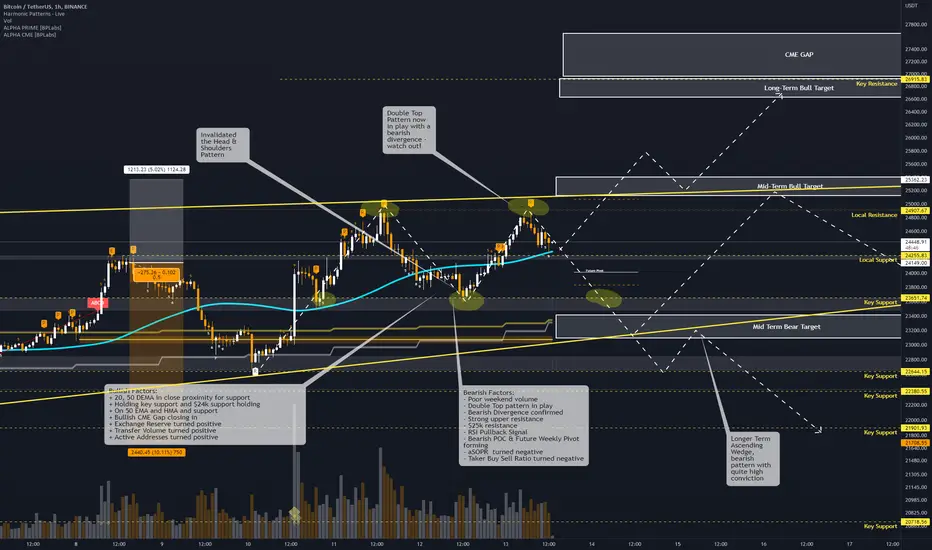
Huge break out last night with Binances biggest every BTC trading volume recorded. This is a big factor as to what it could mean. Ultimately my yesterdays analysis still stands albeit a little bit ahead of time with $21k as the immediate target with a very hard rejection to hit there. Currently hitting some resistance now with a significant volume node in play. We currently have a small ascending channel and bearish divergence on the 1hr although if we can hold then it is a pretty straight shot to $21k which will take us to the top of the weekly pivot and also macro trendline.
I am overall quite bullish in the short term to $21k and with an expected heavy rejection back to $18.7k losing $19.9k will likely see the start of the fall back to $18.7k - we may however sit and consolidate here for day or so. Friday options expiry will bring a huge amount of volatility.
TECHNICAL ANALYSIS:
BULLISH FACTORS:
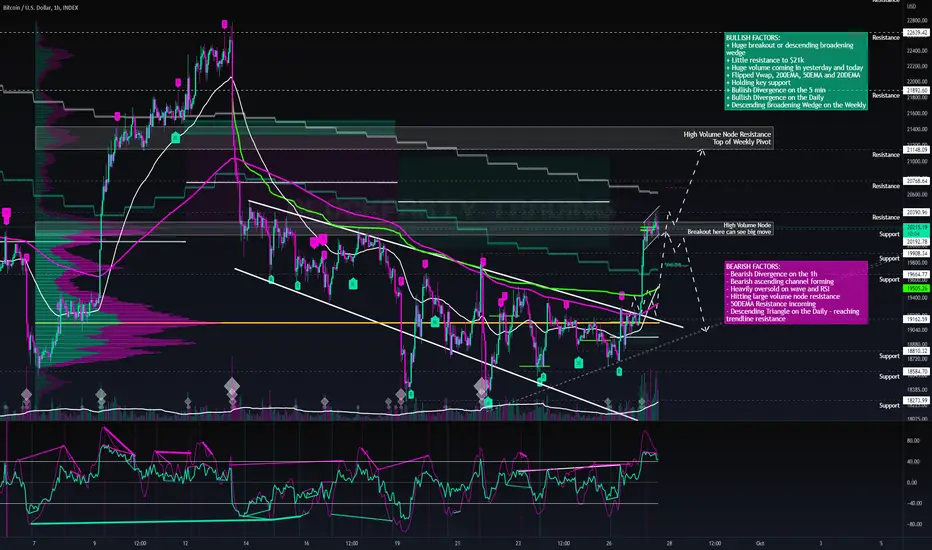
+ Huge breakout or descending broadening wedge
+ Little resistance to $21k
+ Huge volume coming in yesterday and today
+ Flipped Vwap, 200EMA, 50EMA and 20DEMA
+ Holding key support
+ Bullish Divergence on the 5 min
+ Bullish Divergence on the Daily
+ Descending Broadening Wedge on the Weekly
BEARISH FACTORS:
- Bearish Divergence on the 1h
- Bearish ascending channel forming
- Heavily oversold on wave and RSI
- Hitting large volume node resistance
- 50DEMA Resistance incoming
- Descending Triangle on the Daily - reaching trendline resistance
NEWS:
Bull:
+ Volatile week ahead Bitcoin Futures Expiry
+ Revolut has registered with regulator to offer ₿itcoin and crypto services in the U.K
+ Yesterday saw the biggest day of BTC volume ever on Binance!
+ FTX reportedly wins $50 million bid to acquire assets of bankrupt #crypto lender Voyager Digital.
Bear:
- Volatile week ahead with Powell, Bitcoin Futures Expiry
MARKET SENTIMENT:
Fear & Greed Index - Sep 27, 2022:
Today: 20 (Extreme Fear)
Yesterday: 21 (Extreme Fear)
Avg. 1W: 22 😱
Avg. 2W: 23 😱
Avg. 1M: 24 😱
Avg. 2M: 29 😱
Avg. 3M: 27 😱
Avg. 6M: 23 😱
Avg. 1Y: 32 😣
🔸 #Bitcoin
Price: $19,211
24h Low: $18,709
24h High: $19,275
MC Change: $7.4B (2.0%)
Dominance: 37.7%
24h: 2.3%
7d: -1.8%
14d: -14.0%
30d: -4.3%
60d: -19.4%
200d: -51.3%
1y: -55.7%
Onchain
🤖 #BTCLIVE - 26.09 🤖🤖 #BTCLIVE - 26.09 🤖
TLDR:
Short-Term (-1 Day)
70:30- Bullish:Bearish
Mid-Term (1 Week+)
60:40
Bullish:Bearish
Long-Term (1 Month+)
40:60 - Bullish:Bearish
OVERVIEW:
BTC is looking pretty strong short-midterm - with a target of approximately £$21k on the cards - core issue is breaking out of the immediate resistance specifically the 200EMA that has proved to be a significant issue. We are in a descending broadening wedge on the 1h which is a very bullish pattern so a break up is to be expected with a recent break up and retest of a local symmetical triangle it is looking positive. Unfortunately on the longer term timeframe further downside is to be expected as there is the lower trendline on the weekly descending wedge is still likely to be hit at approx. $16k possible a little lower. This route would make sense with the descneding triangle on the daily as we have been holding the 18.7k region for a long time with continual lower highs (quite a bearish pattern especially coming into it from a bearish trend) - this would marry up with the expected weekly descending wedge.
It looks like we have the potential for a bullish week up to $21k depending on what some of the fed comes out with along with the Bitcoin Futures Expiry and then a big rejection at $21k back to the $18.7k region with the possible start of the further downside as a long term lower low feels inevitable. Although once reached the target is to break out of the macro trendline which should put us at approx. $19k at that stage will signify the start of the bull run.
TECHNICAL ANALYSIS:
BULLISH FACTORS:
+ Bullish Historical Weekly Pivot up to $21k
+ Potential break out of local symmetrical triangle pattern and potential retest
+ Bullish Divergence on trendline support
+ Long term Descending Broadening wedge
+ Holding Daily support at $18.7k region
+ Descending Wedge on the Weekly
BEARISH FACTORS:
- Vwap, Trendline & 200 EMA showing strong resistance
- Trading below the Vwap
- Bearish Divergence on 1h
- Descending Triangle on the Daily
NEWS:
Bull:
+ Plan B’s stock-to-flow model predicts Bitcoin price has potential for 5x
+ Volatile week ahead with Powell, Bitcoin Futures Expiry
+ China orders state banks to buy stocks to prevent selling.
+ Disney is hiring an attorney to work on blockchain, metaverse, DeFi, & #NFT products.
Bear:
- Volatile week ahead with Powell, Bitcoin Futures Expiry
- DXY pumping GBP dropping
- Do Kwon arrest warrant issued
MARKET SENTIMENT:
Fear & Greed Index - Sep 26, 2022:
Today: 21 (Extreme Fear)
Yesterday: 24 (Extreme Fear)
Avg. 1W: 22 😱
Avg. 2W: 24 😱
Avg. 1M: 24 😱
Avg. 2M: 29 😱
Avg. 3M: 27 😱
Avg. 6M: 23 😱
Avg. 1Y: 32 😣
🔸 #Bitcoin
Price: $18,787
24h Low: $18,748
24h High: $19,142
MC Change: -$2.9B (-0.8%)
Dominance: 37.4%
24h: -0.8%
7d: -3.3%
14d: -13.6%
30d: -7.3%
60d: -18.0%
200d: -55.3%
1y: -56.2%

🤖 #BTCLIVE - 20.09 🤖🤖 #BTCLIVE - 20.09 🤖
TLDR:
Short-Term (-1 Day)
30:70- Bullish:Bearish
Mid-Term (1 Week+)
65:35
Bullish:Bearish
Long-Term (1 Month+)
70:30 - Bullish:Bearish
OVERVIEW:
There are a lot of bullish metrics popping up - although the majority of this weeks movement is going to be dictated by the interest rates on Weds. Is it going to be 75 or is it going to be 100. Ultimately 75 would be deemed somewhat bullish. 100 will absolutely sink the market - 50 would send it potentially to the moon although that is EXTREMELY unlikely, so don't get your hopes up.
From a completely TA point of view there is quite a lot of the bullish sentiment gearing up for quite a big pump - this coupled with a high expectation of 82% 75 would suggest that a bullish close to the week is on the cards. Expecting a slight bearish close to the day leading into tomorrow with approx target of 18.7k where we could potentially see it hold and consolidate (most likely) and bounce from there to approx. $19.8 (The bottom of the weekly pivot) We are back below the 200EMA which has been a significant resistance although I do have a fair bit of conviction in the Inverse H/S.
Losing the support at $18.7k could see a bit of a free fall to $18.2k and depending on the bearish volume taking out the support and buys then on to $17.6k although I think this will indicate some potential inside information about the interest rates being leaked. There fore shorting would not be bad idea up on losing $18.7k.
TECHNICAL ANALYSIS:
BULLISH FACTORS:
+ TD8 formed on the daily
+ Strong daily candle rejection
+ Approaching bottom of descending wedge on the Weekly
+ On Macro trendline support on the Weekly
+ Unconfirmed Divergence on the Weekly
Support
+ Contrarian Reversal on the Weekly
+ Bullish Divergence on the Daily
+ Very bullish weekly pivot at 19.8k to 20.5k
+ Loose bullish H/S pattern in play
+ Strong buy orders at 18.8k
+ ABCD Harmonic on the 5min
+ Entering Oversold on the 1hr
+ Currently holding the future pivot support
+ Descending broadening wedge
BEARISH FACTORS:
- Bearish Daily POC at $18.4k
- Broken Local support at $19.2k
- Bearish Divergence on the 5min
- Trading under the key DEMA's
NEWS:
Bull:
+ 75 BPS expected for Wednesday announcement which is not positive but "relatively" good for BTC
+ NASDAQ announced plans for a for bitcoin custody
+ Ripple Says XRP Owners Have no Rights or Contract So Token is Not A Security
cryptopanic.com
+ #Binance has been granted a Minimal Viable Product license in Dubai.
+ CFTC commissioner visits Ripple offices as decision in SEC case looms
cryptopanic.com
Bear:
- MicroStrategy has purchased an additional 301 #Bitcoin ($5.7 million). (Always causes market to dump)
- Wintermute Loses $160M in Latest DeFi Hack
cryptopanic.com
- The Search For Do Kwon Intensifies As South Korean Prosecutors Ask Interpol To Issue Red Notice Against The Terraform Labs
- SEC claims all Ethereum transactions fall under US jurisdiction because the nodes are "clustered more de… t.co
- Indian crypto exchange CoinDCX's Twitter account has been hacked to post $XRP scam links.
- Crypto promoter Ian Balina labels SEC charge ‘frivolous’, turns down settlement
cryptopanic.com
MARKET SENTIMENT:
Fear & Greed Index - Sep 20, 2022:
Today: 23 (Extreme Fear)
Yesterday: 21 (Extreme Fear)
Avg. 1W: 24 😱
Avg. 2W: 25 😱
Avg. 1M: 25 😱
Avg. 2M: 30 😱
Avg. 3M: 26 😱
Avg. 6M: 24 😱
Avg. 1Y: 32 😣
🔸 #Bitcoin
Price: $19,549
24h Low: $18,421
24h High: $19,612
MC Change: $1.9B (0.5%)
Dominance: 38.0%
24h: 0.6%
7d: -10.1%
14d: -2.2%
30d: -6.7%
60d: -16.1%
200d: -55.6%
1y: -59.5%

🤖 #BTCLIVE - 14.09 🤖🤖 #BTCLIVE - 14.09 🤖
TLDR:
Short-Term (-1 Day)
55:45- Bullish:Bearish
Mid-Term (1 Week+)
30:70
Bullish:Bearish
Long-Term (1 Month+)
70:30 - Bullish:Bearish
OVERVIEW:
We told you...respsect the Weekly Pivots and CME Gaps. They got filled - and price came to a sudden support, this is not a coincidence. Although now we are here it looks like there is going to be consolidation until the announcements begin from the fed kicking off at 1.30pm UK time. This will likely give a directional bias to the market and coming out of this bearish pennant. We might see some relief bounce here if it is neutral to bullish i.e below 75 BPS. There is a case that even if 75 does come in that this may already be dialled in and expected so a resulting pump could occur anything higher then we can expect further dumpage. On a macro level a rejection here can put us on a trajectory to $16k region now to play out this descending wedge on the weekly.
The bullish scenario is sub 75 BPS and breaking up on the bearish pennant to $20.8k where will hit first resistance and then a push up or major rejection here - either to 21.2k region or heavily down to sub 20k.
The bearish scenario will be a little more brutal if the BPS comes out bad - and will be a likely free fall again to 19.5k region with potential dead cat bounce and then further drop to 19k.
TECHNICAL ANALYSIS:
BULLISH FACTORS:
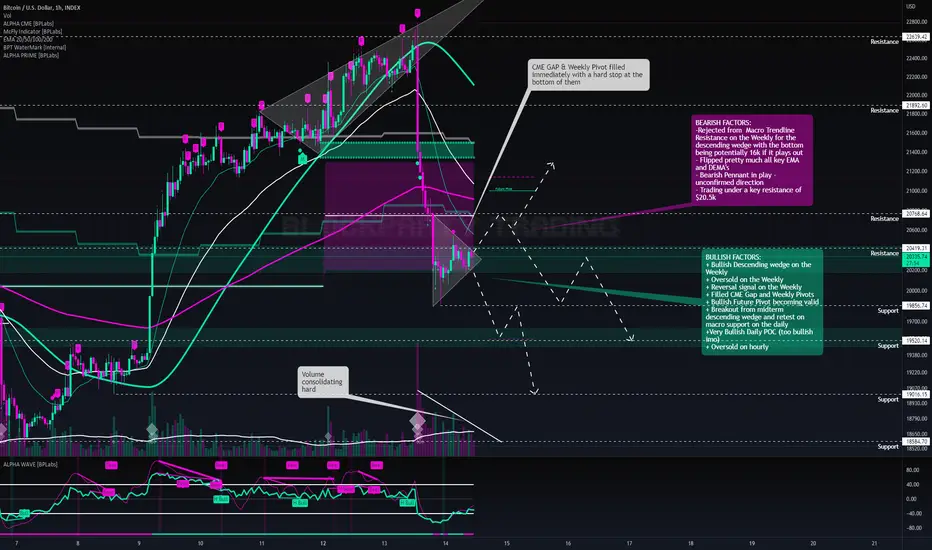
+ Bullish Descending wedge on the Weekly
+ Oversold on the Weekly
+ Reversal signal on the Weekly
+ Filled CME Gap and Weekly Pivots
+ Bullish Future Pivot becoming valid
+ Breakout from midterm descending wedge and retest on macro support on the daily
+Very Bullish Daily POC (too bullish imo)
+ Oversold on hourly
BEARISH FACTORS:
-Rejected from Macro Trendline Resistance on the Weekly for the descending wedge with the bottom being potentially 16k if it plays out
- Flipped pretty much all key EMA and DEMA's
- Bearish Pennant in play - unconfirmed direction
- Trading under a key resistance of $20.5k
NEWS:
Bull:
+ Russian international crypto payment to begin 2023
+ #Bitcoin hash rate reaches new high AGAIN!
+ Investment giants’ Fidelity, Charles Schwab and Citadel crypto exchange goes live
cryptopanic.com
+ Bahrain central bank set to test Bitcoin payment processing solution
cryptopanic.com
Bear:
- PPI m/m (Expected to affect market)
- Core PPI m/m
- CFTC Chair Behnam Speaks (Likely to be mentions of Crypto)
- Sept 15: $ETH merge expected sell off
- Sept 16: Mt. Gox Claims Deadline
- Sept 21: FOMC rate hike decision
- #Bitcoin mining difficulty reaches 32.05 trillion, a new all time high.
- Odds of 100bps interest rate hike hits 48%.
- President Biden says "it’ll take more time and resolve to bring inflation down."
MARKET SENTIMENT:
Fear & Greed Index - Sep 14, 2022:
Today: 27 (Fear)
Yesterday: 34 (Fear)
Avg. 1W: 26 😱
Avg. 2W: 24 😱
Avg. 1M: 27 😱
Avg. 2M: 30 😱
Avg. 3M: 25 😱
Avg. 6M: 24 😱
Avg. 1Y: 32 😣
🔸 #Bitcoin
Price: $20,171
24h Low: $20,071
24h High: $22,654
MC Change: -$40.9B (-9.6%)
Dominance: 37.5%
24h: -9.7%
7d: 1.9%
14d: -0.7%
30d: -17.4%
60d: -2.0%
200d: -47.4%
1y: -56.3%
🤖 #BTCLIVE - 13.09 🤖🤖 #BTCLIVE - 13.09 🤖
TLDR:
Short-Term (-1 Day)
50:50- Bullish:Bearish
Mid-Term (1 Week+)
35:65
Bullish:Bearish
Long-Term (1 Month+)
90:10 - Bullish:Bearish
OVERVIEW:
Bitcoin showing strength although some big bear flags showing up with the ascending wedge, bearish weekly pivot and CME gap that have a high chance always of getting filled usually in the short term too. Additionally we are coming up to the Macro trendline resistance on the weekly which is going to be a huge marker if we breakout as it has been in place since November 2021. It is a likely a very large amount of volume is going to require to break out. This is possible depending on the CPI data that drops which is potential assumed to be bullish. This could help break out - although there is a lot of bearish factors weighing against it for at least a small retrace.
Losing $22.2k would likely see a continuation down to the CME gap and weekly pivot regions with a top of $21.5k and a painful scenario at $20.2k. A bullish scenario would need to breakout above $23k for a good confirmation then it can pump as high as $25k.
HOWEVER with all the news that is coming out this month with the merge, MT.Gox and multiple items in the economic calendar volatility is going to be high
TECHNICAL ANALYSIS:
BULLISH FACTORS:
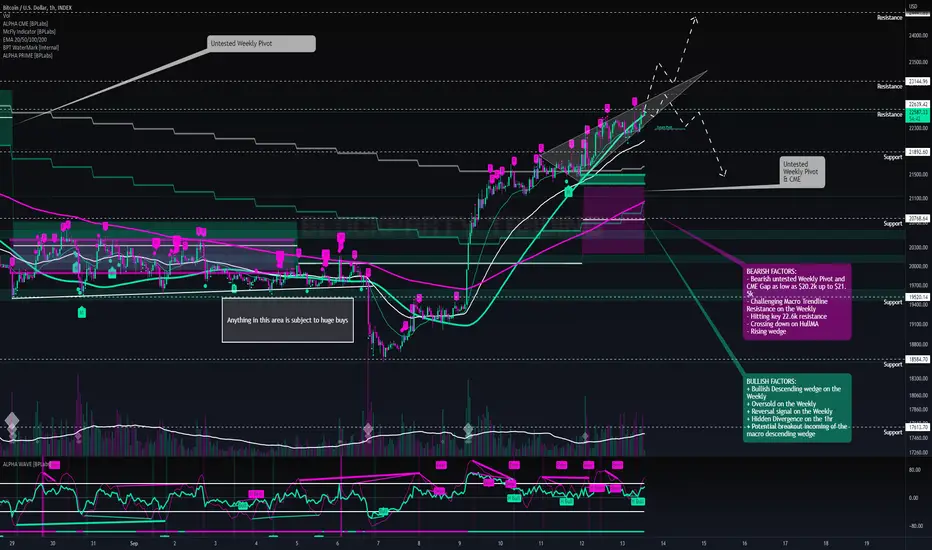
+ Bullish Descending wedge on the Weekly
+ Oversold on the Weekly
+ Reversal signal on the Weekly
+ Hidden Divergence on the 1hr
+ Potential breakout incoming of the macro descending wedge
BEARISH FACTORS:
- Bearish untested Weekly Pivot and CME Gap as low as $20.2k up to $21.5k
- Challenging Macro Trendline Resistance on the Weekly
- Hitting key 22.6k resistance
- Crossing down on HullMA
- Rising wedge
NEWS:
Bull:
+ CPI data expected to be slightly positive
+ Fidelity rumoured to be shifting their retail customers in to Crypto soon
+ Russia's Prime Minister asks regulators to finalize regulations for cross-border #crypto payments.
+ Chamber Of Digital Commerce Calls Out The SEC, Argues The US Needs A Bitcoin ETF
cryptopanic.com
+ Google Adds Ethereum (ETH) Merge Countdown Feature as Worldwide Interest Skyrockets
cryptopanic.com
Bear:
- Sept 13: CPI data
- Sept 15: $ETH merge expected sell off
- Sept 16: Mt. Gox Claims Deadline
- Sept 21: FOMC rate hike decision
- Sept 22: $ADA Vasil Hardfork
- New White House Report Suggests A Ban On Bitcoin Mining In The U.S.
cryptopanic.com
MARKET SENTIMENT:
Fear & Greed Index - Sep 13, 2022:
Today: 34 (Fear)
Yesterday: 25 (Extreme Fear)
Avg. 1W: 26 😱
Avg. 2W: 24 😱
Avg. 1M: 27 😱
Avg. 2M: 30 😱
Avg. 3M: 25 😱
Avg. 6M: 24 😱
Avg. 1Y: 32 😣
🔸 #Bitcoin
Price: $22,336
24h Low: $21,578
24h High: $22,448
MC Change: $11.4B (2.7%)
Dominance: 38.5%
24h: 2.7%
7d: 11.8%
14d: 13.6%
30d: -8.5%
60d: 10.4%
200d: -40.2%
1y: -50.6%
🤖 #BTCLIVE - 08.09 🤖🤖 #BTCLIVE - 08.09 🤖
TLDR:
Short-Term (-1 Day)
30:70- Bullish:Bearish
Mid-Term (1 Week+)
40:60
Bullish:Bearish
Long-Term (1 Month+)
90:10 - Bullish:Bearish
OVERVIEW:
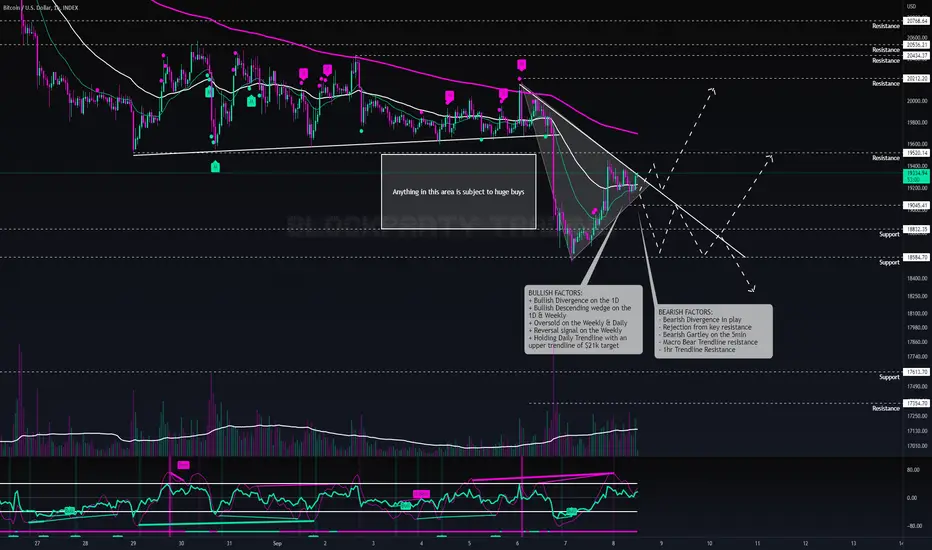
After a massive breakdown of market structure we have finally made the suggested $18.8k potential bottom. Things are not looking particularly bullish though and with Jerome Powells talking in the coming hours the market really could go anywhere. Likelihood is that it will go down a little further as we are slightly more bearish on the technical analysis side of things with a potential descending triangle forming if we break down on this pennant structure (which is technically bullish on the short term timeframe) although with bearish divergences and general bearish sentiment I am not holding much hope for it.
If we break down out of this pennant and below $19k then I would have a conservative stop at $18.5k to find support with a bounce there. Breaking up and retesting the support trendline/$19k could see a break up to and retest of $20k quite quickly. Incredibly volatile at the moment so watch out with trades.
TECHNICAL ANALYSIS:
BULLISH FACTORS:
+ Bullish Divergence on the 1D
+ Bullish Descending wedge on the 1D & Weekly
+ Oversold on the Weekly & Daily
+ Reversal signal on the Weekly
+ Holding Daily Trendline with an upper trendline of $21k target
BEARISH FACTORS:
- Bearish Divergence in play
- Rejection from key resistance
- Bearish Gartley on the 5min
- Macro Bear Trendline resistance
- 1hr Trendline Resistance
NEWS:
Bull:
+ Russian Central Bank & Finance Ministry agree to legalize cryptocurrency use for cross-border payments
+ Saudi Arabia's central bank has appointed cryptocurrency chief to advance digital goals.
+ Iran is now licensing #Bitcoin miners under new regulatory framework.
+ The ETH merge has begun, deposits and withdrawals being held
+ Switzerland’s SEBA Bank Launches Ethereum Staking Services for Institutional Clients
Bear:
- POWELL IS SPEAKING TODAY!
- Sept 13: CPI data
- Sept 15: $ETH merge expected sell off
- Sept 16: Mt. Gox Claims Deadline
- Sept 21: FOMC rate hike decision
- Sept 22: $ADA Vasil Hardfork
- Voyager To Liquidate Assets at Auction cryptopanic.com
- Coinbase, FTX, Binance and other exchanges fall under SEC jurisdiction, says SEC Chair
- IMF Executives Call for Global Crypto Regulatory Regime To Keep Consumers Safe
MARKET SENTIMENT:
Fear & Greed Index - Sep 08, 2022:
Today: 20 (Extreme Fear)
Yesterday: 24 (Extreme Fear)
Avg. 1W: 22 😱
Avg. 2W: 24 😱
Avg. 1M: 30 😱
Avg. 2M: 29 😱
Avg. 3M: 24 😱
Avg. 6M: 24 😱
Avg. 1Y: 33 😣
🔸 #Bitcoin
Price: $19,281
24h Low: $18,644
24h High: $19,479
MC Change: $8.1B (2.3%)
Dominance: 36.1%
24h: 2.3%
7d: -2.6%
14d: -10.6%
30d: -16.9%
60d: -11.8%
200d: -51.9%
1y: -63.4%
🤖 #BTCLIVE - 05.09 🤖🤖 #BTCLIVE - 05.09 🤖
TLDR:
Short-Term (-1 Day)
60:40- Bullish:Bearish
Mid-Term (1 Week+)
30:70
Bullish:Bearish
Long-Term (1 Month+)
80:20 - Bullish:Bearish
OVERVIEW:
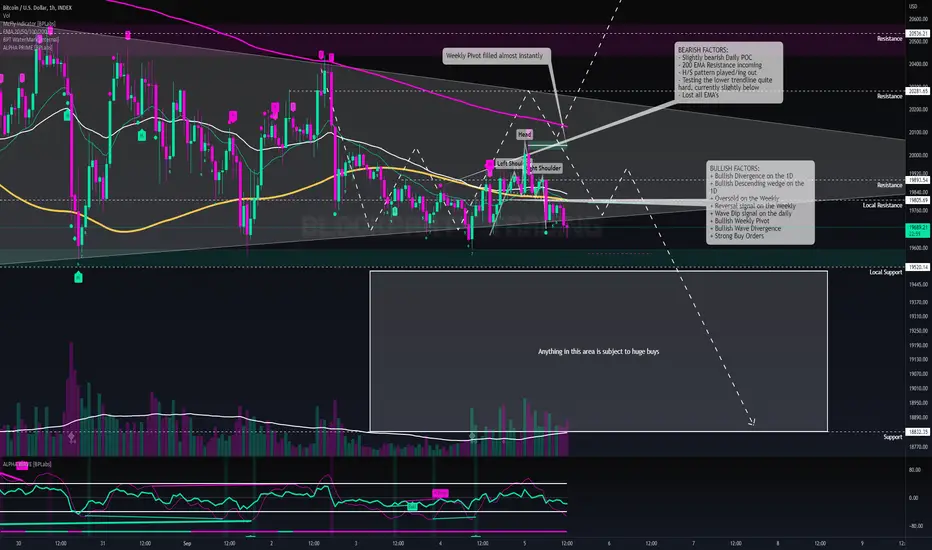
We are holding on for dear life to this lower trendline and some local supports, the key support is still looking at $19.5k to hold there are some decent buy orders in play protecting this for now. With the US Markets closed today it could allow for a bit of relief away from the usual sell off when there is a bearish sentiment leading into it. From a macro perstpective things are looking pretty good although with some midterm bearish movement factored in. IF we can hold this support and get back above $19.8k then it should give a very good signal of continued movement to the $20.2k region. Losing $19.5k puts us firmly on track to $18.8k. We ideally also need the dollar to start losing some strength too to help some investment come into BTC
There is some pretty inspiring news from Russia and Iran and additionally Saudi Arabia bringing in a Crypto arm to the back - this is good news but probably won't see any effect from it for a while.
Thursday could bring absolutely anything with Powell speaking again so watch out.
TECHNICAL ANALYSIS:
BULLISH FACTORS:
+ Bullish Divergence on the 1D
+ Bullish Descending wedge on the 1D
+ Oversold on the Weekly
+ Reversal signal on the Weekly
+ Wave Dip signal on the daily
+ Bullish Weekly Pivot
+ Bullish Wave Divergence
+ Strong Buy Orders
BEARISH FACTORS:
- Slightly bearish Daily POC
- 200 EMA Resistance incoming
- H/S pattern played/ing out
- Testing the lower trendline quite hard, currently slightly below
- Lost all EMA's
NEWS:
Bull:
+ Russian Central Bank & Finance Ministry agree to legalize cryptocurrency use for cross-border payments
+ Nigerian Govt considering a 'special economic zone' for cryptocurrency businesses.
+ Saudi Arabia's central bank has appointed cryptocurrency chief to advance digital goals.
+ Iran is now licensing #Bitcoin miners under new regulatory framework.
Bear:
- Sept 13: CPI data
- Sept 15: $ETH merge expected sell off
- Sept 16: Mt. Gox Claims Deadline
- Sept 21: FOMC rate hike decision
- Sept 22: $ADA Vasil Hardfork
- stocks.apple.com
Russia cuts off gas exports to Europe via Nord Stream indefinitely
- Powell to talk on Thursday
- 🇺🇸 US Dollar Index hits 20-year high of 110.25
METRICS (Last 24 hours):
EXCHANGE:
- Exchange Reserve - As the exchange reserve continues to rise, it indicates higher selling pressure.
Last Value:
2,322,706.6
24H%:
0%
7D%:
+1%
+ Exchange Netflow Total - Net deposits on exchanges are low compared to the 7-day average. Lower deposits can be interpreted as lower selling pressure.
Last Value:
1,423.02
24H%:
+176%
MINERS:
+ TURNED POSITIVE
+ Miners' Position Index ( MPI ) - Miners' are selling less holdings compared to its one-year average.
Holding
Last Value:
-1.0397
24H%:
+11%
/ TURNED NEUTRAL
/ Puell Multiple - Miner's revenue is in a moderate range, compared to its one-year average.
Moderate revenue
Last Value:
0.56831915
24H%:
+14%
ON-CHAIN:
- TURNED NEGATIVE
- aSOPR -More investors are selling at a profit. In the middle of a bull market, it can indicate a market top.
Realizing profit
Last Value:
1.0029
24H%:
+1%
+ Binary CDD - Long term holders' movement in the last 7days were lower than the average. They have a motive to hold their coins
Low long-term holders' movement
Last Value:
0.42857142
24H%:
-
- Net Unrealized Profit and Loss (NUPL) -Investors are in a Capitulation phase where they are currently facing unrealized losses. It indicates the decreasing motive to realize loss which leads to a decrease in sell pressure.
Captulation
Last Value:
-0.09330793
24H%:
+4%
+ TURNED POSITIVE
+ Transfer Volume - The total number of coins transferred has increased by 148.00% compared to yesterday.
Last Value:
3,061,086.78
24H%:
+148%
+ TURNED POSITIVE
+ Active Addresses - The total number of active wallets used to send and receive coins has increased by 138.00% compared to yesterday.
Last Value:
1,137,186
24H%:
+138%
+ Transactions - The total number of transactions has decreased by -39.00% compared to yesterday.
Last Value:
214,340
24H%:
+110%
INVESTOR SENTIMENT
- TURNED NEGATIVE
Coinbase Premium - US investors' buying pressure is relatively weak in Coinbase.
- Korea Premium -Korean retail investors' buying pressure is relatively strong.
- Fund Premium - Investors in funds and trusts including Grayscale have relatively weak buying sentiment.
DERIVATIVES
- TURNED NEGATIVE -
- Funding Rate - Short position traders are dominant and are willing to pay long traders.
Last Value:
-0.00607986
24H%:
-28%
- TURNED NEGATIVE
- Taker Buy Sell Ratio - Selling sentiment is dominent in the derivatives market. More sell orders are filled by takers.
Buy:
0.51493069
Sell:
0.48506931
/ Open Interest - As OI increases, it indicates more liquidity, volatility , and attention are coming into the derivative market. The increasing trend in OI could support the current ongoing price trend
Last Value:
8,820,290,269.98
24H%:
-1%
7D%:
+3%
- Liquidation - 6507028.91 of long positions were liquidated in the last 24 hours.
Long:
6,507,028.9
Short:
4,006,594.45
MARKET SENTIMENT:
Fear & Greed Index - Sep 05, 2022:
Today: 23 (Extreme Fear)
Yesterday: 20 (Extreme Fear)
Avg. 1W: 23 😱
Avg. 2W: 25 😱
Avg. 1M: 31 😣
Avg. 2M: 29 😱
Avg. 3M: 24 😱
Avg. 6M: 24 😱
Avg. 1Y: 33 😣
🔸 #Bitcoin
Price: $19,988
24h Low: $19,649
24h High: $20,021
MC Change: $3.0B (0.8%)
Dominance: 37.2%
24h: 0.8%
7d: -0.4%
14d: -5.6%
30d: -11.9%
60d: -1.0%
200d: -55.2%
1y: -60.0%
🤖 #BTCLIVE - 03.09 🤖🤖 #BTCLIVE - 03.09 🤖
TLDR:
Short-Term (-1 Day)
70:30- Bullish:Bearish
Mid-Term (1 Week+)
40:60
Bullish:Bearish
Long-Term (1 Month+)
80:20 - Bullish:Bearish
TECHNICAL ANALYSIS:
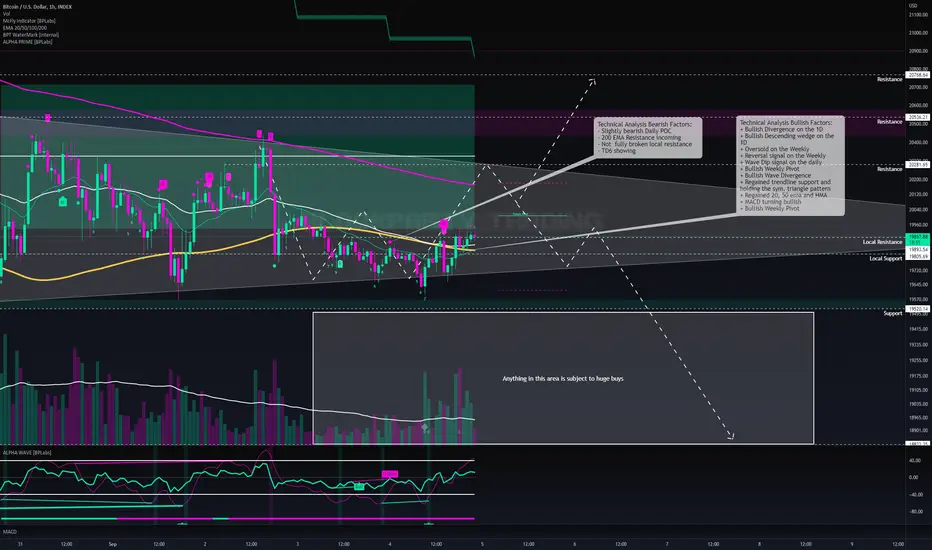
We seem to be holding the bottom of the sym. triangle quite nicely, with a fair few bullish factors lining up. I would be heavily committed to a long to at least $20.2k altough with it being Sunday and the market comign back online in a few hours still these movements can be quite misleading. When the Asian market comes on line it should be quite telling.
The key areas to watch are $19.5k as losing that not only confirms a break down out of the pattern but a break of a very key support and further downside is expected in the short term to potentially $18.8k although holding should comfortably see $20.2k although I am not particularly bullish beyond and expect a rejection there.
Technical Analysis Bullish Factors:
+ Bullish Divergence on the 1D
+ Bullish Descending wedge on the 1D
+ Oversold on the Weekly
+ Reversal signal on the Weekly
+ Wave Dip signal on the daily
+ Bullish Weekly Pivot
+ Bullish Wave Divergence
+ Regained trendline support and holding the sym. triangle pattern
+ Regained 20, 50 ema and HMA
+ MACD turning bullish
+ Bullish Weekly Pivot
Technical Analysis Bearish Factors:
- Slightly bearish Daily POC
- 200 EMA Resistance incoming
- Not fully broken local resistance
- TD6 showing
NEWS:
Bull:
+Nada
Bear:
- Zip
🤖 #BTCLIVE - 03.09 🤖🤖 #BTCLIVE - 03.09 🤖
TLDR:
Short-Term (-1 Day)
60:40- Bullish:Bearish
Mid-Term (1 Week+)
30:70
Bullish:Bearish
Long-Term (1 Month+)
80:20 - Bullish:Bearish
TECHNICAL ANALYSIS:
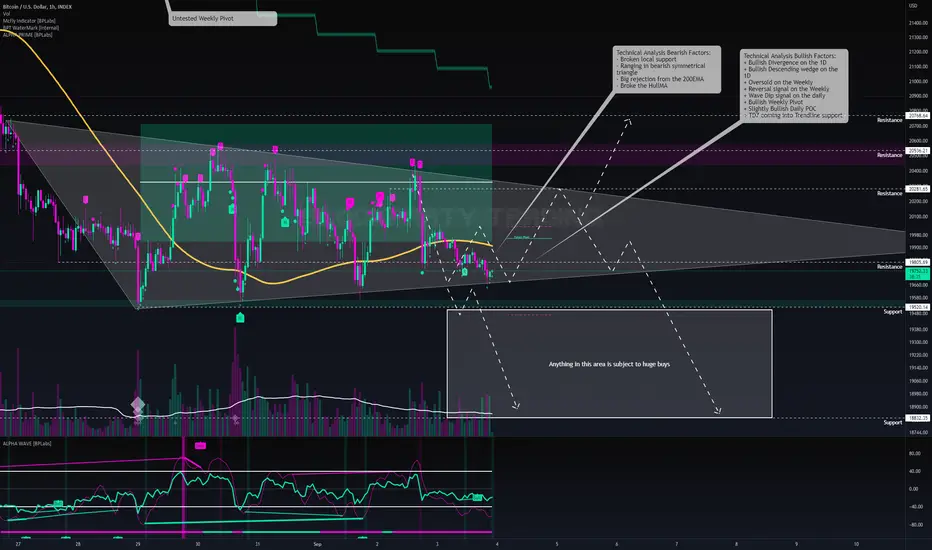
We are tracking at the bottom of the symmetrical triangle now, directly on the trendline support, currently showing a TD7 formed - currently diminishing volume. Breaking down on the triangle can lead to a much bigger drop with the significant support needing to hold sitting at $19.5k - key bear targets are sitting at $18.8 that are very achievable although I am expecting huge buys to appear any where between $20k and and $18.8k that could turn the tide to bullish quite easily. Although I am slightly bullish for the short term and don't think we will break down on this test yet so a bullish target of $20.2k before a bigger sell off I feel is very achievable from here.
General sentiment in the market with the Mt.Gox news and ETH merge dropping in September are looking like they could be leading to a sell off, coupled with the heavily bearish sentiment attached to September $18.8k wouldn't be too surprising.
Technical Analysis Bullish Factors:
+ Bullish Divergence on the 1D
+ Bullish Descending wedge on the 1D
+ Oversold on the Weekly
+ Reversal signal on the Weekly
+ Wave Dip signal on the daily
+ Bullish Weekly Pivot
+ Slightly Bullish Daily POC
+ TD7 coming into Trendline support
Technical Analysis Bearish Factors:
- Broken local support
- Ranging in bearish symmetrical triangle
- Big rejection from the 200EMA
- Broke the HullMA
NEWS:
Bull:
+
Bear:
- Sept 13: CPI data
- Sept 15: $ETH merge expected sell off
- Sept 16: Mt. Gox Claims Deadline
- Sept 21: FOMC rate hike decision
- Sept 22: $ADA Vasil Hardfork
- stocks.apple.com
Russia cuts off gas exports to Europe via Nord Stream indefinitely
METRICS (Last 24 hours):
EXCHANGE:
- Exchange Reserve - As the exchange reserve continues to rise, it indicates higher selling pressure.
Last Value:
2,316,182.55
24H%:
0%
7D%:
+1%
+ TURNED POSITIVE
+ Exchange Netflow Total - Net deposits on exchanges are low compared to the 7-day average. Lower deposits can be interpreted as lower selling pressure.
Last Value:
982.3029
24H%:
+157%
MINERS:
/ Miners' Position Index ( MPI ) - Miners' are selling holdings in a moderate range compared to its one-year average.
Moderately selling
Last Value:
1.7051
24H%:
-364%
+ Puell Multiple - Miner's revenue is decreasing significantly compared to the cost they put in. This could indicate that price is undervalued along with the increasing miner's motive to hold their coins.
Low revenue
Last Value:
0.44632367
24H%:
-5%
ON-CHAIN:
+ aSOPR - More investors are selling at a loss. In the middle of a bear market, it can indicate a market bottom.
Realizing loss
Last Value:
0.97674869
24H%:
+1%
+ Binary CDD - Long term holders' movement in the last 7days were lower than the average. They have a motive to hold their coins
Low long-term holders' movement
Last Value:
0.42857142
24H%:
-
- Net Unrealized Profit and Loss (NUPL) -Investors are in a Capitulation phase where they are currently facing unrealized losses. It indicates the decreasing motive to realize loss which leads to a decrease in sell pressure.
Captulation
Last Value:
-0.0921114
24H%:
+12%
- Transfer Volume - The total number of coins transferred has decreased by -65.00% compared to yesterday.
- Active Addresses -The number of active wallets used to send and receive coins has decreased by -38.00% compared to yesterday.
+ Transactions - The total number of transactions has decreased by -39.00% compared to yesterday.
INVESTOR SENTIMENT
+ TURNED POSITIVE
+ Coinbase Premium - US investors' buying pressure is relatively strong in Coinbase.
- Korea Premium -Korean retail investors' buying pressure is relatively strong.
- Fund Premium - Investors in funds and trusts including Grayscale have relatively weak buying sentiment.
DERIVATIVES
TURNED POSITIVE -
- Funding Rate - Short position traders are dominant and are willing to pay long traders.
Last Value:
-0.00504039
24H%:
+578%
+ Taker Buy Sell Ratio - Buying sentiment is dominent in the derivatives market. More buy orders are filled by takers.
Buy:
0.51493069
Sell:
0.48506931
/ Open Interest - As OI increases, it indicates more liquidity, volatility , and attention are coming into the derivative market. The increasing trend in OI could support the current ongoing price trend
Last Value:
8,672,447,353.18
24H%:
+5%
7D%:
+3%
- Liquidation - 5861915.48 of long positions were liquidated in the last 24 hours.
Long:
5,861,915.48
Short:
772,838.74
MARKET SENTIMENT:
Fear & Greed Index - Sep 03, 2022:
Today: 21 (Extreme Fear)
Yesterday: 25 (Extreme Fear)
Avg. 1W: 24 😱
Avg. 2W: 26 😱
Avg. 1M: 32 😣
Avg. 2M: 29 😱
Avg. 3M: 23 😱
Avg. 6M: 24 😱
Avg. 1Y: 33 😣
🔸 #Bitcoin
Price: $19,969
24h Low: $19,771
24h High: $20,428
MC Change: -$3.2B (-0.8%)
Dominance: 37.4%
24h: -0.9%
7d: -1.5%
14d: -4.7%
30d: -12.6%
60d: -1.4%
200d: -53.2%
1y: -59.5%
🤖 #BTCLIVE - 02.09 🤖🤖 #BTCLIVE - 02.09 🤖
TLDR:
Short-Term (-1 Day)
25:75- Bullish:Bearish
Mid-Term (1 Week+)
50:50
Bullish:Bearish
Long-Term (1 Month+)
90:10 - Bullish:Bearish
TECHNICAL ANALYSIS:
With the potential bearish announcement today we would expect some drop in BTC - trading at the top of the descending triangle would suggest this also if a rejection continues. Targets would be an initial 19.7k and then potential heavy drop to $18.8k as max pain price. Although I am not very confident we will spend that much time below $20k at all anymore. A break up out of this triangle just race up to $20.8k where the main resistance wand test will be if this is a proper bullish move.
Ultimately things are still pretty bearish short term although there are some huge bullish macro factors in play that are likely going to kick in soon, $18.8k is my current max pain although I am not doubting we will even see that as buyers seem to be picking up anything below $20k at the moment. We want to be breaking out fully from the is descending wedge on the daily and then it is off to the races with a pretty conservative $22k on the cards as initial target.
Technical Analysis Bullish Factors:
+ Bullish Divergence on the 1D
+ Bullish Descending wedge on the 1D
+ Oversold on the Weekly
+ Reversal signal on the Weekly
+ Wave Dip signal on the daily
Technical Analysis Bearish Factors:
- Oversold on the 5min
- Hitting Trendline resistance
- Bearish Descending Triangle Pattern
- Bearish Divergence on the 1hr
- Bearish Pullback signal on the 1hr
- Bearish ABCD pattern on the 5min
- 200EMA resistance on the 1hr
NEWS:
Bull:
+ Brazils largest bank unibanco hiring BTC software devs
+ ETH Merge moves closer
Bear:
- Unemployment Rate expected to remain level
Issue: Interest rates can only go up if the unemployment rate is fine. Which could cause a dump
- US dollar smashes 20 Year high, bad for BTC and all other stocks
- Saylor being sued for Tax Fraud
METRICS (Last 24 hours):
EXCHANGE:
TURNED NEGATIVE -
- As the exchange reserve continues to rise, it indicates higher selling pressure.
- Exchange Netflow Total - Net deposits on exchanges are high compared to the 7-day average. Higher deposits can be interpreted as higher selling pressure.
MINERS:
/ Miners' Position Index ( MPI ) - Miners' are selling holdings in a moderate range compared to its one-year average.
Low revenue
Last Value:
0.47098618
24H%:
-6%
TURNED POSITIVE +
+ Puell Multiple - Miner's revenue is decreasing significantly compared to the cost they put in. This could indicate that price is undervalued along with the increasing miner's motive to hold their coins.
Moderate revenue
Last Value:
0.5305056
24H%:
-2%
ON-CHAIN:
+ aSOPR - More investors are selling at a loss. In the middle of a bear market, it can indicate a market bottom.
Realizing loss
Last Value:
0.96664604
24H%:
-2%
+ Binary CDD - Long term holders' movement in the last 7days were lower than the average. They have a motive to hold their coins
Low long-term holders' movement
Last Value:
0.42857142
- Net Unrealized Profit and Loss (NUPL) -Investors are in a Capitulation phase where they are currently facing unrealized losses. It indicates the decreasing motive to realize loss which leads to a decrease in sell pressure.
Captulation
Last Value:
-0.07041003
24H%:
-14%
- Transfer Volume - The total number of coins transferred has decreased by -24.00% compared to yesterday.
TURNED NEGATIVE -
- Active Addresses -The number of active wallets used to send and receive coins has decreased by -40.00% compared to yesterday.
TURNED NEGATIVE -
+ Transactions - The total number of transactions has decreased by -40.00% compared to yesterday.
INVESTOR SENTIMENT
TURNED NEGATIVE -
- Coinbase Premium - US investors' buying pressure is relatively weak in Coinbase.
- Korea Premium -Korean retail investors' buying pressure is relatively strong.
- Fund Premium - Investors in funds and trusts including Grayscale have relatively weak buying sentiment.
DERIVATIVES
TURNED POSITIVE +
+ Funding Rate - Long position traders are dominant and are willing to pay to short traders.
Last Value:
0.00315397
24H%:
-521%
+ Taker Buy Sell Ratio - Buying sentiment is dominent in the derivatives market. More buy orders are filled by takers.
Buy:
0.60559476
Sell:
0.39440524
/ Open Interest - As OI increases, it indicates more liquidity, volatility , and attention are coming into the derivative market. The increasing trend in OI could support the current ongoing price trend
Last Value:
8,406,535,733.99
24H%:
+2%
7D%:
-1%
TURNED NEGATIVE -
- Liquidation - 14988488.82 of long positions were liquidated in the last 24 hours.
Long:
14,988,488.82
Short:
8,328,677.12
MARKET SENTIMENT:
Fear & Greed Index - Sep 02, 2022:
Today: 25 (Extreme Fear)
Yesterday: 20 (Extreme Fear)
Avg. 1W: 25 😱
Avg. 2W: 26 😱
Avg. 1M: 32 😣
Avg. 2M: 29 😱
Avg. 3M: 23 😱
Avg. 6M: 24 😱
Avg. 1Y: 33 😣
🔸 #Bitcoin
Price: $20,141
24h Low: $19,615
24h High: $20,188
MC Change: $1.7B (0.4%)
Dominance: 37.5%
24h: 0.6%
7d: -6.8%
14d: -13.4%
30d: -12.6%
60d: 4.3%
200d: -52.3%
1y: -58.7%
@FearGreedIndex
🤖 #BTCLIVE - 30.08 🤖🤖 #BTCLIVE - 30.08 🤖
TLDR:
Short-Term (<1 Day)
40:60- Bullish:Bearish
Mid-Term (<1 Week)
50:50
Bullish:Bearish
Long-Term (1 Month
80:20 - Bullish:Bearish
TECHNICAL ANALYSIS:
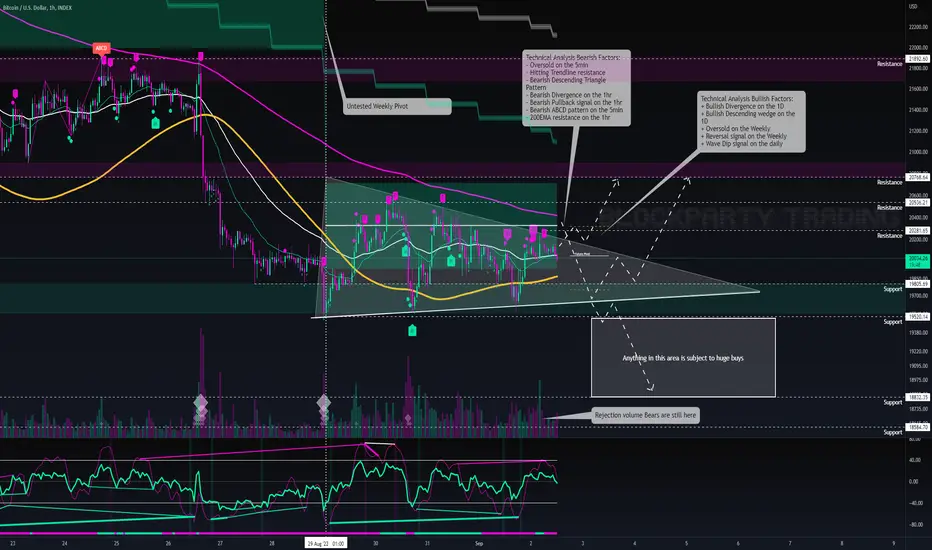
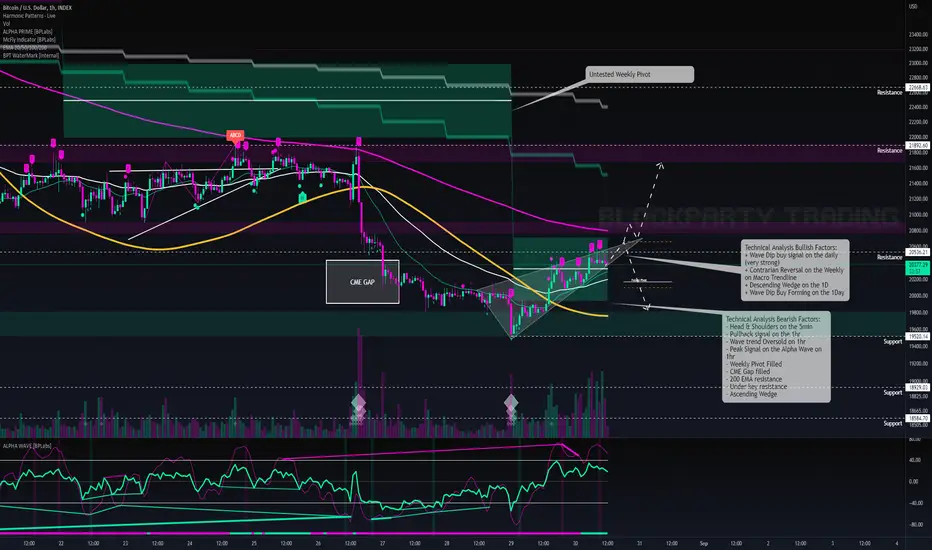
Alot of interesting data at the moment, in the short-term everything is looking quite stretched and oversold most notably with an ascending wedge forming, along with a few sell signals on resistance, we will need some volume to break up out of this at the moment it is holding, I am leaning quite bearish in the short term due to this with a break down of the triangle to potentially 19.5k - 19.8k area of support. A break up however will move to $21.7k with little resistance in the way.
The long term however is a different story with some big bullish signals showing now most notably the contrarian reversal signal on the weekly for alpha prime sat on a macro trendline support, this coupled with the newly formed descending wedge on the daily is telling me we are not far off an imminent push up over the next 4 weeks, this could be the start....bull rally loading!
Otherwise coming to the end of the consolidation now so biggish move expected.
Technical Analysis Bullish Factors:
+ Wave Dip buy signal on the daily (very strong)
+ Contrarian Reversal on the Weekly on Macro Trendline
+ Descending Wedge on the 1D
+ Wave Dip Buy Forming on the 1Day
Technical Analysis Bearish Factors:
- Head & Shoulders on the 5min
- Pullback signal on the 1hr
- Wave trend Oversold on 1hr
- Peak Signal on the Alpha Wave on 1hr
- Weekly Pivot Filled
- CME Gap filled
- 200 EMA resistance
- Under key resistance
- Ascending Wedge
NEWS:
Bull:
+ Iran passes law enabling Bitocin and crypto payments for imports
cryptopanic.com
+ Indonesia's biggest tech company, GoTo, just bought a Bitcoin exchange.
+ Qatar grants the country's first digital payments services license to iPay.
+ Singapore High Court grants #crypto lender Holdnaut protection from investors.
+ 7,507 $BTC ($151 million) has been taken off exchanges in the last 7 days.
+ The whales addresses controlling 1k to 10k BTC are starting to accumulate coins on-chain
Bear:
- Chinese police arrest over 200 people linked to one of the country’s largest banking scandals ever.
- FBI issues #DeFi crypto vulnerabilities warning.
METRICS (Last 24 hours):
EXCHANGE:
+ Exchange Reserve - As the exchange reserve continues to fall, it indicates lower selling pressure.
- Exchange Netflow Total - Net deposits on exchanges are high compared to the 7-day average. Higher deposits can be interpreted as higher selling pressure.
MINERS:
/ Miners' Position Index ( MPI ) - Miners' are selling holdings in a moderate range compared to its one-year average.
Moderately selling
Last Value:
-0.90908933
24H%:
-10%
/ Puell Multiple -Miner's revenue is in a moderate range, compared to its one-year average.
Moderate revenue
Last Value:
0.5305056
24H%:
-2%
ON-CHAIN:
+ aSOPR - More investors are selling at a loss. In the middle of a bear market, it can indicate a market bottom.
Realizing loss
Last Value:
0.99056737
24H%:
-1%
+ Binary CDD - Long term holders' movement in the last 7days were lower than the average. They have a motive to hold their coins
Low long-term holders' movement
Last Value:
0.28571428
24H%:
+100%
- Net Unrealized Profit and Loss (NUPL) -Investors are in a Capitulation phase where they are currently facing unrealized losses. It indicates the decreasing motive to realize loss which leads to a decrease in sell pressure.
Captulation
Last Value:
-0.05740991
24H%:
-35%
- Transfer Volume - The total number of coins transferred has decreased by -36.00% compared to yesterday.
TURNED POSITIVE +
+ Active Addresses - The total number of active wallets used to send and receive coins has increased by 19.00% compared to yesterday.
TURNED POSITIVE +
+ Transactions - The total number of transactions has increased by 24.00% compared to yesterday.
INVESTOR SENTIMENT
TURNED POSITIVE +
+ Coinbase Premium - US investors' buying pressure is relatively strong in Coinbase.
- Korea Premium -Korean retail investors' buying pressure is relatively strong.
- Fund Premium - Investors in funds and trusts including Grayscale have relatively weak buying sentiment.
DERIVATIVES
- Funding Rate - Short position traders are dominant and are willing to pay long traders.
Last Value:
-0.00450709
24H%:
+101%
+ Taker Buy Sell Ratio - Buying sentiment is dominent in the derivatives market. More buy orders are filled by takers.
Buy:
0.53551546
Sell:
0.46448454
/ Open Interest - As OI increases, it indicates more liquidity, volatility , and attention are coming into the derivative market. The increasing trend in OI could support the current ongoing price trend
Last Value:
8,591,474,245.29
24H%:
0%
7D%:
+1%
+ Liquidation - 19857239.24of short positions were liquidated in the last 24 hours.
Long:
3,734,557.07
Short:
19,857,239.24
MARKET SENTIMENT:
Fear & Greed Index - Aug 30, 2022:
Today: 27 (Fear)
Yesterday: 24 (Extreme Fear)
Avg. 1W: 26 😱
Avg. 2W: 29 😱
Avg. 1M: 33 😣
Avg. 2M: 29 😱
Avg. 3M: 23 😱
Avg. 6M: 24 😱
Avg. 1Y: 33 😣
🔸 #Bitcoin
Price: $20,327
24h Low: $19,617
24h High: $20,385
MC Change: $12.0B (3.2%)
Dominance: 37.7%
24h: 3.4%
7d: -6.0%
14d: -16.4%
30d: -14.8%
60d: 1.1%
200d: -54.2%
1y: -58.5%
🤖 #BTCLIVE - 27.08 🤖🤖 #BTCLIVE - 27.08 🤖
TLDR:
Short-Term (<1 Day)
60:40- Bullish:Bearish
Mid-Term (<1 Week)
60:40
Bullish:Bearish
Long-Term (1 Month
70:30 - Bullish:Bearish
TECHNICAL ANALYSIS:
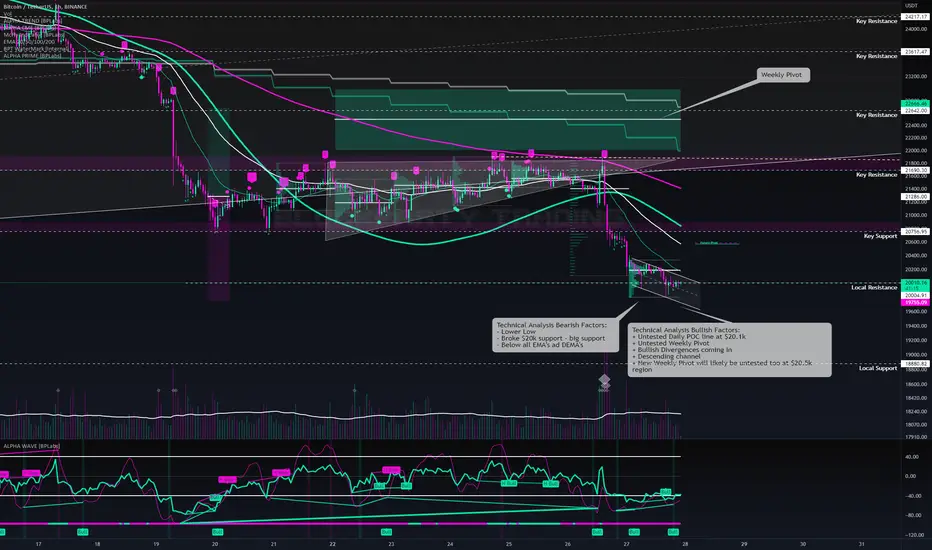
There are surprisingly a decent amount of bullish factors in play although there is a much larger bearish sentiment at play with Jerome Powells words still resonating and the additional FUD from the MT Gox Fake News turned the market bot below $20k Bitocin price and also below the critical $1T mark. In a macro sense on the 1 week chart the max pain price at the lower end of the descending wedge is looking a potential $16k which is looking a lot more realistic now that a week ago.
Currently it is a tough call with us sat right on $20k although leaning slightly towards losing it over the next 24 hours for some contuned pain for the bulls - It is looking like we will track down in this channel to around $19.6k before the next bounce or dump to a bigger bear target of $18.8k is still on the cards. Although we do see some quite unusual activity on Sunday's and a jump up out of this channel can also jump to $20.5k could be very realistic if only short lived.
Technical Analysis Bullish Factors:
+ Untested Daily POC line at $20.1k
+ Untested Weekly Pivot
+ Bullish Divergences coming in
+ Descending channel
+ New Weekly Pivot will likely be untested too at $20.5k region
Technical Analysis Bearish Factors:
- Lower Low
- Broke $20k support - big support
- Below all EMA's ad DEMA's
NEWS:
Bull:
+ Mt Gox news turned out to be fake
Bear:
- Fake Mt Gox Repayment News spread on Crypto Twitter, possible instigation of FUD
🤖 #BTCLIVE - 25.08 - #IDEA 🤖🤖 #BTCLIVE - 25.08 - #IDEA 🤖
TLDR:
Short-Term (<1 Day)
60:40- Bullish:Bearish
Mid-Term (<1 Week)
60:40
Bullish:Bearish
Long-Term (1 Month
60:40 - Bullish:Bearish
TECHNICAL ANALYSIS:
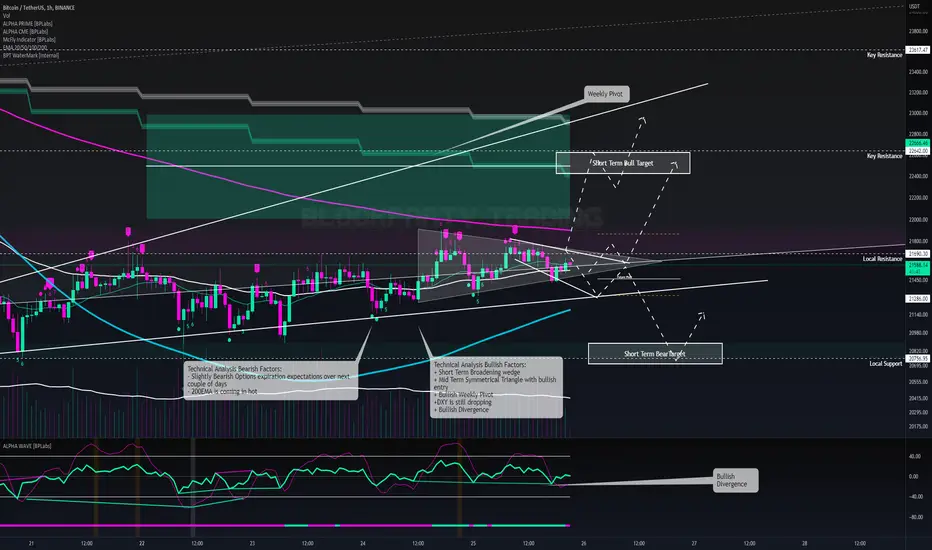
There is quite alot of factors pointing towards a bshort-term bullish move, broadening wedge on the short term and the bullish symmetrical triangle to suggest a little pump. Mainly I am looking at the bullish divergence that is in play, they have been extremely reliable in this past week. The DXY is dropping still too which is always bullish. There is additionally some nice bullish news floating around to help stop the fear. I think if we can hold $21k over the next 12-24 hours we should break up with an initial target of $22.5k
The bearish scenario here is simply losing $21k will be bad news , very quickly to support at $20.7k and given its proximity will likely not hold seeing a very likely $20k and maybe lower for the weekend.
Technical Analysis Bullish Factors:
+ Short Term Broadening wedge
+ Mid Term Symmetrical Triangle with bullish entry
+ Bullish Weekly Pivot
+DXY is still dropping
+ Bullish Divergence
Technical Analysis Bearish Factors:
- Slightly Bearish Options expiration expectations over next couple of days
- 200EMA is coming in hot
NEWS:
Bull:
+ Zero fee ETH trading - naturally bring new blood into the market
+ Russia & India no longer need the US Dollar
www.rt.com
+ Amendments to US commercial code differentiate crypto and ‘electronic money’ (cryptopanic.com)
+ Intel has struck $30B deal to build a new chip factory - part of which will be used to build #Bitcoin mining chips. 🙌
Bear:
- Options Expiry incoming - volatility definitely leaning slightly bearish
- Bitcoin price in limbo as Fed Chair prepares to address global central bankers (cryptopanic.com)
METRICS (Last 24 hours):
Bull
+ Active addresses turned positive
+ Transfer Volume turned positive
Bear
-
EXCHANGE:
+ Exchange Reserve - As the exchange reserve continues to fall, it indicates lower selling pressure.
- Exchange Netflow Total - Net deposits on exchanges are high compared to the 7-day average. Higher deposits can be interpreted as higher selling pressure.
MINERS:
/ Miners' Position Index ( MPI ) - Miners' are selling holdings in a moderate range compared to its one-year average.
Moderately selling
Last Value:
-0.81844147
24H%:
-7%
/ Puell Multiple -Miner's revenue is in a moderate range, compared to its one-year average.
Moderate revenue
Last Value:
0.52463076
24H%:
-15%
ON-CHAIN:
+ aSOPR - More investors are selling at a loss. In the middle of a bear market, it can indicate a market bottom.
Realizing loss
Last Value:
0.98362702
24H%:
0%
+ Binary CDD - Long term holders' movement in the last 7days were lower than the average. They have a motive to hold their coins
Low long-term holders' movement
Last Value:
0
24H%:
-
- Net Unrealized Profit and Loss (NUPL) -Investors are in a Capitulation phase where they are currently facing unrealized losses. It indicates the decreasing motive to realize loss which leads to a decrease in sell pressure.
Captulation
Last Value:
-0.00132546
24H%:
-422%
- Transfer Volume - The total number of coins transferred has decreased by -9.00% compared to yesterday.
+ Active Addresses - The number of active wallets used to send and receive coins has increased by -40.00% compared to yesterday.
+ Transactions - The total number of transactions has increased by -52.00% compared to yesterday.
INVESTOR SENTIMENT
- Coinbase Premium - US investors' buying pressure is relatively weak in Coinbase.
- Korea Premium -Korean retail investors' buying pressure is relatively strong.
- Fund Premium - Investors in funds and trusts including Grayscale have relatively weak buying sentiment.
DERIVATIVES
- Funding Rate - Short position traders are dominant and are willing to pay long traders.
Last Value:
-0.00064535
24H%:
-82%
+ Taker Buy Sell Ratio - Buying sentiment is dominent in the derivatives market. More buy orders are filled by takers.
Buy:
0.53838772
Sell:
0.46161228
/ Open Interest - As OI increases, it indicates more liquidity, volatility , and attention are coming into the derivative market. The increasing trend in OI could support the current ongoing price trend
Last Value:
8,461,545,292.51
24H%:
-3%
7D%:
-11%
+ Liquidation -6168430.89 of short positions were liquidated in the last 24 hours.
Long:
6,168,430.88
Short:
5,432,935.55
MARKET SENTIMENT:
#BOTPARTY
Assign your Max Active Deals based on the 7 Day Fear & Greed Average Accordingly.
F&G Filter:
0 - 20 - 100% Max Active Deals
20 - 40 - 80% Max Active Deals
40 - 60 - 60% Max Active Deals
60 - 80 - 40% Max Active Deals
80 - 100 - 20% Max Active Deals
Fear & Greed Index - Aug 25, 2022:
Today: 25 (Extreme Fear)
Yesterday: 25 (Extreme Fear)
Avg. 1W: 28 😱
Avg. 2W: 35 😣
Avg. 1M: 34 😣
Avg. 2M: 28 😱
Avg. 3M: 22 😱
Avg. 6M: 25 😱
Avg. 1Y: 34 😣
🔸 #Bitcoin
Price: $21,394
24h Low: $21,211
24h High: $21,800
MC Change: -$2.8B (-0.7%)
Dominance: 38.1%
24h: -0.7%
7d: -10.5%
14d: -7.8%
30d: -5.4%
60d: 0.6%
200d: -48.7%
1y: -56.8%
🤖 #BTCLIVE - 24.08 - #IDEA 🤖🤖 #BTCLIVE - 24.08 - #IDEA 🤖
TLDR:
Short-Term (<1 Day)
80:20- Bullish:Bearish
Mid-Term (<1 Week)
50:50
Bullish:Bearish
Long-Term (1 Month
60:40 - Bullish:Bearish
TECHNICAL ANALYSIS:
There is alot pointing towards a bullish move here, most notably the ascending triangle pattern, the perceived incoming rejection for DXY, USDT Dominance breaking down on pennant and ALT market cap showing a bull flag. All of these factors are suggesting some bullish pressure to come in. BTC is holding its local trendline support and formed a new ascending trendline support. There is still a huge macro trendline resistance to breakthrough which means this push will not likely be sustained but targets of $22k - $23k seem quite achievable. There incoming 20 DEMA and 200 EMA is not ideal. There is also finally some nice well spread out and consistent bullish news circulating with strong applications to money into market that further enhances a break up chance.
On the bear side, a break down of around $21.2k would be really bad news for bulls and the same old targets of $20.8k down to $20k are what will be looking realistic in the short term.
Otherwise coming to the end of the consolidation now so biggish move expected.
Technical Analysis Bullish Factors:
+HullMA is turning bullish
+ USDT Dominance broken down on pennant
+ Alt Market Cap in a bull flag
+ Holding local trend support
+ DXY looking like a big rejection incoming
+ Bullish Weekly Pivot
+ Ascending Triangle formed
Technical Analysis Bearish Factors:
- 200EMA Resistance incoming
- 20 DEMA Resistance incoming
- Weekly Bearish McFly
NEWS:
Bull:
+ Zero fee ETH trading - naturally bring new blood into the market
+ Sullivan Bank has partnered with Bakkt to offer #Bitcoin and #Ethereum trading for customers.
+ Valour’s Binance Coin ETP to start trading on Germany’s largest stock exchange (cryptopanic.com)
+ Mastercard CEO says they’re working with Binance to let people spend crypto at more than 90,000,000 stores… (cryptopanic.com)
+ Malaysia's largest independent Investment Bank is developing a super-app with #Bitcoin trading!
Bear:
- Kucoin security breach
METRICS (Last 24 hours):
Bull
+
Bear
- Funding Rate turned negative
EXCHANGE:
+ Exchange Reserve - As the exchange reserve continues to fall, it indicates lower selling pressure.
- Exchange Netflow Total - Net deposits on exchanges are high compared to the 7-day average. Higher deposits can be interpreted as higher selling pressure.
MINERS:
/ Miners' Position Index ( MPI ) - Miners' are selling holdings in a moderate range compared to its one-year average.
Moderately selling
Last Value:
-0.88430103
24H%:
+6%
/ Puell Multiple -Miner's revenue is in a moderate range, compared to its one-year average.
Moderate revenue
Last Value:
0.61491857
24H%:
+20%
ON-CHAIN:
+ aSOPR - More investors are selling at a loss. In the middle of a bear market, it can indicate a market bottom.
Realizing loss
Last Value:
0.98419828
24H%:
+1%
+ Binary CDD - Long term holders' movement in the last 7days were lower than the average. They have a motive to hold their coins
Low long-term holders' movement
Last Value:
0
24H%:
-
- Net Unrealized Profit and Loss (NUPL) -Investors are in a Capitulation phase where they are currently facing unrealized losses. It indicates the decreasing motive to realize loss which leads to a decrease in sell pressure.
Captulation
Last Value:
-0.00900459
24H%:
-43%
- Transfer Volume - The total number of coins transferred has decreased by -78.00% compared to yesterday.
- Active Addresses - The number of active wallets used to send and receive coins has decreased by -20.00% compared to yesterday.
- Transactions - The total number of transactions has decreased by -23.00% compared to yesterday.
INVESTOR SENTIMENT
- Coinbase Premium - US investors' buying pressure is relatively weak in Coinbase.
- Korea Premium -Korean retail investors' buying pressure is relatively strong.
- Fund Premium - Investors in funds and trusts including Grayscale have relatively weak buying sentiment.
DERIVATIVES
- Funding Rate - Short position traders are dominant and are willing to pay long traders.
Last Value:
-0.00641179
24H%:
-1,543%
+ Taker Buy Sell Ratio - Buying sentiment is dominent in the derivatives market. More buy orders are filled by takers.
Buy:
0.55464148
Sell:
0.44535852
/ Open Interest - As OI increases, it indicates more liquidity, volatility , and attention are coming into the derivative market. The increasing trend in OI could support the current ongoing price trend
Last Value:
8,572,156,239.51
24H%:
+1%
7D%:
-8%
+ Liquidation - 9109325.51 of short positions were liquidated in the last 24 hours.
Long:
8,308,068.08
Short:
9,109,325.51
MARKET SENTIMENT:
Fear & Greed Index - Aug 24, 2022:
Today: 25 (Extreme Fear)
Yesterday: 28 (Fear)
Avg. 1W: 29 😱
Avg. 2W: 36 😣
Avg. 1M: 35 😣
Avg. 2M: 27 😱
Avg. 3M: 22 😱
Avg. 6M: 25 😱
Avg. 1Y: 34 😣
🔸 #Bitcoin
Price: $21,541
24h Low: $20,955
24h High: $21,618
MC Change: $3.9B (1.0%)
Dominance: 38.1%
24h: 0.6%
7d: -10.9%
14d: -9.6%
30d: -4.3%
60d: 2.1%
200d: -41.9%
1y: -56.3%
🤖 #BTCLIVE - 23.08 - #IDEA 🤖🤖 #BTCLIVE - 23.08 - #IDEA 🤖
TL:DR:
Short-Term (<1 Day)
60:40- Bullish:Bearish
Mid-Term (>1 Day)
40:60
Bullish:Bearish
Long-Term (1 Month
60:40 - Bullish:Bearish
TECHNICAL ANALYSIS:
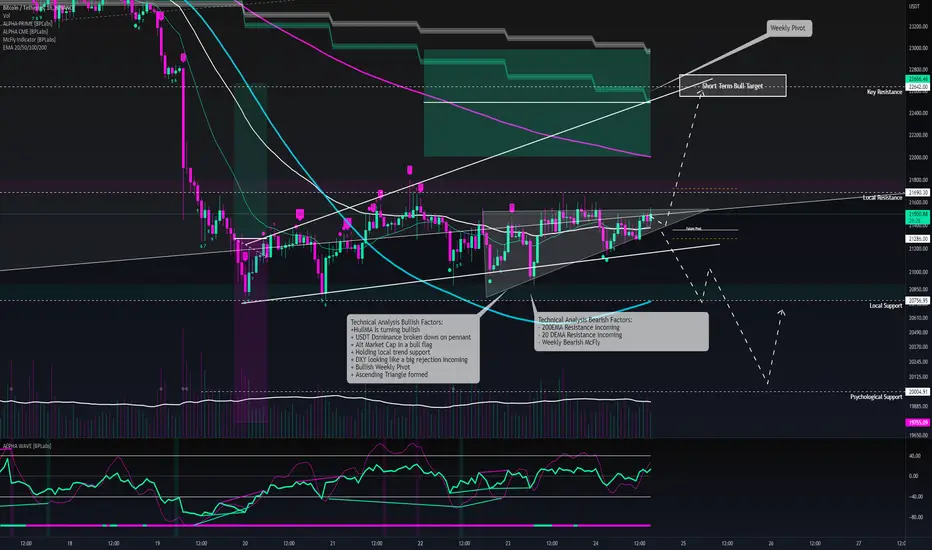
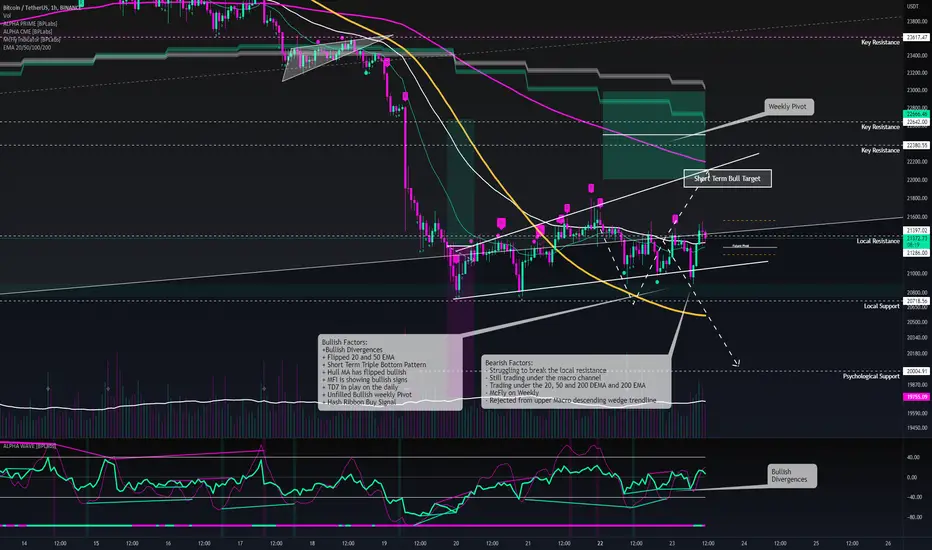
Testing the underside of the Macro channel is the key issue here as we are slowly confirming this long term bear flag - although trendlines can be quite subjective so we may also be slightly on the inside of it and holding support either way there is consolidation occurring and a biggish move will be incoming. The encouraging bullish factors are the triple bottom on the short term with divergences and also the TD7 now forming on the daily. We have a natural cross section for a target at $22k with psych. resistance, bottom of the weekly pivot likely where the 200EMA on the 1hr and the topside of the broad. wedge pattern trendline. We are seeing some pushes and volume coming in, not a huge amount but enough to break this local resistance. Notably also there are no significant sell orders on the books. I feel this will be a target and either a big rejection back to the lower of the broad. wedge at similar levels to where we are at now or a potential huge breakout. which would put a target like $23.6k in our sights.
A rejection here would be pretty brutal and could put us on the path to $20k and then ultimately $18.8k. We seem to be surprisingly light on news and especially FUD which is pretty unexpected, there is some announcements coming on Friday (PCE Price Index) that could shape the next week although it is not dependant on this just a catalyst.
Bullish Factors:
+Bullish Divergences
+ Flipped 20 and 50 EMA
+ Short Term Triple Bottom Pattern
+ Hull MA has flipped bullish
+ MFI is showing bullish signs
+ TD7 in play on the daily
+ Unfilled Bullish weekly Pivot
+ Hash Ribbon Buy Signal
Bearish Factors:
- Struggling to break the local resistance
- Still trading under the macro channel
- Trading under the 20, 50 and 200 DEMA and 200 EMA
- McFly on Weekly
- Rejected from upper Macro descending wedge trendline
NEWS:
Bull:
+ #Crypto exchange Huobi has been granted a money services business registration license in Canada.
+ EURO is at a 20 year low against the Dollar
+ Crypto.com has been granted a SOC 2 Type II certification.
Bear:
- EURO is at a 20 year low against the Dollar
- One-third of estimated 115M Indian crypto users concerned about regulations
cointelegraph.com
METRICS (Last 24 hours):
Bull
+ Taker Buy Sell Ratio turned positive
+ Liquidation turned positive
Bear
- Transfer Volume turned negative
- Active Addresses turned negative
- Transactions turned negative
EXCHANGE:
+ Exchange Reserve - As the exchange reserve continues to fall, it indicates lower selling pressure.
- Exchange Netflow Total - Net deposits on exchanges are high compared to the 7-day average. Higher deposits can be interpreted as higher selling pressure.
MINERS:
/ Miners' Position Index ( MPI ) - Miners' are selling holdings in a moderate range compared to its one-year average.
Moderately selling
Last Value:
-0.83540481
24H%:
+6%
/ Puell Multiple -Miner's revenue is in a moderate range, compared to its one-year average.
Moderate revenue
Last Value:
0.51428537
24H%:
-1%
ON-CHAIN:
+ aSOPR - More investors are selling at a loss. In the middle of a bear market, it can indicate a market bottom.
Realizing loss
Last Value:
0.9727934
24H%:
-2%
+ Binary CDD - Long term holders' movement in the last 7days were lower than the average. They have a motive to hold their coins
Low long-term holders' movement
Last Value:
0
24H%:
-
- Net Unrealized Profit and Loss (NUPL) -Investors are in a Capitulation phase where they are currently facing unrealized losses. It indicates the decreasing motive to realize loss which leads to a decrease in sell pressure.
Capitulation
Last Value:
-0.01028571
24H%:
-59%
- Transfer Volume - The total number of coins transferred has decreased by -41.00% compared to yesterday.
- Active Addresses - The number of active wallets used to send and receive coins has decreased by -18.00% compared to yesterday.
- Transactions - The total number of transactions has decreased by -9.00% compared to yesterday.
INVESTOR SENTIMENT
- Coinbase Premium - US investors' buying pressure is relatively weak in Coinbase.
- Korea Premium -Korean retail investors' buying pressure is relatively strong.
- Fund Premium - Investors in funds and trusts including Grayscale have relatively weak buying sentiment.
DERIVATIVES
+ Funding Rate - Long position traders are dominant and are willing to pay to short traders.
Last Value:
0.00137447
24H%:
-290%
+ Taker Buy Sell Ratio - Buying sentiment is dominent in the derivatives market. More buy orders are filled by takers.
Buy:
0.53247521
Sell:
0.46752479
+ Liquidation - 15933087.29 of short positions were liquidated in the last 24 hours.
Long:
10,784,253.12
Short:
15,933,087.28
/ Open Interest - As OI increases, it indicates more liquidity, volatility , and attention are coming into the derivative market. The increasing trend in OI could support the current ongoing price trend
Last Value:
8,514,395,337.34
24H%:
+1%
7D%:
-7%
MARKET SENTIMENT:
Fear & Greed Index - Aug 23, 2022:
Today: 28 (Fear)
Yesterday: 29 (Fear)
Avg. 1W: 31 😣
Avg. 2W: 37 😣
Avg. 1M: 35 😣
Avg. 2M: 27 😱
Avg. 3M: 22 😱
Avg. 6M: 25 😱
Avg. 1Y: 34 😣
🔸 #Bitcoin
Price: $21,413
24h Low: $20,961
24h High: $21,553
MC Change: -$5.2B (-1.3%)
Dominance: 38.3%
24h: -0.6%
7d: -11.9%
14d: -7.7%
30d: -5.7%
60d: 7.2%
200d: -42.1%
1y: -56.2%
🤖 #BTCLIVE - 22.08 - #IDEA 🤖🤖 #BTCLIVE - 22.08 - #IDEA 🤖
TL:DR:
Short-Term (<1 Day)
60:40- Bullish:Bearish
Mid-Term (>1 Day)
30:70
Bullish:Bearish
Long-Term (1 Month
80:20 - Bullish:Bearish
TECHNICAL ANALYSIS:
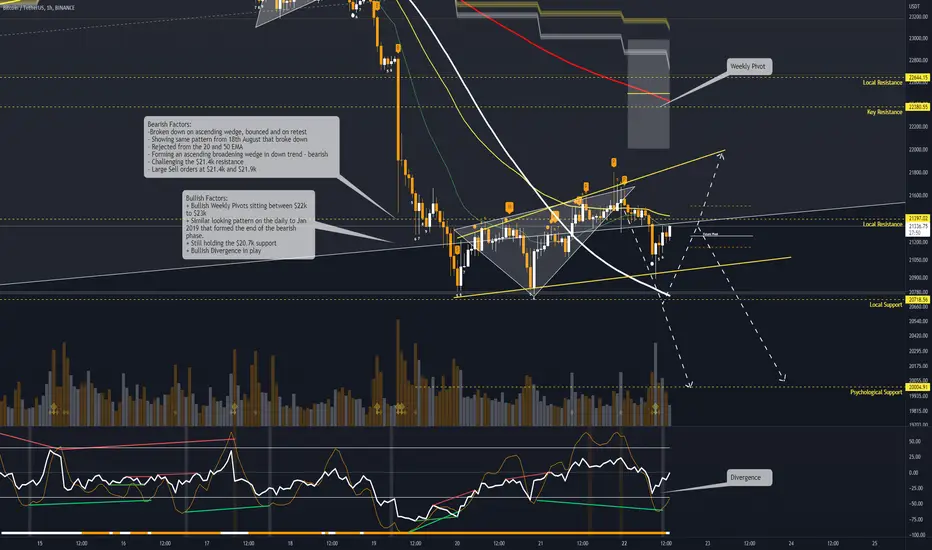
Bounce nicely off this new trendline that is forming at $20.9k after break down of the ascending wedge to start to a new ascending broadening wedge - although it is in a downtrend here, these are historically pretty bearish. We have just formed a nice bullish divergence as well. With these 2 factors TA wise is looking like a potentially rise to the top end of this new Broad.Asc.Wedge which puts us at $21.9k on the nose. This is also the bottom of the Weekly pivot and notably where alot of new Sell Orders are sitting "coincidentally". It is looking like we might see some bullish relief to these levels before the next big rejection which would likely be to $21k and possibly lower if it breaks through, to about 20.7k and then $20k.
If we lose $21k again from here then this could spell very bad news for bulls and see $20k very quickly - which deeper targets down to potentially $18.5k region.
On a macro level I feel we are reaching the last phase of this bear cycle. with a preferred path of slow down ward consolidation to approx 18.5k before a huge pump up - which would be a very similar scene to the Jan 19 bear exit. This would coincide quite nicely with the DXY coming up to key resistance and a potential big rejection.
Bullish Factors:
+ Bullish Weekly Pivots sitting between $22k to $23k
+ Similar looking pattern on the daily to Jan 2019 that formed the end of the bearish phase.
+ Still holding the $20.7k support
+ Bullish Divergence in play
Bearish Factors:
-Broken down on ascending wedge, bounced and on retest
- Showing same pattern from 18th August that broke down
- Rejected from the 20 and 50 EMA
- Forming an ascending broadening wedge in down trend - bearish
- Challenging the $21.4k resistance
- Large Sell orders at $21.4k and $21.9k
NEWS:
Bull:
+ A new UK Bill can bring crypto into the scope of local payment regulation
+ Breaking: Ethereum Merge Officially Starts, Client Releases Bellatrix And Mainnet Update
bit.ly
+ US, Ukraine, and UK lead in overall use of crypto globally, new study reveals (cryptopanic.com)
Bear:
- Bored Apes Approaching Mass Liquidation On BendDAO, Can This Crash Entire NFT Market?
- Euro falls equivalent to the US Dollar for the second time this year.
METRICS (Last 24 hours):
Bull
+ Transfer Volume turned positive
+ Funding Rate turned positive
Bear
- Coinbase Premium turned negative
- Taker Buy Sell Ratio turned negative
EXCHANGE:
+ Exchange Reserve - As the exchange reserve continues to fall, it indicates lower selling pressure.
- Exchange Netflow Total - Net deposits on exchanges are high compared to the 7-day average. Higher deposits can be interpreted as higher selling pressure.
MINERS:
/ Miners' Position Index ( MPI ) - Miners' are selling holdings in a moderate range compared to its one-year average.
Moderately selling
Last Value:
-0.7857449
24H%:
+3%
/ Puell Multiple -Miner's revenue is in a moderate range, compared to its one-year average.
Moderate revenue
Last Value:
0.51784085
24H%:
-1%
ON-CHAIN:
+ aSOPR - More investors are selling at a loss. In the middle of a bear market, it can indicate a market bottom.
Realizing loss
Last Value:
0.9940512
24H%:
+1%
+ Binary CDD - Long term holders' movement in the last 7days were lower than the average. They have a motive to hold their coins
Low long-term holders' movement
Last Value:
0
24H%:
-
- Net Unrealized Profit and Loss (NUPL) -Investors are in a Capitulation phase where they are currently facing unrealized losses. It indicates the decreasing motive to realize loss which leads to a decrease in sell pressure.
Captulation
Last Value:
-0.0212289
24H%:
+48%
+ Transfer Volume - The total number of coins transferred has increased by +178.00% compared to yesterday.
+ Active Addresses - The total number of active wallets used to send and receive coins has increased by 15.00% compared to yesterday.
+ Transactions - The total number of transactions has increased by 7.00% compared to yesterday.
INVESTOR SENTIMENT
- Coinbase Premium - US investors' buying pressure is relatively weak in Coinbase.
- Korea Premium -Korean retail investors' buying pressure is relatively strong.
- Fund Premium - Investors in funds and trusts including Grayscale have relatively weak buying sentiment.
DERIVATIVES
+ Funding Rate - Long position traders are dominant and are willing to pay to short traders.
Last Value:
0.00074996
24H%:
-109%
- Taker Buy Sell Ratio - Selling sentiment is dominent in the derivatives market. More sell orders are filled by takers.
Buy:
0.489591
Sell:
0.510409
- Liquidation - 12551393.40 of long positions were liquidated in the last 24 hours.
Long:
12,551,393.39
Short:
9,587,725.04
/ Open Interest - As OI increases, it indicates more liquidity, volatility , and attention are coming into the derivative market. The increasing trend in OI could support the current ongoing price trend
Last Value:
8,422,356,344.99
24H%:
-1%
7D%:
-8%
MARKET SENTIMENT:
Fear & Greed Index - Aug 22, 2022:
Today: 29 (Fear)
Yesterday: 27 (Fear)
Avg. 1W: 33 😣
Avg. 2W: 38 😣
Avg. 1M: 35 😣
Avg. 2M: 27 😱
Avg. 3M: 22 😱
Avg. 6M: 25 😱
Avg. 1Y: 34 😣
🔸 #Bitcoin
Price: $21,535
24h Low: $21,127
24h High: $21,665
MC Change: $8.7B (2.1%)
Dominance: 38.4%
24h: 1.8%
7d: -11.9%
14d: -6.3%
30d: -7.0%
60d: 4.0%
200d: -44.5%
1y: -56.2%
🤖 #BTCLIVE - 21.08 - #IDEA 🤖🤖 #BTCLIVE - 21.08 - #IDEA 🤖
Snapshot:
Short-Term
60:40- Bullish:Bearish
Long-Term
80:20 - Bullish:Bearish
Technical Analysis:
Bullish Scenario:
Breaking up out of this ascending wedge is key - a good confirmation for this would be breaking above $21.7k with volume or a confirmed retest. The next target puts $22.4k on the board. This would be quite a bullish sentiment overall - the key focus here is to stay within the macro channel as breaking down will cause a big drop. Ultimately we will likely see alot of consolidation and ranging around the mid channel here at a round $22.8k region.
Bearish Scenario:
Breaking down on the ascending wedge will be quite a bearish sentiment - at a about $21.2k this will be breaking down on the ascendign wedge and back out of the macro channel. Likely retest of $20.7k and breaking that will take us to $20k. I am slightly more in favour of this scenario
Bullish Factors:
+ Break back into the macro channel above $21.1k
+ Strong Double Bottom
+ Higher Highs and Lows
+ Flipped 20 and 50 EMA
+ Broken Local resistance at $21.4k
+ Very Bullish Weekly Pivot
+ Active Addresses turned positive
+ Transactions turned bullish
Bearish Factors:
- Forming Ascending Wedge Short-Term
- Bearish Daily POC forming
- RSI is nearly at overbought
- Bearish Candle
- Transfer Volume turned negative
Key News:
Bull:
+ A new UK Bill can bring crypto into the scope of local payment regulation
Bear:
- Bored Apes Approaching Mass Liquidation On BendDAO, Can This Crash Entire NFT Market?
Exchange
+ Exchange Reserve - As the exchange reserve continues to fall, it indicates lower selling pressure.
- Exchange Netflow Total - Net deposits on exchanges are high compared to the 7-day average. Higher deposits can be interpreted as higher selling pressure.
Miners
/ Miners' Position Index ( MPI ) - Miners' are selling holdings in a moderate range compared to its one-year average.
Moderately selling
Last Value:
-0.76351231
24H%:
-385%
/ Puell Multiple -Miner's revenue is in a moderate range, compared to its one-year average.
Moderate revenue
Last Value:
0.5230772
24H%:
-19%
On-Chain
+ aSOPR - More investors are selling at a loss. In the middle of a bear market, it can indicate a market bottom.
+ Binary CDD - Long term holders' movement in the last 7days were lower than the average. They have a motive to hold their coins
- Net Unrealized Profit and Loss (NUPL) -Investors are in a Capitulation phase where they are currently facing unrealized losses. It indicates the decreasing motive to realize loss which leads to a decrease in sell pressure.
- Transfer Volume - The total number of coins transferred has decreased by -73.00% compared to yesterday.
+ Active Addresses - The total number of active wallets used to send and receive coins has increased by 23.00% compared to yesterday.
+ Transactions - The total number of transactions has increased by 14.00% compared to yesterday.
Sentiment
+ Coinbase Premium - US investors' buying pressure is relatively strong in Coinbase.
- Korea Premium -Korean retail investors' buying pressure is relatively strong.
- Fund Premium - Investors in funds and trusts including Grayscale have relatively weak buying sentiment.
Derivatives
- Funding Rate - Short position traders are dominant and are willing to pay long traders.
+ Taker Buy Sell Ratio - Selling sentiment is dominant in the derivatives market. More sell orders are filled by takers.
- Liquidation - 11133298.76 of long positions were liquidated in the last 24 hours.
/ Open Interest - As OI increases, it indicates more liquidity, volatility , and attention are coming into the derivative market. The increasing trend in OI could support the current ongoing price trend
Last Value:
8,545,444,735.4
24H%:
+2%
7D%:
-9%
Fear & Greed Index - Aug 21, 2022:
Today: 27 (Fear)
Yesterday: 29 (Fear)
Avg. 1W: 36 😣
Avg. 2W: 38 😣
Avg. 1M: 35 😣
Avg. 2M: 27 😱
Avg. 3M: 22 😱
Avg. 6M: 25 😱
Avg. 1Y: 35 😣
🔸 #Bitcoin
Price: $21,169
24h Low: $20,849
24h High: $21,354
MC Change: $4.1B (1.0%)
Dominance: 38.5%
24h: 1.5%
7d: -13.3%
14d: -8.9%
30d: -9.2%
60d: 2.6%
200d: -45.1%
1y: -54.7%
@FearGreedIndex

🤖 #BTCLIVE - 20.08 - #IDEA 🤖🤖 #BTCLIVE - 20.08 - #IDEA 🤖
Snapshot:
Short-Term
30:70- Bullish:Bearish
Long-Term
80:20 - Bullish:Bearish
Technical Analysis:
Bullish Scenario:
$20.7K is key to hold if there is any chance at a bullish rally - currently the double bottom is a pretty good sign but a break above $21.4k is required dor the first confirmation and targets will be $21.8k - no predictions beyond that.
Bearish Scenario:
Losing $20.7k then it will be a drop $20k with likely bounce and potential consolidation although high chance of breakdown to $18.8k Weekend volume is erratic at best so wait for confirmation of new week to asses true trajectory.
Bullish Factors:
+ Buy Signal Printed on the Hash Ribbon Indicator
+ Printed a double bottom on the 1hr
Bearish Factors:
- Broken down on macro channel and looking like retest
- DXY still pumping
- Active Addresses turned negative
- Transactions turned negative
Key News:
Bull:
+ US FED says cryptocurrencies present opportunities to banks, customers, and the whole financial system!
+ Starlink ( Elon Musk company) and World Mobile will be working together
Bear:
-
Exchange
+ Exchange Reserve - As the exchange reserve continues to fall, it indicates lower selling pressure.
- Exchange Netflow Total - Net deposits on exchanges are high compared to the 7-day average. Higher deposits can be interpreted as higher selling pressure.
Miners
/ Miners' Position Index ( MPI ) - Miners' are selling holdings in a moderate range compared to its one-year average.
Moderately selling
Last Value:
0.26747583
24H%:
-139%
/ Puell Multiple -Miner's revenue is in a moderate range, compared to its one-year average.
Moderate revenue
Last Value:
0.6446955
24H%:
+15%
On-Chain
+ aSOPR - More investors are selling at a loss. In the middle of a bear market, it can indicate a market bottom.
+ Binary CDD - Long term holders' movement in the last 7days were lower than the average. They have a motive to hold their coins
- Net Unrealized Profit and Loss (NUPL) -Investors are in a Capitulation phase where they are currently facing unrealized losses. It indicates the decreasing motive to realize loss which leads to a decrease in sell pressure.
+ Transfer Volume - The total number of coins transferred has increased by 38.00% compared to yesterday.
- Active Addresses - The number of active wallets used to send and receive coins has decreased by -52.00% compared to yesterday.
- Transactions - The total number of transactions has decreased by -56.00% compared to yesterday.
Sentiment
+ Coinbase Premium - US investors' buying pressure is relatively strong in Coinbase.
- Korea Premium -Korean retail investors' buying pressure is relatively strong.
- Fund Premium - Investors in funds and trusts including Grayscale have relatively weak buying sentiment.
Derivatives
- Funding Rate - Short position traders are dominant and are willing to pay long traders.
+ Taker Buy Sell Ratio - Selling sentiment is dominant in the derivatives market. More sell orders are filled by takers.
- Liquidation - 21454466.85 of short positions were liquidated in the last 24 hours.
/ Open Interest - As OI increases, it indicates more liquidity, volatility , and attention are coming into the derivative market. The increasing trend in OI could support the current ongoing price trend
Last Value:
8,332,599,645.07
24H%:
0%
7D%:
-13%
Fear & Greed Index - Aug 20, 2022:
Today: 29 (Fear)
Yesterday: 33 (Fear)
Avg. 1W: 38 😣
Avg. 2W: 38 😣
Avg. 1M: 35 😣
Avg. 2M: 26 😱
Avg. 3M: 21 😱
Avg. 6M: 25 😱
Avg. 1Y: 35 😣
🔸 #Bitcoin
Price: $20,849
24h Low: $20,925
24h High: $23,246
MC Change: -$44.0B (-9.9%)
Dominance: 38.1%
24h: -10.3%
7d: -14.6%
14d: -10.2%
30d: -10.6%
60d: 1.0%
200d: -45.9%
1y: -55.4%

🤖 #BTCLIVE - 19.08 - #IDEA 🤖🤖 #BTCLIVE - 19.08 - #IDEA 🤖
Snapshot:
Short-Term
40:60- Bullish:Bearish
Long-Term
70:30 - Bullish:Bearish
Technical Analysis:
Bullish Scenario:
We are now at the macro channel bottom - which was always a realistic scenario - from here I we can hold and start to range/consolidate to build for a move up there the major resistance to break is $22.6k - ideally we need to hold above $21.1k to give a higher chance at a bullish move
Bearish Scenario:
Losing $21.1k will drop out of this macro bear flag and we will highly likely see $20k and potentially lower to $18k. There is a chance of breaking down and consolidating at $20k where alot of whales will start accumulating the $20k support is big so it might hold, be wary of shorting too much now.
Bullish Factors:
+ Trading at the bottom of macro channel now
+ approaching $20k psychological support
- Heavily oversold on 1 hour and approaching oversold on daily
Bearish Factors:
- Exchange Netflow Total turned negative
- Net Unrealized Profit and Loss (NUPL) turned to Capitulation phase
- Lost 3 key supports
- Trading under all EMAS and DEMAs
- Short trend signal printed now
- DXY is pumping hard
- Fully printed mcfly on the weekly
- Broke down on Pennant
Key News:
Bull:
+ Lol
Bear:
- JUST IN: FDIC sent a cease-and-desist letter to FTX US, alleging it misleads investors over deposit insurance.
- US lawmakers eye environmental impact of crypto mining
www.theblock.co
- CZ FUD "They want to buy cheap"
- #Crypto lender Hodlnaut lays off 80% of its staff and reveals they're under investigation by the Singapore police.
- Japan's largest online brokerage will shut its #crypto-mining operations in Russia.
Metrics:
- HUSD depegs
Exchange
+ Exchange Reserve - As the exchange reserve continues to fall, it indicates lower selling pressure.
- Exchange Netflow Total - Net deposits on exchanges are high compared to the 7-day average. Higher deposits can be interpreted as higher selling pressure.
Miners
/ Miners' Position Index ( MPI ) - Miners' are selling holdings in a moderate range compared to its one-year average.
/ Puell Multiple -Miner's revenue is in a moderate range, compared to its one-year average.
On-Chain
+ aSOPR - More investors are selling at a loss. In the middle of a bear market, it can indicate a market bottom.
+ Binary CDD - Long term holders' movement in the last 7days were lower than the average. They have a motive to hold their coins
- Net Unrealized Profit and Loss (NUPL) -Investors are in a Capitulation phase where they are currently facing unrealized losses. It indicates the decreasing motive to realize loss which leads to a decrease in sell pressure.
+ Transfer Volume - The total number of coins transferred has increased by 154.00% compared to yesterday.
+ Active Addresses - The total number of active wallets used to send and receive coins has increased by 55.00% compared to yesterday.
+ Transactions - The total number of transactions has increased by 67.00% compared to yesterday.
Sentiment
+ Coinbase Premium - US investors' buying pressure is relatively strong in Coinbase.
- Korea Premium -Korean retail investors' buying pressure is relatively strong.
- Fund Premium - Investors in funds and trusts including Grayscale have relatively weak buying sentiment.
Derivatives
- Funding Rate - Short position traders are dominant and are willing to pay long traders.
+ Taker Buy Sell Ratio - Selling sentiment is dominant in the derivatives market. More sell orders are filled by takers.
- Liquidation - 91108940.60 of short positions were liquidated in the last 24 hours.
/ Open Interest - As OI increases, it indicates more liquidity, volatility , and attention are coming into the derivative market. The increasing trend in OI could support the current ongoing price trend
Last Value:
8,495,455,849.56
24H%:
-10%
7D%:
-9%
Assign your Max Active Deals based on the 7 Day Fear & Greed Average Accordingly.
F&G Filter:
0 - 20 - 100% Max Active Deals
20 - 40 - 80% Max Active Deals
40 - 60 - 60% Max Active Deals
60 - 80 - 40% Max Active Deals
80 - 100 - 20% Max Active Deals
Fear & Greed Index - Aug 19, 2022:
Today: 33 (Fear)
Yesterday: 30 (Fear)
Avg. 1W: 41 😕
Avg. 2W: 38 😣
Avg. 1M: 35 😣
Avg. 2M: 26 😱
Avg. 3M: 21 😱
Avg. 6M: 25 😱
Avg. 1Y: 35 😣
🔸 #Bitcoin
Price: $23,247
24h Low: $23,134
24h High: $23,591
MC Change: -$2.2B (-0.5%)
Dominance: 38.5%
24h: -0.5%
7d: -2.9%
14d: 1.7%
30d: 3.8%
60d: 22.0%
200d: -39.2%
1y: -47.8%
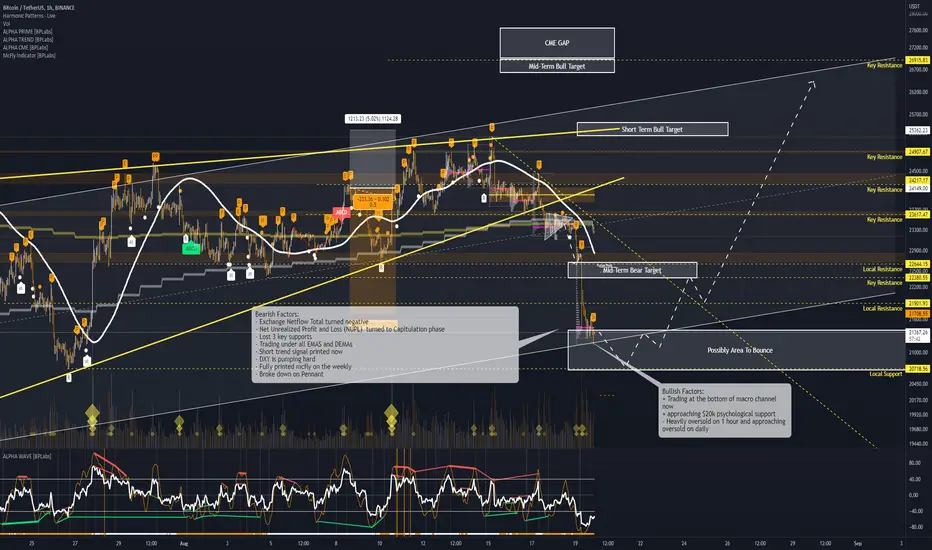
🤖 #BTCLIVE - 18.08 - #IDEA 🤖🤖 #BTCLIVE - 18.08 - #IDEA 🤖
Snapshot:
Short-Term
40:60- Bullish:Bearish
Long-Term
60:40 - Bullish:Bearish
Technical Analysis:
Bullish Scenario:
Breaking up on this bearish pennant will be helpful but more critically breaking back above $24k is where the price needs to be - If this can be achieved then a push to $25.3k at the upper range of the ascending wedge would be a target.
Bearish Scenario:
Breaking down on the bearish pennant will likely continue its move to $22.6k which is the slightly more expected scenario to occur here.
Bullish Factors:
+ Still holding 50 DEMA support
+ Daily: Bullish Divergence
+ Daily: Incoming McFly
+ Exchange Reserve turned positive
+ Exchange Netflow Total turned positive
+ Active Addresses turned positive
+ Transactions turned positive
Bearish Factors:
- Flipping the 20 DEMA
- Bearish Pennant Formed
- Incoming Mcfly Signal
- Consolidating Under Key Resistance
- Lost Key Ascending Trendline Support to confirm breakdown of longer term ascending wedge
- Weekly: Incoming McFly
- Lost Key Support
- Transfer Volume turned negative
- Funding Rate turned negative
Key News:
Bull:
+ Crypto.com Business License Approved by UK Finance Watchdog (cryptopanic.com)
+ Australian convenience store chain with +170 locations now accepts #Bitcoin
Bear:
- #Bitcoin mining difficulty has increased by 0.63% to 28.35 trillion.
- Ontario crypto exchanges impose $30K CAD annual limit on altcoin buys (cryptopanic.com)
- Markets React to FOMC Meeting Minutes (cryptopanic.com)
Metrics:
Exchange
+ Exchange Reserve - As the exchange reserve continues to fall, it indicates lower selling pressure.
+ Exchange Netflow Total - Net deposits on exchanges are low compared to the 7-day average. Lower deposits can be interpreted as lower selling pressure.
Miners
/ Miners' Position Index ( MPI ) - Miners' are selling holdings in a moderate range compared to its one-year average.
/ Puell Multiple -Miner's revenue is in a moderate range, compared to its one-year average.
On-Chain
+ aSOPR - More investors are selling at a loss. In the middle of a bear market, it can indicate a market bottom.
+ Binary CDD - Long term holders' movement in the last 7days were lower than the average. They have a motive to hold their coins
+ Net Unrealized Profit and Loss (NUPL) -Investors are in a Fear phase where they are currently with unrealized profits that are slightly more than losses.
- Transfer Volume - The total number of coins transferred has decreased by -24.00% compared to yesterday.
+ Active Addresses - The total number of active wallets used to send and receive coins has increased by 83.00% compared to yesterday.
+ Transactions - The total number of transactions has increased by 51.00% compared to yesterday.
Sentiment
+ Coinbase Premium - US investors' buying pressure is relatively strong in Coinbase.
- Korea Premium -Korean retail investors' buying pressure is relatively strong.
- Fund Premium - Investors in funds and trusts including Grayscale have relatively weak buying sentiment.
Derivatives
- Funding Rate - Short position traders are dominant and are willing to pay long traders.
+ Taker Buy Sell Ratio - Selling sentiment is dominant in the derivatives market. More sell orders are filled by takers.
- Liquidation - 14032357.38 of short positions were liquidated in the last 24 hours.
/ Open Interest - As OI increases, it indicates more liquidity, volatility , and attention are coming into the derivative market. The increasing trend in OI could support the current ongoing price trend
Last Value:
9,560,712,444.14
24H%:
+3%
7D%:
-4%
Fear & Greed Index - Aug 18, 2022:
Today: 30 (Fear)
Yesterday: 41 (Fear)
Avg. 1W: 42 😕
Avg. 2W: 38 😣
Avg. 1M: 35 😣
Avg. 2M: 26 😱
Avg. 3M: 21 😱
Avg. 6M: 25 😱
Avg. 1Y: 35 😣
🔸 #Bitcoin
Price: $23,368
24h Low: $23,277
24h High: $24,439
MC Change: -$9.8B (-2.1%)
Dominance: 38.4%
24h: -2.2%
7d: 0.7%
14d: 1.4%
30d: 12.2%
60d: 14.1%
200d: -38.3%
1y: -49.2%
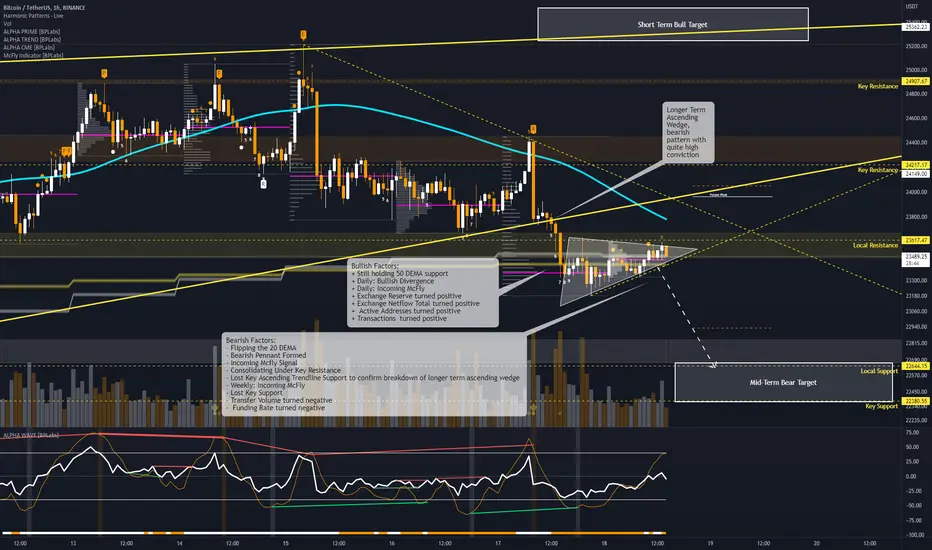
🤖 #BTCLIVE - 16.08 - #IDEA 🤖🤖 #BTCLIVE - 16.08 - #IDEA 🤖
Snapshot:
Short-Term
20:80- Bullish:Bearish
Long-Term
60:40 - Bullish:Bearish
Technical Analysis:
Bullish Scenario:
Consolidating below key resistance at $24.2k - we have to get above this and consolidate above or pump through with big volume to test $25k - this will require additional huge volume to break through given the previous heavy rejections. Breaking $25k and either consolidating above or confirmed retest then $27k and $30k will be the targets
Bearish Scenario:
More likely scenario rn, consolidating below key resistance with volume diminishing a big move is expected with the first stop being $23.5k breaking through and retesting will probably confirm $22.7k and max pain here would be likely be $20k region at the bottom of the macro channel/range. There is an ultra bearish macro descending wedge that can see a possible $16k come in if it plays out although this would require some elevated FUD to drive down that far.
Bullish Factors:
Bullish Factors:
+ Long term trend support
+ Bullish Divergence
+ Bullish CME Gap
+ 20 and 50 DEMA lying in support
Bearish Factors:
- Consolidating under key Resistance
- Under all EMA's and testing the 200EMA
- Exhaustion on the Daily
- TD6 on the Weekly
- McFly Incoming on the Weekly
- Wave Peak on the Daily
- Active Addresses - The total number of active wallets used to send and receive coins has decreased by 15 .00% compared to yesterday.
- Transactions - The total number of transactions has decreased by -12.00% compared to yesterday.
Key News:
Bull:
+ ETH Merge causing bullish sentiment market wide
+ 💥Revolut gets approval to offer #Bitcoin and crypto in the European Economic Area.
+ Fed Reveals Guidelines for Crypto Banks Who Want to Open ‘Master Accounts’ (cryptopanic.com)
Bear:
- Huobi #crypto exchange has announced that it will suspend derivatives trading in New Zealand.
- Bear Market Rally Google Searches almost at an ATH
Metrics:
Exchange
- Exchange Reserve - As the exchange reserve continues to rise, it indicates higher selling pressure.
- Exchange Netflow Total - Net deposits on exchanges are high compared to the 7-day average. Higher deposits can be interpreted as higher selling pressure.
Miners
/ Miners' Position Index ( MPI ) - Miners' are selling holdings in a moderate range compared to its one-year average.
/ Puell Multiple -Miner's revenue is in a moderate range, compared to its one-year average.
On-Chain
+ aSOPR - More investors are selling at a loss. In the middle of a bear market, it can indicate a market bottom.
+ Binary CDD - Long term holders' movement in the last 7days were lower than the average. They have a motive to hold their coins
+ Net Unrealized Profit and Loss (NUPL) -Investors are in a Fear phase where they are currently with unrealized profits that are slightly more than losses.
+ Transfer Volume - The total number of coins transferred has increased by 9.00% compared to yesterday.
- Active Addresses - The total number of active wallets used to send and receive coins has decreased by 15 .00% compared to yesterday.
- Transactions - The total number of transactions has decreased by -12.00% compared to yesterday.
Sentiment
+ Coinbase Premium - US investors' buying pressure is relatively strong in Coinbase.
- Korea Premium -Korean retail investors' buying pressure is relatively strong.
- Fund Premium - Investors in funds and trusts including Grayscale have relatively weak buying sentiment.
Derivatives
+ Funding Rate - Long position traders are dominant and are willing to pay to short traders.
+ Taker Buy Sell Ratio - Selling sentiment is dominant in the derivatives market. More sell orders are filled by takers.
/ Open Interest - As OI increases, it indicates more liquidity, volatility , and attention are coming into the derivative market. The increasing trend in OI could support the current ongoing price trend - Last Value: 9,142,523,051.97 24H%: -8% 7D%: -9%
- Liquidation - 15823977.54 of short positions were liquidated in the last 24 hours.
Fear & Greed Index - Aug 16, 2022:
Today: 44 (Fear)
Yesterday: 45 (Fear)
Avg. 1W: 42 😕
Avg. 2W: 37 😣
Avg. 1M: 34 😣
Avg. 2M: 25 😱
Avg. 3M: 20 💩
Avg. 6M: 24 😱
Avg. 1Y: 35 😣
🔸 #Bitcoin
Price: $24,176
24h Low: $23,848
24h High: $25,093
MC Change: -$2.7B (-0.6%)
Dominance: 38.4%
24h: -0.6%
7d: 4.2%
14d: 3.4%
30d: 16.3%
60d: 7.3%
200d: -34.4%
1y: -48.7%
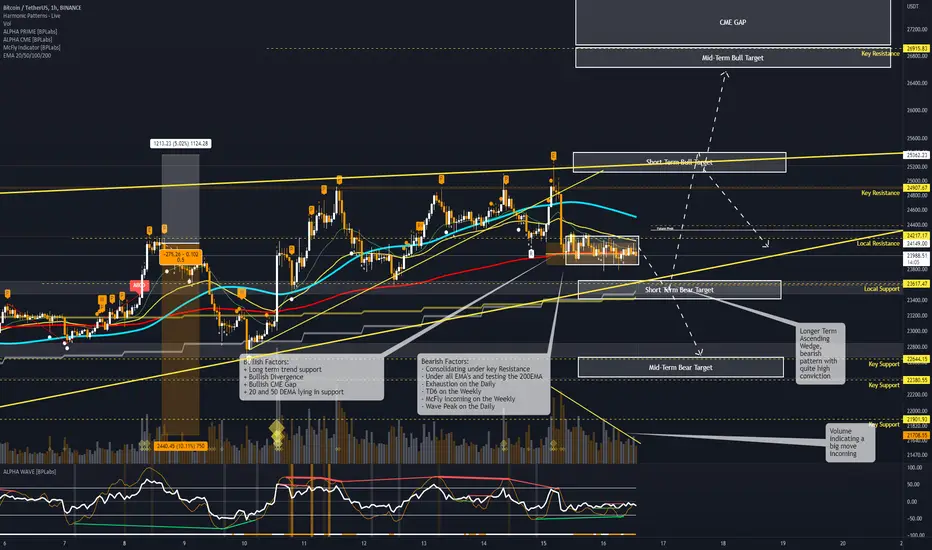
🤖 #BTCLIVE - 15.08 - #IDEA 🤖🤖 #BTCLIVE - 15.08 - #IDEA 🤖
Snapshot:
Short-Term
30:70- Bullish:Bearish
Long-Term
50:50 - Bullish:Bearish
Technical Analysis:
Bullish Scenario:
Alot of bearish sentiment, mainly short term would suggest a move down to $23.6k especially with the 3rd rejection from $25k andsell orders coming in - there could be a strong rally at this position to fend off breaking down on the ascending wedge which would likely drive price for another test of $25k this would be incredibly bullish and somewhat of a make or break push. A break and hold above $25k puts $27k and $30k as realistic targets.
Bearish Scenario:
Short term movement down to $23.6k is likely for the local support although there could be a lot of defense at this position a breakdown and confirmed retest can see price sing quite quickly to $22.6k where the next strongest zone of support lies, max pain in the move can still push us down to $20k region which is where the bottom of this long term channel/range lies.
Bullish Factors:
+ Weekly Pivot already filled
+ 200EMA is supporting
+20 & 50 DEMA doming to support at the key trendline support
+ Transfer Volume turned positive
+ Active Addresses turned positive
Bearish Factors:
- Bearish Divergence on the 5min
- Bearish divergence on the 4hr
- Bearish Divergence on the 1hr
- Restesting resistance
- Strong Sell Orders
- Broken through 20 and 50 EMA
- Hard rejection from 25k for 3rd time
- Exchange Netflow Total turned negative
- Liquidation turned negative
Key News:
Bull:
+ ETH Merge causing bullish sentiment market wide
+ 💥Revolut gets approval to offer #Bitcoin and crypto in the European Economic Area.
+ Judge grants Ripple’s request to review videos of SEC officials (cryptopanic.com)
+#Crypto exchange Gate.io has been granted a virtual asset custodial services license in Hong Kong.
+ Europe’s largest independent tyre re-treader, Vaculug, will accept #Bitcoin for payment!
Bear:
- $ETH: The “Merge” Protocol Upgrade Will Not Lower Ethereum’s Gas Fees
- Hackers printed 1.2 billion $AUSD on the Acala Network through an exploit.
- Brazilian #crypto lending platform BlueBenx halts withdrawals following a $32 million hack.
Metrics:
Exchange
- Exchange Reserve - As the exchange reserve continues to rise, it indicates higher selling pressure.
- Exchange Netflow Total - Net deposits on exchanges are high compared to the 7-day average. Higher deposits can be interpreted as higher selling pressure.
Miners
/ Miners' Position Index ( MPI ) - Miners' are selling holdings in a moderate range compared to its one-year average.
/ Puell Multiple -Miner's revenue is in a moderate range, compared to its one-year average.
On-Chain
+ aSOPR - More investors are selling at a loss. In the middle of a bear market, it can indicate a market bottom.
+ Binary CDD - Long term holders' movement in the last 7days were lower than the average. They have a motive to hold their coins
+ Net Unrealized Profit and Loss (NUPL) -Investors are in a Fear phase where they are currently with unrealized profits that are slightly more than losses.
+ Transfer Volume - The total number of coins transferred has decreased by 31.00% compared to yesterday.
+ Active Addresses - The total number of active wallets used to send and receive coins has decreased by 13 .00% compared to yesterday.
+ Transactions - The total number of transactions has increased by 26.00% compared to yesterday.
Sentiment
+ Coinbase Premium - US investors' buying pressure is relatively strong in Coinbase.
- Korea Premium -Korean retail investors' buying pressure is relatively strong.
- Fund Premium - Investors in funds and trusts including Grayscale have relatively weak buying sentiment.
Derivatives
+ Funding Rate - Long position traders are dominant and are willing to pay to short traders.
+ Taker Buy Sell Ratio - Selling sentiment is dominent in the derivatives market. More sell orders are filled by takers.
/ Open Interest - As OI increases, it indicates more liquidity, volatility , and attention are coming into the derivative market. The increasing trend in OI could support the current ongoing price trend - Last Value: 9,142,523,051.97 24H%: -8% 7D%: -9%
- Liquidation - 42921463.65 of short positions were liquidated in the last 24 hours.
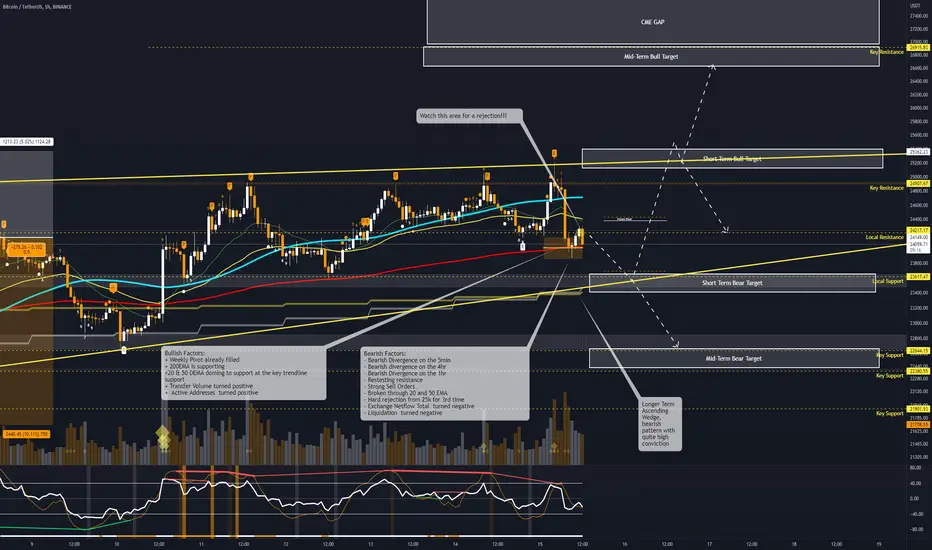
🤖 #BTCLIVE - 13.08 - #IDEA 🤖🤖 #BTCLIVE - 13.08 - #IDEA 🤖
Snapshot:
Short-Term
40:60- Bullish:Bearish
Long-Term
60:40 - Bullish:Bearish
Technical Analysis:
Bullish Scenario:
Defending against this double top and holding above ideally $24k.1 but mainly $23.6k to not confirm this double top would be the most bullish play we can hope for - this would likely require alot of volume to come in and would create quite a high bullish conviction given alot of the bearish markers. Immediate targets in this case would be $25k and then $27k - although don't be too fooled by the short term bearish sentiment a break out here could be absolutely massive with a realistic $30k on the cards.
Bearish Scenario:
A slightly more favourable outcome atm, given that we are filling out a double top pattern quite nicely along with a confirmed bearish divergence perfectly on the 2nd top. immediate target if we break down on $24k will be the key support at $23.6k, then $23.1k and then $22.6k - this could quite easily continue down.
Bullish Factors:
+ 20, 50 DEMA in close proximity for support
+ Holding key support and $24k support holding
+ On 50 EMA and HMA and support
+ Bullish CME Gap closing in
+ Exchange Reserve turned positive
+ Transfer Volume turned positive
+ Active Addresses turned positive
+ Relatively minimal FUD
Bearish Factors:
- Poor weekend volume
- Double Top pattern in play
- Bearish Divergence confirmed
- Strong upper resistance
- $25k resistance
- RSi Pullback Signal
- Bearish POC & Future Weekly Pivot forming
- aSOPR turned negative
- Taker Buy Sell Ratio turned negative
Key News:
Bull:
+ ETH Merge causing bullish sentiment market wide
+ "We are fully ready to regulate cryptocurrencies, says CFTC Chairman" t.co
+ 💥NEW: Union Bank of the Philippines to enable users buy #Bitcoin and crypto from its app!
Bear:
- SEC going after hedge funds for crypto
- France inflation reaches 6.1%, the highest it’s seen in 37 years.
- Spain inflation reaches 10.8%, the highest it’s seen in 38 years.
Metrics:
Exchange
+ Exchange Reserve - As the exchange reserve continues to fall, it indicates lower selling pressure.
+ Exchange Netflow Total - Net deposits on exchanges are low compared to the 7-day average. Lower deposits can be interpreted as lower selling pressure.
Miners
/ Miners' Position Index ( MPI ) - Miners' are selling holdings in a moderate range compared to its one-year average.
/ Puell Multiple -Miner's revenue is in a moderate range, compared to its one-year average.
On-Chain
- aSOPR - More investors are selling at a profit. In the middle of a bull market, it can indicate a market top.
+ Binary CDD - Long term holders' movement in the last 7days were lower than the average. They have a motive to hold their coins
+ Net Unrealized Profit and Loss (NUPL) -Investors are in a Fear phase where they are currently with unrealized profits that are slightly more than losses.
+ Transfer Volume - The total number of coins transferred has increased by 14.00% compared to yesterday.
+ Active Addresses - The total number of active wallets used to send and receive coins has increased by 22.00% compared to yesterday.
+ Transactions - The total number of transactions has increased by 4.00% compared to yesterday.
Sentiment
+ Coinbase Premium - US investors' buying pressure is relatively strong in Coinbase.
- Korea Premium -Korean retail investors' buying pressure is relatively strong.
- Fund Premium - Investors in funds and trusts including Grayscale have relatively weak buying sentiment.
Derivatives
+ Funding Rate - Long position traders are dominant and are willing to pay to short traders.
- Taker Buy Sell Ratio - Selling sentiment is dominent in the derivatives market. More sell orders are filled by takers.
/ Open Interest - As OI increases, it indicates more liquidity, volatility , and attention are coming into the derivative market. The increasing trend in OI could support the current ongoing price trend.
+ Liquidation - 65354916.17 of short positions were liquidated in the last 24 hours.