🤖 #BTCLIVE - 10.08 - #IDEA 🤖🤖 #BTCLIVE - 10.08 - #IDEA 🤖
Snapshot:
Short-Term
40:60- Bullish:Bearish
Long-Term
70:30 - Bullish:Bearish
Technical Analysis:
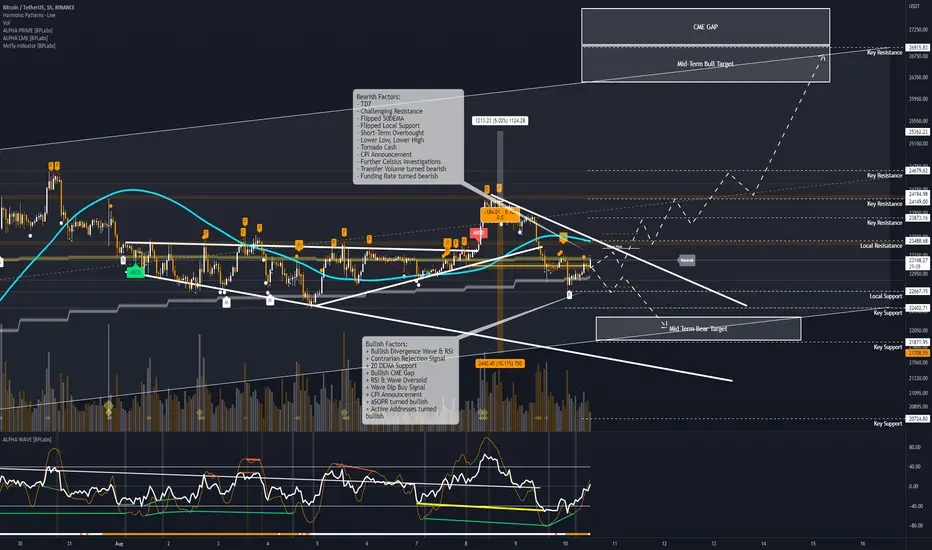
The bullish scenario is to break the local resistance at 23.5k with volume with a short term target of 23.4k and longer term target of $27k where the CME gap and top of the range is sat, breaking through will invalidate the bear flag pattern - this will be heavily predicated on the CPI announcement today
The bearish scenario is to break the local support at 22.6k with volume and the path to $22k will be very likely at the bottom of the long term range. Breaking down will confirm a long term bear flag and a realistic longer term target of $17.5k
Bullish Factors:
+ Bullish Divergence Wave & RSI
+ Contrarian Rejection Signal
+ 20 DEMA Support
+ Bullish CME Gap
+ RSI & Wave Oversold
+ Wave Dip Buy Signal
+ CPI Announcement
+ aSOPR turned bullish
+ Active Addresses turned bullish
Bearish Factors:
- TD7
- Challenging Resistance
- Flipped 50DEMA
- Flipped Local Support
- Short-Term Overbought
- Lower Low, Lower High
- Tornado Cash
- CPI Announcement
- Further Celsius Investigations
- Transfer Volume turned bearish
- Funding Rate turned bearish
Key News:
+ $100K #Bitcoin could be a matter of time, says Bloomberg Intelligence
- #Binance will disable off-chain transfers to WazirX on August 11th.
- U.S Treasury has blacklisted 'crypto mixer' Tornado Cash.
home.treasury.gov
- Singapore-Based Hodlnaut Halts Withdrawals Citing ‘Market Conditions’
beincrypto.com
/ CPI Announcement
Approximate Gauge:
CPI YoY:
<8.7 Bullish
8.7-9.1 Neutral probably slightly bearish
9.1> Bearish
Core CPI YoY
<5.9 Bullish
5.9-6.1 Neutral
6.1> Bearish
Metrics:
Exchange
+ Exchange Reserve - As the exchange reserve continues to fall, it indicates lower selling pressure.
- Exchange Netflow Total - Net deposits on exchanges are high compared to the 7-day average. Higher deposits can be interpreted as higher selling pressure.
Miners
/ Miners' Position Index ( MPI ) - Miners' are selling holdings in a moderate range compared to its one-year average.
/ Puell Multiple -Miner's revenue is in a moderate range, compared to its one-year average.
On-Chain
+ aSOPR - More investors are selling at a loss. In the middle of a bear market, it can indicate a market bottom.
+ Binary CDD - Long term holders' movement in the last 7days were lower than the average. They have a motive to hold their coins
+ Net Unrealized Profit and Loss (NUPL) -Investors are in a Fear phase where they are currently with unrealized profits that are slightly more than losses.
- Transfer Volume - The total number of coins transferred has decreased by -24.00% compared to yesterday.
+ Active Addresses - The total number of active wallets used to send and receive coins has increased by 22.00% compared to yesterday.
+ Transactions - The total number of transactions has increased by 8.00% compared to yesterday.
Sentiment
+ Coinbase Premium - US investors' buying pressure is relatively strong in Coinbase.
- Korea Premium -Korean retail investors' buying pressure is relatively strong.
- Fund Premium - Investors in funds and trusts including Grayscale have relatively weak buying sentiment.
Derivatives
- Funding Rate - Short position traders are dominant and are willing to pay long traders.
- Taker Buy Sell Ratio - Selling sentiment is dominant in the derivatives market. More sell orders are filled by takers.
/ Open Interest - As OI increases, it indicates more liquidity, volatility , and attention are coming into the derivative market. The increasing trend in OI could support the current ongoing price trend.
- Liquidation - 33137829.14 of long positions were liquidated in the last 24 hours.
Onchain
🤖 #BTCLIVE - 09.08 - #IDEA 🤖🤖 #BTCLIVE - 09.08 - #IDEA 🤖
60:40 Mid-Term
Bullish:Bearish
Technical Analysis:
Current Status:
Big rejection hit as outlined in yesterdays BTCLIVE with TD9's, Exhaustion candle and bearish divergence into resistance - multiplied by the Tornado Cash blacklisting. We have taken out the high support of $23.8k and looking to test the more critical support of $23.2k. There is a large amount of support in this area:
- 50EMA
- 20 EMA
- Weekly Pivot
- CME Gap
- Trendline
- Potential Bullish Divergence
That should hopefully, the key analysis is the bullish divergence that is not confirmed yet but could help support a retest and bounce here. A long with a pretty tight stop-loss here could be an option, although keep the stop-loss tight - very high risk. The only issue is that there is a considerably amount of unpredictable new circulating atm, especially the Tornado Cash blacklisting as this could be a floodgate to other services and the depth may be quite damaging as it is unlikely this will be isolated to just Tornado Cash. The rest of the news is not particularly impactful so just keep an eye on how this unfolds - it will be interesting to see what the US does when on line. On the whole I am still more bullish than bearish
Bullish Scenario
Bounce here at $23.2k and track up to longterm range target of $25k - $26k. A lot of TA suggesting a possible bounce along with a lot of volume if the US market doesnt drop the price below $23k the it would all be relatively bullish.
Bearish Scenario
If the Tornado Cash impact unfolds to affect more services then unloading of BTC reserves could start occurring - I believe this was the cause of the recent dump - a daily close below $23.2k would likely lead to further downward pressure with a realistic target of $22k.
Key News:
+ Iran completes its first foreign trade worth $10 million using #cryptocurrency.
- @circlepay 's USDC has officially blacklisted every Ethereum address sanctioned by the US Treasury
+ $100K #Bitcoin could be a matter of time, says Bloomberg Intelligence
+ UAE-based retail store Day To Day will accept #Bitcoin and other cryptocurrencies as payment methods.
- #Binance will disable off-chain transfers to WazirX on August 11th.
- U.S Treasury has blacklisted 'crypto mixer' Tornado Cash.
home.treasury.gov
- Singapore-Based Hodlnaut Halts Withdrawals Citing ‘Market Conditions’
beincrypto.com
Metrics:
Exchange
+ Exchange Reserve - As the exchange reserve continues to fall, it indicates lower selling pressure.
- Exchange Netflow Total - Net deposits on exchanges are high compared to the 7-day average. Higher deposits can be interpreted as higher selling pressure.
Miners
/ Miners' Position Index ( MPI ) - Miners' are selling holdings in a moderate range compared to its one-year average.
/ Puell Multiple -Miner's revenue is in a moderate range, compared to its one-year average.
On-Chain
- aSOPR - More investors are selling at a profit. In the middle of a bull market, it can indicate a market top.
+ Binary CDD - Long term holders' movement in the last 7days were lower than the average. They have a motive to hold their coins
+ Net Unrealized Profit and Loss (NUPL) -Investors are in a Fear phase where they are currently with unrealized profits that are slightly more than losses.
+ Transfer Volume - The total number of coins transferred has increased by 30.00% compared to yesterday.
- Active Addresses - The number of active wallets used to send and receive coins has decreased by -4.00% compared to yesterday.
+ Transactions - The total number of transactions has increased by 2.00% compared to yesterday.
Sentiment
+ Coinbase Premium - US investors' buying pressure is relatively strong in Coinbase.
- Korea Premium -Korean retail investors' buying pressure is relatively strong.
- Fund Premium - Investors in funds and trusts including Grayscale have relatively weak buying sentiment.
Derivatives
+ Funding Rate - Long position traders are dominant and are willing to pay to short traders.
- Taker Buy Sell Ratio - Selling sentiment is dominant in the derivatives market. More sell orders are filled by takers.
/ Open Interest - As OI increases, it indicates more liquidity, volatility , and attention are coming into the derivative market. The increasing trend in OI could support the current ongoing price trend.
- Liquidation - 22775722.97 of long positions were liquidated in the last 24 hours.

🤖 #BTCLIVE - 05.08 - #IDEA 🤖🤖 #BTCLIVE - 05.08 - #IDEA 🤖
70:30 Long-Term
Bullish:Bearish
Technical Analysis:
Current Status:
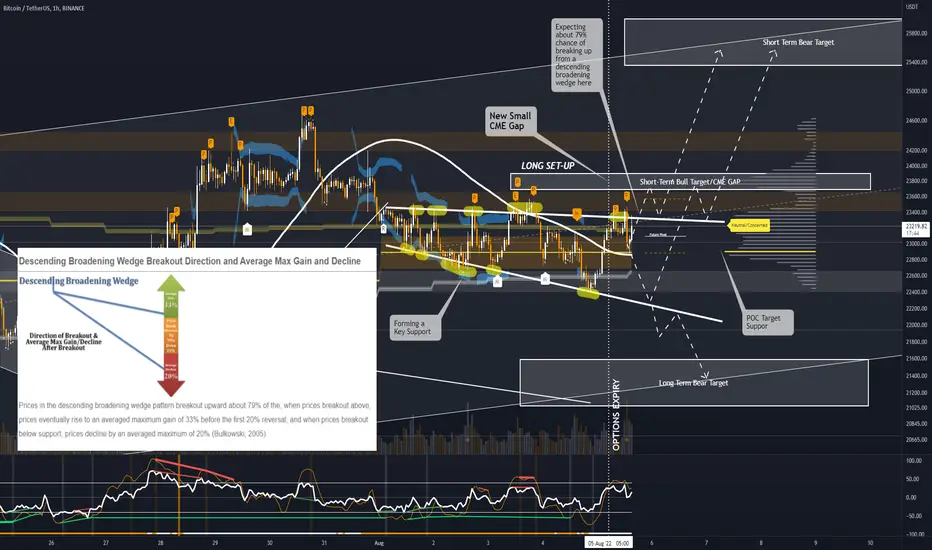
Confirmed a descending broadening wedge - since the 1st August with the latest to failed breakouts. These are particularly bullish patterns - based on historical data showing a 79% frequency of breaking up from them. In the same data set it is claiming a 33%, although suggest you ignore that. With options expiration there is expected volatility which could see the breakout happen today although based on the most recent rejection we have seen some good support come at the POC line and 20 DEMA was lying in wait just below too. If it breaks out again things are turning v.bullish although breakout is not confirmed yet.
Bullish Scenario
Breaking and retesting $23.4k will see a short term target of approx. $24k and a bigger term target of $25.5k
Bearish Scenario
A Break down and retest of $22.7k will likely start the descent to $21.5k at the lower range of the longer term - breaking down on that will spell major bloodshed.
Key News:
- Pornhub no longer uses VISA/Mastercard likely to fall back on Crypto
- Coinbase has received a class action lawsuit alleging the #crypto exchange made false claims regarding its business activities
- Options Expiration
- Elon Musk said to expect a recession
Metrics:
Exchange
+ Exchange Reserve - As the exchange reserve continues to fall, it indicates lower selling pressure.
- Exchange Netflow Total - Net deposits on exchanges are high compared to the 7-day average. Higher deposits can be interpreted as higher selling pressure.
Miners
/ Miners' Position Index (MPI) - Miners' are selling holdings in a moderate range compared to its one-year average.
+ Puell Multiple - Miner's revenue is decreasing significantly compared to the cost they put in. This could indicate that price is undervalued along with the increasing miner's motive to hold their coins.
On-Chain
+ aSOPR More investors are selling at a loss. In the middle of a bear market, it can indicate a market bottom.
+ Binary CDD - Long term holders' movement in the last 7days were lower than the average. They have a motive to hold their coins.
+ Net Unrealized Profit and Loss (NUPL) - Investors are in a Fear phase where they are currently with unrealized profits that are slightly more than losses.
+ Transfer Volume - The total number of coins transferred has increased by 315.00% compared to yesterday.
+ Active Addresses - The total number of active wallets used to send and receive coins has increased by 21.00% compared to yesterday.
+ Transactions - The total number of transactions has increased by 72.00% compared to yesterday.
Sentiment
+ Coinbase Premium - US investors' buying pressure is relatively strong in Coinbase.
- Korea Premium - Korean retail investors' buying pressure is relatively strong.
- Fund Premium - Investors in funds and trusts including Grayscale have relatively weak buying sentiment.
Derivatives
+ Funding Rate - Long position traders are dominant and are willing to pay to short traders.
- Taker Buy Sell Ratio - Selling sentiment is dominent in the derivatives market. More sell orders are filled by takers.
/ Open Interest - As OI decreases, it indicates investors are closing futures positions and possibility of trend reversals. In turn, this might trigger the possibility of long/short-squeeze caused by sudden price movement or vice versa.
+ Liquidation - 15624591.41 of short positions were liquidated in the last 24 hours.
⚡️ #BTCLIVE - 04.08 ⚡️⚡️ #BTCLIVE - 04.08 ⚡️
60:40
Bullish:Bearish
Current Status:
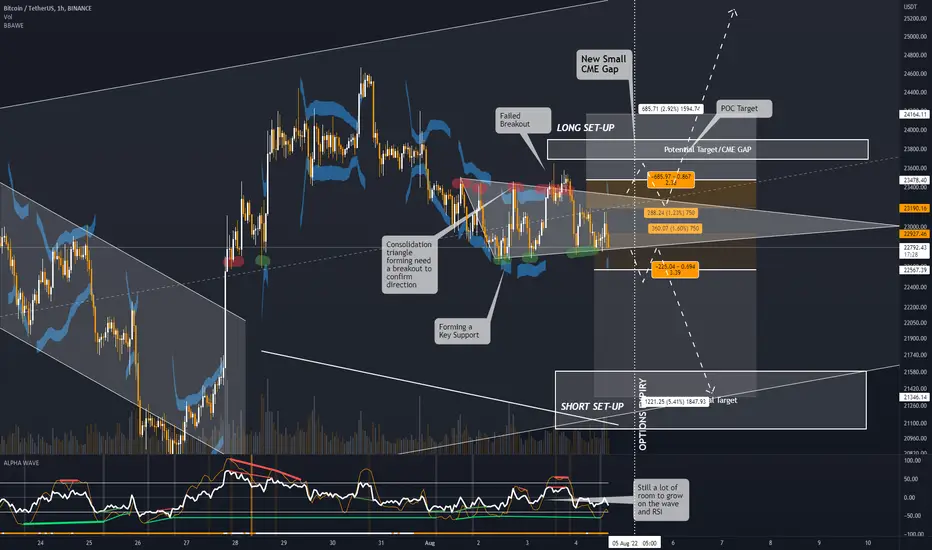
At the bottom of a symmetrical triangle - bouncing twice recently with relatively level volume showing distinct signs of ranging. Longer term Bullish Divergence is now in play. Unfilled CME Gap sitting at 23.7k to 23.9k along with the POC, both bullish. On a more macro level currently sat in the middle of a longer term range that is effectively a bear flag with a high of $25.5k and a low of $21.5k. Expecting to see a break out of this consolidation triangle over the next 24hours - direction unconfirmed.
News:
- Coinbase X BlackRock Partner for institutional investment > Bullish on BTC & ETH
- Coinbase starts Ethereum Staking > Bullish on BTC & ETH
- META introduces Coinbse Wallets to platform > Bullish on BTC
- Options Expiry Friday > Heavy Volatility
- China x Taiwan FUD/Conflict > Bearish on all markets
On-Chain
Growing supply in older age bands - This signifies that both HODLers be HODLing, AND that they are not spending their cold storage coins.
Declining supply in younger age bands - literally the equal and opposite reaction.
Generally speaking - this is what we want and are starting to see for a bear market floor
Bullish Scenario
Breaking and retesting $23.4k will see a short term target of approx. $24k and a bigger term target of $25.5k
Bearish Scenario
A Break down and retest of $22.7k will likely start the descent to $21.5k at the lower range of the longer term - breaking down on that will spell major bloodshed.
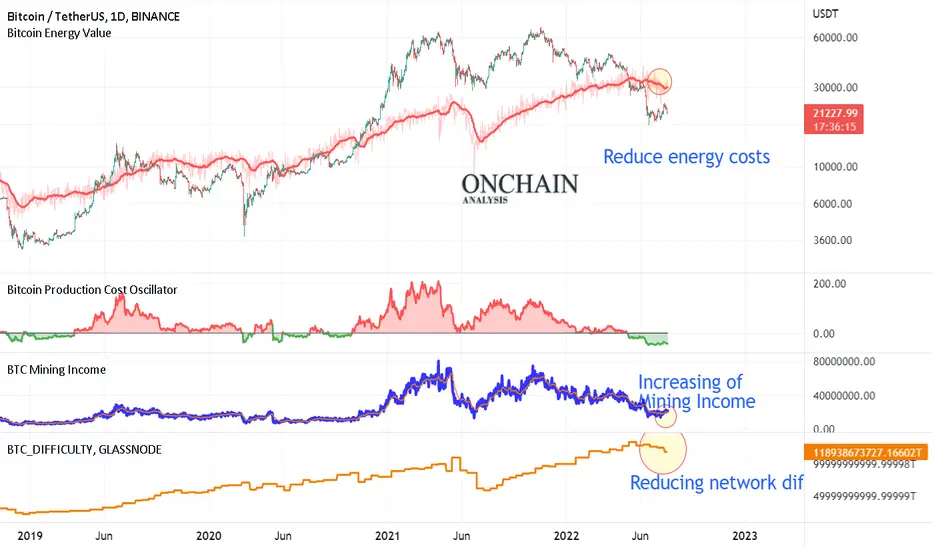
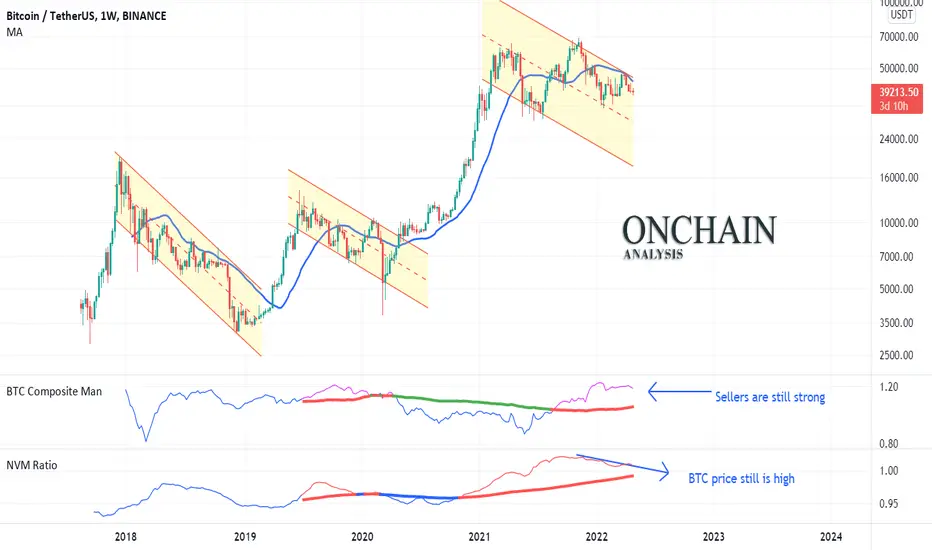
Onchain: Miners,banks and whales did not support the bull market
A look at various Onchain metrics shows that miners, banks, and whales do not support the increase in the price of Bitcoin. Banks continued to reduce their Bitcoin reserves and the miners sold their bitcoins. Bitcoin Exchange Wall Ratio has also shown the increase in the entry of Bitcoin into the exchanges by whales. On the other hand, With the reduction of network difficulty and mining cost, we saw an increase in Bitcoin sales by miners. These show the market still does not have enough support for the price increase at the moment
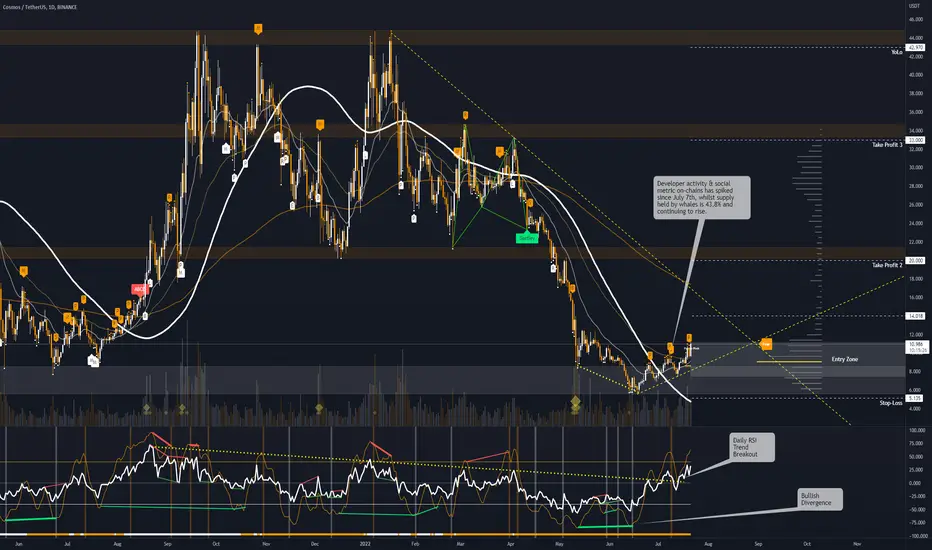
⚡️ #ATOM/USDT - Potential 450% ⚡️⚡️ #ATOM/USDT - Potential 450% ⚡️
Entry Conditions:
Developer activity & social metric on-chains has spiked since July 7th, whilst supply held by whales is 43.8% and continuing to rise.
- Bullish Divergence
- RSI Daily Trendline Breakout
Entry: - 7.4 - 11
TP1: 14
TP2: 20
TP3: 33
Yolo: 43
SL: 5.1 or HOLD
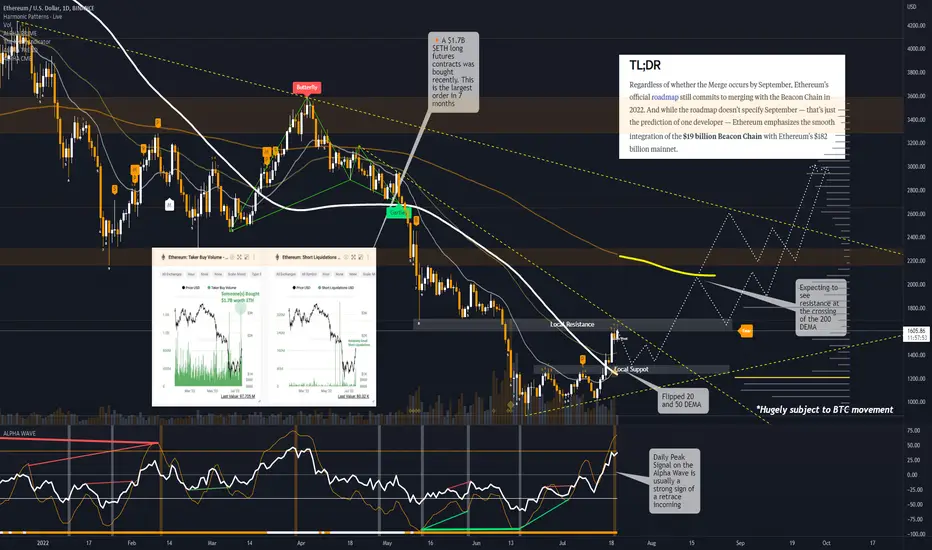
⚡️ #ETH/USD - The Merge-ereum ⚡️#PEOPLESCHOICE
#ETH
Probably the most talked about and promising assets to hold rn, it is pretty hard to go anywhere in crypto atm with out getting slapped with some Mergereum news. although it is what the market needs right now, so no complaints here- with huge consistent volume coming in them Whales are accumulating. As per some handy on-chain data the larget ETH buy in 7 months has been made at $1.7b which is a whole lotta ETH at these levels.
The big story is the Merge - whilst its not in the roadmap for Sept. it is a prediction of one of the devs there.
Projection on chart are based on the perfect scenario - ie no more global meltdowns or FUD and is ultimately subject to BTC. Expecting a retrace with TD9 forming, trendline & price resistance as well as a Bearish peak on the Alpha Wave.
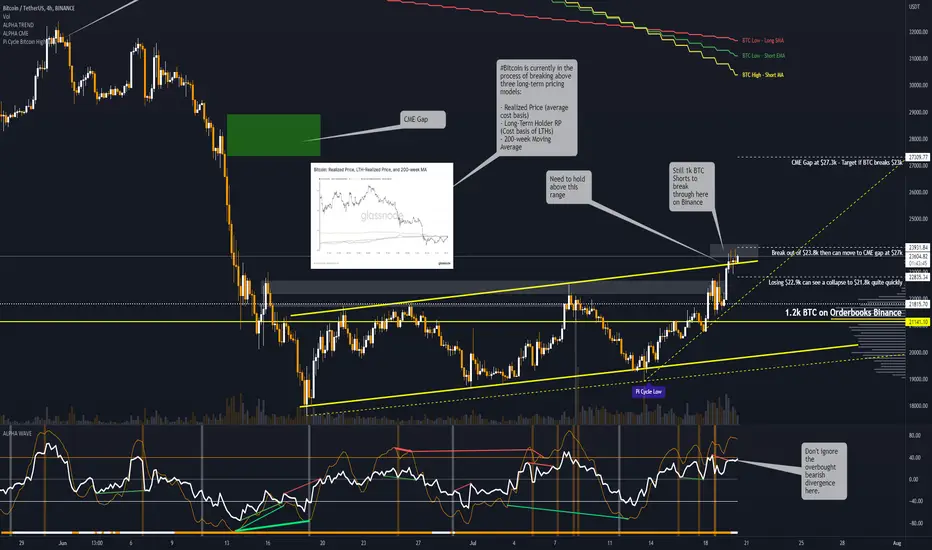
⚡️ #BTC OUTLOOK - 20/07⚡️⚡️ #BTC OUTLOOK - 20/07⚡️
We have arguably broken the range that we are in although it is definitely on the edge. At the moment there is still a sizeable amount of shorts above us (approx. 1k BTC on Binance - doesn't seem huge but relatively it is pretty big).
The worst thing that can happen is losing $22.9k then I feel it would be a bit of a collapse back in to the range heading quickly to $21.8k and then ultimately about as low as $20k.
The bullish scenario which I am slightly leaning towards is that we consolidate here for a day and eat away at the shorts before pumping through, the short/mid term target here would be $27.3k to $28.8k to basically fill the CME gap.
What to watch out for?
Any FUD, if it is going to drop then it will drop whilst we are trying to break out of this key resistance so please be wary of that.
We are at the mercy of order books that can be unreliable to be exact but do help gauge sentiment quite well usually.
Further on-chain data - is suggesting that we are coming up to a pretty important bullish turning point
Source: Glassnode
#Bitcoin is currently in the process of breaking above three long-term pricing models:
- Realized Price (average cost basis)
- Long-Term Holder RP (Cost basis of LTHs)
- 200-week Moving Average
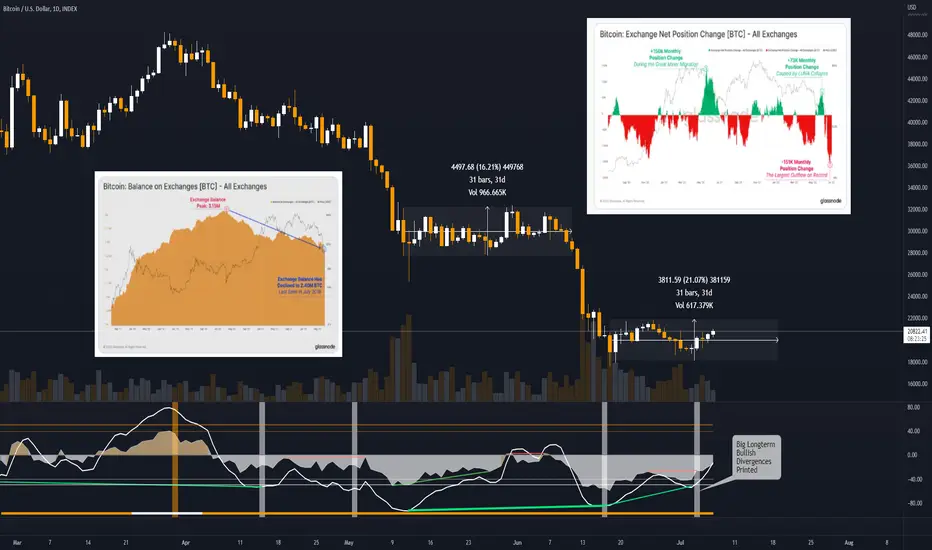
⚡️ #BTC MACRO ON-CHAIN - 07/07 ⚡️40:60
Bearish:Bullish
On-Chain looking Bullish on a Macro level - we could be ranging in this 20% period like the consolidation ranges before (excluding the initial dump wicks) for a further 10 or 11 days. Given the current outflows and huge increase in BTC to cold storage it is looking like the exit from this consolidation could be bullish.
Total exchange outflows in June peak at -151k BTC/month, with Shrimp and Whales as main receivers.
Although the lack of confidence in Exchanges/Lenders is at an all time low so take with a pinch of salt and could still mean temporary holding in cold storage.
Bitcoin Onchain Volume and Trading volumeHello guys.today i want to explain how we can find important Resistance and Support levels in BTC
according to onchain transaction volumes and trading or off chain volumes.
when we talk about onchain volume means Vol of transactions recorded in blockchain.
and when we talk about Trading Vol or offchain Vol means transactions recorded in exchanges.
Comparing on-chain and off-chain transaction volume can help us verify that data on exchange trading volume is accurate.
Off-chain volume should behave in the same way as on-chain volume.
We need this metrics in Tradingview
1)BCHAIN/TRVOU - QUANDL ----> this metric shows trading volume in Exchanges daily(Blue chart)
2)BTC_TXVOLUME - INTOTHEBLOCK ----> this metric shows BTC onchain volume daily(Purple chart)
and the price chart attached between this two metrics in my charts above.(Orange chart)
so when the trading volume and onchain volume grows together , we can see bounce or fall in price.
i show the trading volume and onchain volume Highs with colorful vertical lines
and illustrate important support and resistance levels this highs show on my chart with colorful horizontal lines.
according to this method , below we have important levels in BTC price that volume grows strong so
a lot of coins move from hand to hand.
this levels are : 19700 - 20500 - 32500 - 37200 - 43200 - 48000 - 56000 - 61500
Hope you like my opinion and if you have notices about it please share me in comments.
thank you all.

Bitcoin ready to rebound?After the pushback from the MA50Weekly and the breaking of the bearish flag, Bitcoin has screwed into a bearish trend slowed only by the 61.8% Fibonacci level, after a few days broken.
After the breakdown of the MA200Weekly there was the maximum moment of correction.
The #OnChain data indicates a massive build-up for most likely Retail users.
A rebound is more than likely (would follow SPX500 and classic markets,you can watch my analysis on SPX from a few days ago).
Next resistances among the most important in the short term, $22,300 - MA200 Weekly moving average and subsequently onchain volumes area at $23,500, then we have fibo level and onchain volumes area at 28/30 and then further resistances in the 36/40 area with the MA50Weekly.
The long-term trend remains bearish until further confirmation, but a rebound from this area is likely.

Halving time: The Next ATH in 2025 120,000based on halving time, the next bull run we'll occur on April 1, 2024.
The new ATH will happen 43- 74 weeks after Halving Time (2025). With this estimate, bitcoin will be around 110 to 135 thousand dollars on the next ATH
P.S. I used to New onchain Metric:
1- BTC New Supply: Onchain - you can find it in the below link:
2- Supply weighted moving average:
I will publish it soon

SOPR: Bitcoin still has a downtrand biasI recently published BTC-leading SOPR. You can find it at the following link:
According to this chain metric, bitcoin still has a downward bias. This metric has also never descended overlow area in this cycle. This means that the bottom has not yet occurred.

Descending triangle despite pos Onchaindespite the positive Onchain metrics such as a Decrease of bitcoin inflows to exchanges in the last 24 hours, a decrease in exchanges reserve, reduce in CDD, and Dominant long sentiment in the Funding Rate metric, Bitcoin seems to be forming a descending triangle, which is usually associated with a breakdown

Where is the bottom of the market?In this post, I want to examine the market bottom area based on technical indicators and onchain metrics.
Technical indicators:
1- RSI:
In the last two cycles, the RSI value in the market bottoms has been between 43.6 and 44.8 in the monthly timeframe.
RSI Value is 46.94 now. this is not far from the previous two values, but they were slightly less than this value.
If we find the same value (46.9) in the previous two cycles on the chart, Bitcoin has dropped in price by 18% to 30% at the bottom of the market. If we consider 18% the market bottom will be about $ 24,300.
2- Pi cycle Bottom:
The P-Cycle Oscillator is an efficient way to determine the top and bottom of the market. I used the bottom Pi cycle here. As you can see, this oscillator has performed well in previous cycles. Although the price is above the last trendline, it does not signal a market bottom. based on this oscillator, it seems that the downtrend continues.
3- 200 weeks moving average:
The 200-week moving average has always been good support for Bitcoin in previous cycles and indicates the market bottom (If we do not consider candlewick). Although Bitcoin is close to this moving average, it has not yet crossed it. The value of this moving average is currently $ 22,100.
4- 300 weeks moving average:
Although the 200-week moving average has shown good support for the bitcoin price, in the last cycle, candlewick fell to the 300-week moving average. This moving average value is currently around $ 16,600
The bottom of the market based on onchain Metrics:
1- Realized Price:
One of the most important metrics for determining the bottom price of bitcoin is the realized price. In the previous bottoms, Bitcoin has fallen below this price. Bitcoin has dropped in the historical chart to the 730-day moving average of this metric. the realized price is 23760$ now and its 730d MA is 16300$.
2-CVDD (Cumulative Value Days Destroyed) has historically picked the bottom of the market. When coins pass from an old investor to a new investor, the transaction carries a USD value and also destroys an amount of HODL time by the previous holder. CVDD is the cumulative sum of this value-time destruction as a ratio to the age of the market and divided by 6 million as a calibration factor. CVDD value is 15240$ now

Nvt ratioWe We technically examined the fall of bitcoin from 34,000 to 23,000, which you can see in the history below, and we also showed the recent declines correctly.
And we still believe that this compression is for another fall
It is interesting to see this Anchin index.
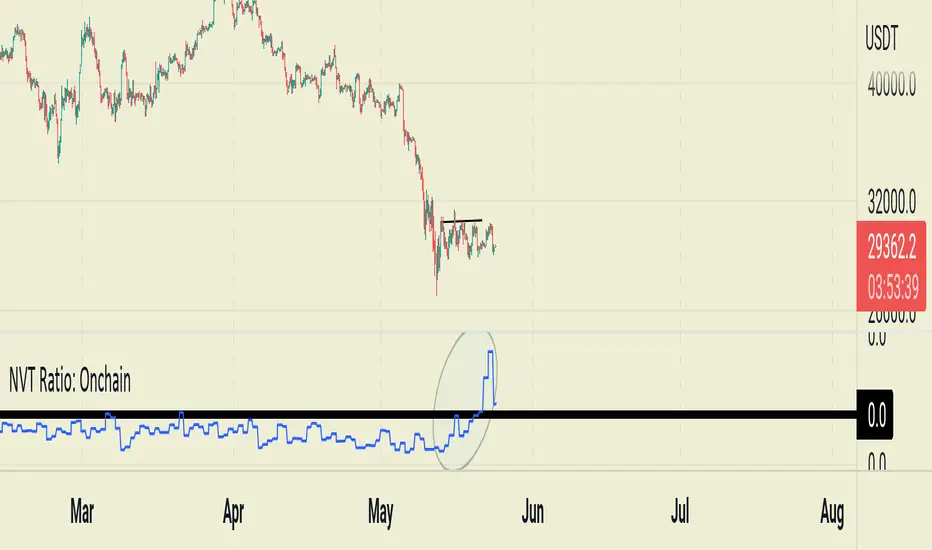
Onchain V/T Ratio: Bitcoin is still overvalued V/T ratio is a new Onchain metric that I published recently in Tradingview. To check this Onchain Metric Please check the link below:
this indicator is based on THE TOTAL VOLUME OF BITCOIN TRANSFERRED ONCHAIN IN USD and THE TOTAL AMOUNT OF TRANSACTIONS. I have explained the phases of the market based on this metric in the link above.
When it is high, it means that the ratio of trading volume to USD per transaction is high, and vice versa.
It is a good Metric to determine the Overvalue and undervalue read of BTC
Based on this metric, It seems Bitcoin is still overvalued.

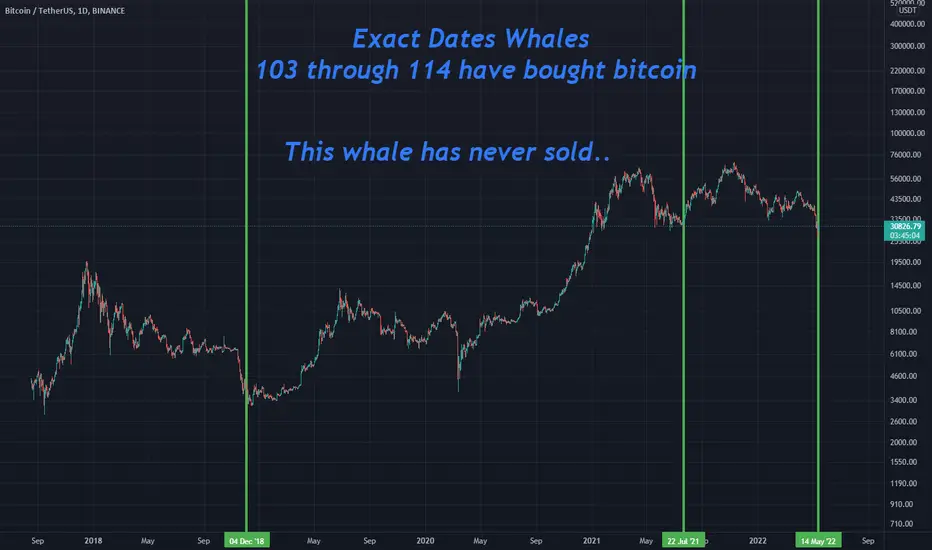
Bitcoin whales buying bottomsThis is an idea published by Benjamin Cowen on his youtube channel called "whale games". I have published it here in order to see how it progresses over time.
Essentially, whales 103 through 114 (at least that is where they stand at the current time of writing, and are likely one person seeing as all wallets have the exact same amount in them and buy at the exact same time) have been buying bitcoin at macro low points over the past 4 years. They do not DCA, they simply scoop up large amounts of bitcoin when the market is down, they purchased the 2018 bottom, the 2021 bottom and have made a third purchase yesterday at around 30k. Has this whale bought the bottom once again? Time will tell.
You can view these wallets on the bitinfocharts website.
the situation is different with July 2021The price is at the support level of July 2021, but the situation is different from that time
The situation is different from July 2021, when Bitcoin was in the same range of $ 30,000.
The US dollar index, which has a negative correlation with bitcoin, is increasing
The US stock market has lost support levels and is in a downtrend
The buyer to seller ratio is in favor of the sellers
And we have seen significant negative NetFlow in the market.
Miners have sold their bitcoins based on the MPI index
Banks' bitcoin reserves are declining, and the slight increase in recent days is not enough to reverse the trend.
In the technical chart, Bitcoin has lost the support level of MA 2Y
These are not good signs for Bitcoin

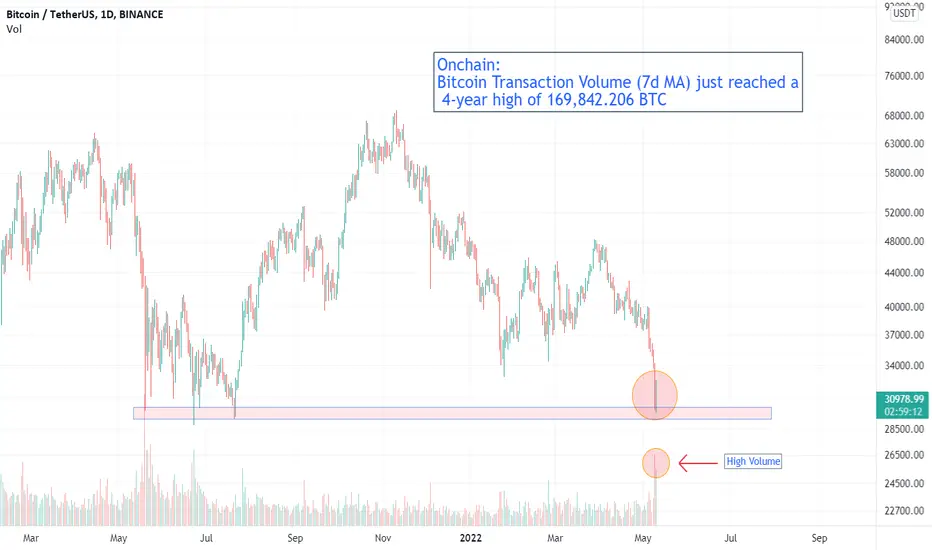
High Volume and Transaction Volume on Support levelwe can see High Volume on Support level .
On the other based on Onchain data: Bitcoin Transaction Volume (7d MA) just reached a 4-year high of 169,842.206 BTC
will these be able to stop the downtrend?
Onchain is not in good positionThe summary of onchain indicators:
Miners position index (MPI): + 129% 24h%
Binary CDD: +257% 24h%
Active Sending Addresses: + 24% 24H%
Bank reserve: -60% 24h%
Exchanges netflow: +228% 24h%
these onchain indicators show the sales pressure in the market

Bitcoin Wallet Sizes: > 1,000 BTC has increased by 8%The number of wallets with more than 1,000 bitcoins has grown by about 8% since February this year, but that will not be enough to reverse the bitcoin trend. We are witnessing a decline in the reserves of banks and miners. This is a sign of their bitcoin sales in recent months, and despite the relative decline in exchange reserves, it is still very high. More accumulation seems to be needed to start the uptrend cycle.
An impulse wave in the big correction Celer can form an ABC pattern wich we are at the end of b so we can Experience an uptrend
ALSO onchain data shows that this area is a good support zone
