NVM Ratio: Bitcoin is is overvalued"Please note that this post is not a recommendation to trade, it is just a review of an ONCHAIN index. "
One way to check the intrinsic value of bitcoin is the NVM Ratio, And it can be compared to the P/E index in the stock market This index is based on Metcalfe’s Law.
Metcalfe’s law states the effect of a telecommunications network is proportional to the square of the number of connected users of the system. In another world: the value of the network is proportional to the square of the number of active users.
Network Value to Metcalfe Ratio (NVM Ratio) is defined as the ratio of the log of market capitalization divided by the log of the square of daily active addresses.
The chart above shows the price of Bitcoin, MarketCap, and the number of active addresses.
We have compared these 3 values in the top 2021 compared to 2018. Although the number of active addresses has remained almost constant, the market cap has risen from 378 B to 1.22 T (It has increased almost 3.3 times). In fact, despite the fact that the number of active network addresses remains constant, its price has increased 3.3 times.
NVM ratio in the recent top was 1.32 and in the top of 2017 was 0.43. NVM Ratio is now close to its ATH. This could be a sign that the network is overvalued
Onchain

Is the current price the market bottom?Is the current price the market bottom of bitcoin?
We examine the answer to this question based on 3 on-chain ratios.
The NUPL value has been lower than 0.25 and 0 in the previous market bottoms. The NUPL is 0.37 now and is in a downtrend.
Therefore bitcoin is likely to experience lower values before the start of the next uptrend.
The MVRV ratio Says "No" to this question. The MVRV value at the bottom of the market is historically less than 1. The current price (MVRV = 1.6) is probably not the market bottom
The chart shows the SOPR for Bitcoin. Historically, values less than 0.98 have determined the bottom of the market. SOPR is now "1" and has a downtrend, Which can signal further price reduction.

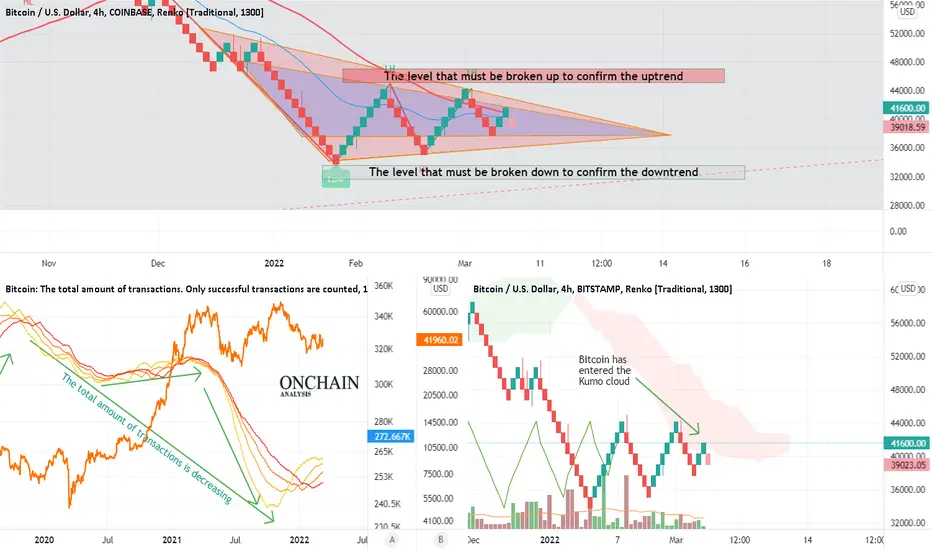
Don`t rush to trade, the market is decidingA look at the technical and on-chain analysis on bitcoin shows that the market has not yet decided for the future trend.
In the Ranko diagram, we can see a wedge that is neither ascending nor descending
In Ichimoku analysis, bitcoin has entered the Kumo cloud. This indicates that the market is making decisions and it is recommended not to trade.
OnChain analysis:
The on-Chain analysis also shows low levels of transactions
The market has had the lowest level of transactions since 2020.
The Moving average of inflow and outflow of exchange also has a downtrend and there is no significant inflow or outflow of bitcoins in exchanges.
Supply/Demand for BTC reserve for all exchanges reached a 3.5-year low.
My idea is that the market is making a decision, and until this decision is made, it is better not to make definite predictions trend. The diagram identifies the levels that must be broken out to confirm the future trend. These levels are $ 45,000 for the uptrend and $ 32,000 for the downtrend in the Renko chart.
the percent of circulating supply that has not moved 1 yearThis chart shows the percent of circulating supply that has not moved in at least 1 year. This data shows what percentage of long-term holders have kept their bitcoins.
This index has a negative correlation with price. When prices fall, holders are reluctant to sell and the index starts to rise. Once the price has risen enough, some of these holders will start selling their bitcoins, which causes supply to increase and prices to start falling.
The linear correlation in the correlation oscillator indicates the negative correlation with R = - 0.9. For a better understanding, a bitcoin chart is drawn next to it and the peak and trough points are marked.

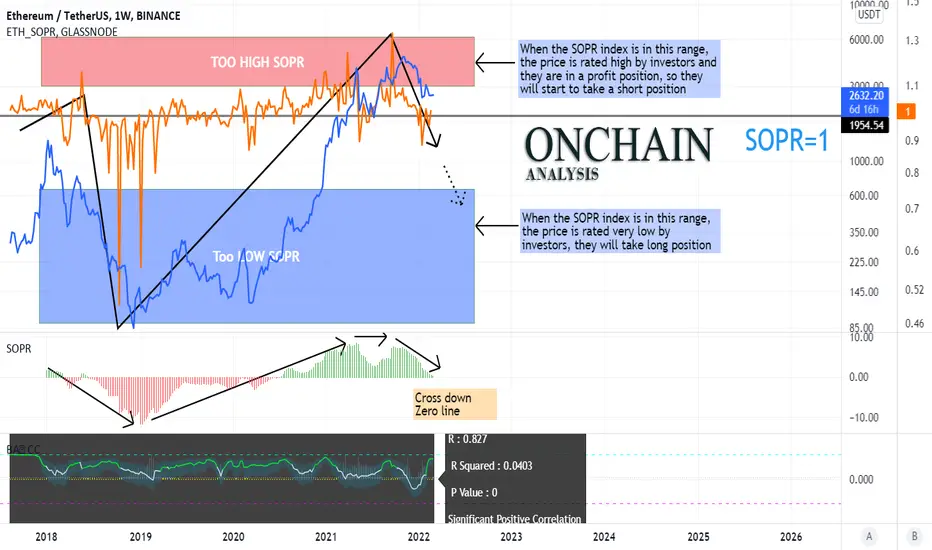
ETH ONCHAIN ANALYSIS: SOPR ANALYSISONCHAIN analysis can be equated with fundamental analysis in the world of cryptocurrency.
SOPR is an Abbreviation of The Spent Output Profit Ratio (SOPR). it is computed by dividing the realized value (in USD) divided by the value at creation (USD) of a spent output. Or simply: price sold / price paid.
In fact, this index shows whether investors are in profit or in loss? See the link below for more information on SOPR:
Here we want to present the SOPR analysis of the ETHEREUM
ETH crossed the value 1 down (in the oscillator 0). This means that ETHEREUM investors are no longer profitable.
The oscillator, on the other hand, shows a downward trend. Based on this, it is likely that we will see a continuation of the downward trend to the point that the price is considered low enough for investors to enter the market for a long position.
COINBASE:ETHUSD BITSTAMP:ETHUSD BINANCE:ETHUSDT BITFINEX:ETHUSD
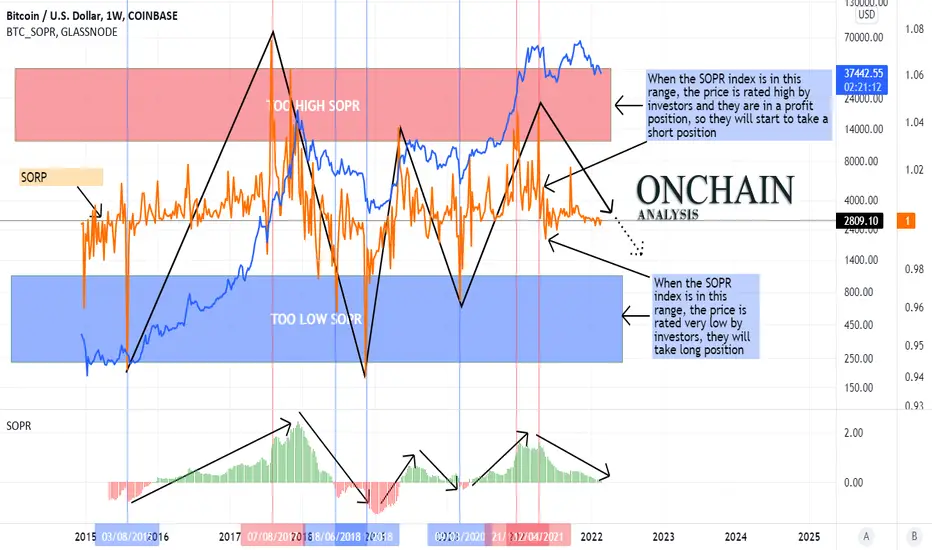
BTC ONCHAIN ANALYSIS: SOPRSOPR is an Abbreviation of The Spent Output Profit Ratio (SOPR). it is computed by dividing the realized value (in USD) divided by the value at creation (USD) of a spent output. Or simply: price sold / price paid.
In fact, this index shows whether investors are in profit or in loss? See the link below for more information on SOPR:
In this analysis, we want to examine the SOPR index for bitcoin.
As can be seen in the chart, the SOPR is on a downtrend. This shows that investors are out of profit mode and now this index shows the number 1, which indicates the lack of average profit and loss of investors.
The SOPR does not currently indicate an end to the downtrend and is likely downtrend continue in the future
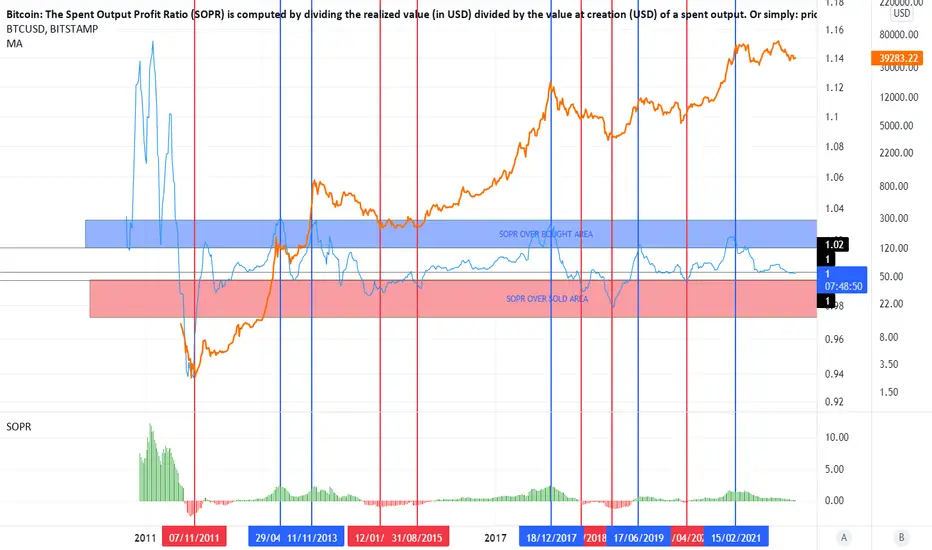
BTC ON-CHAIN ANALYSIS: SOPR
ON-CHAIN analysis can be equated with fundamental analysis in the world of cryptocurrency. From now, I will try to do some of the analysis available in Trading View.
The SOPR index is one of the available on-chain data in Trading View. SOPR is an Abbreviation of The Spent Output Profit Ratio (SOPR). it is computed by dividing the realized value (in USD) divided by the value at creation (USD) of a spent output. Or simply: price sold / price paid. In fact, this index shows whether investors are in profit or in loss?
When SOPR> 1, it means that the owners of the BTC are in profit and when SOPR< 1, they are at a loss
during a bull market values of SOPR below 1 are rejected: In a bull market, when SOPR falls below 1, people would sell at a loss, and thus be reluctant to do so. This pushes the supply down significantly, which in turn puts upward pressure on the price, which increases.
during a bear market values of SOPR above 1 are rejected: In a bear market, everyone is selling or waiting for the break-even point to sell. When SOPR is close/greater than 1, people start to sell even more, as they reach break-even. With a higher supply, the price plunges.
This indicator can be used in another way - is the price relatively cheap or relatively expensive?
Based on historical data, I have drawn OVERBOUGHT and OVERSOLD areas. At low prices, investors tend to buy, which in turn will increase prices, and at high ratios, investors will tend to sell.
BITSTAMP:BTCUSD COINBASE:BTCUSD BINANCE:BTCUSD BINANCE:BTCUSDT BYBIT:BTCUSDT
BTC SUPPLYBTC supply on exchanges is back to 2018 levels, its only a matter of time for demand to come in, and the result is evident.

3 Months of Bear Phase ; What Happened? What Will Happen Next?3 Months of Bear Phase ; What Happened? What Will Happen Next?
(On-Chain Perspective)

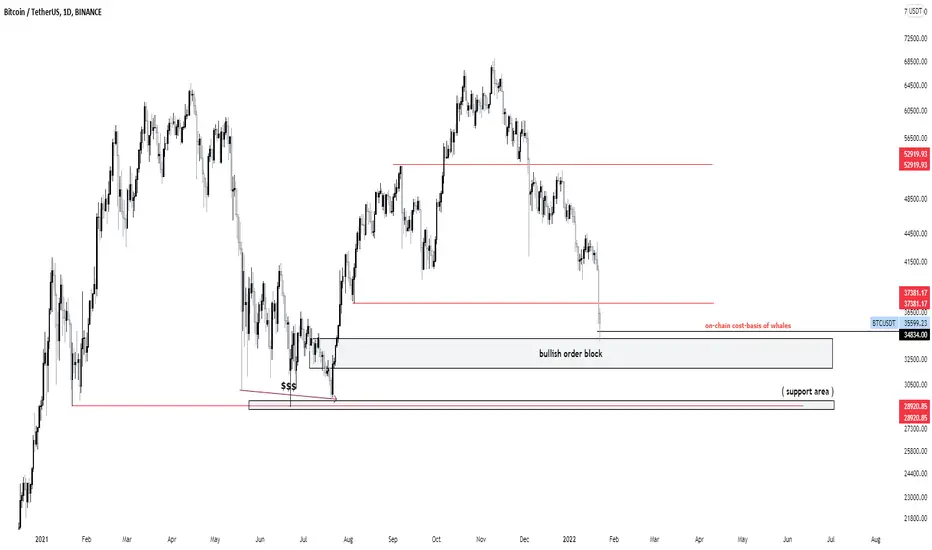
$BTC The closest supportThe closest support according to the on-chain cost-basis of whales is $34,834.
Let’s see how #Bitcoin reacts
Another gap in on-chain volume profile, however, this time accounting for the whale one and also to the downside.
Some confluence is building upon the 34k level though.
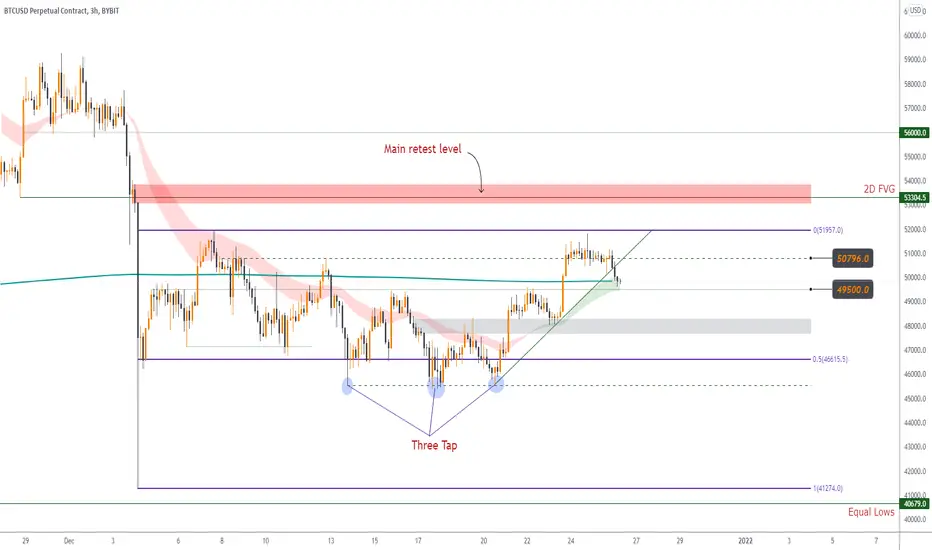
BTC/USD : Most important level to hold; Where are we heading ?BYBIT:BTCUSD BINANCE:BTCUSDT
Recently we had a bounce above $50796 and it's also broke above Daily EMA200 !
Now it's been rejected because of the hourly candle close below $50796 and it's located one Daily EMA200 and EMA 33/55 cloud.
The main idea is still can be bullish because of the support from $49500's S/R line and the EMAs below.
But any confirmation below $49500 will lead the pair into lower S/R zone and the lower support zone at $46600.
So it's very suggested to have a look on #BTC's movement in weekend and tomorrow's range because it can push the pair above $51800 ( Main resistance RN ).
How it can push the pair above $51800 ? It's simple; Because of the current gap forming in weekend !
📚 Also we can have another overview on the chart By adding the Supply/Demand zones and order-blocks :
As you can see on the chart there was a supply formed below $52000 and it just rejected the pair below the $50600's S/R level !
Now it's located above S/R line; We can say that If we get rejected again, We might retest the lower bullish order-block and the other S/R line at $48000 and continue our path to sweep the higher 2D's FVG and fill the gap above.
- Also we can track our bears into the Wick's mid or lower H12's Demand at $40550 !
So there're many scenarios being activated by losing any level to level.
📊 Then how I would play the chart ? Follow me 👇🏼
Based on On-Chain data that I gathered; The Estimated leverage Ratio has reached new high in last two years by passing above 0.2088 and now it's standing at ~0.2116 !
Which means that there're many Over-Leveraged positions that we need to be cleared.
So I would wait for any confirmation above $51800's resistance or any retest into $48000's support..
Also I'll be looking for today's EMAs to react !
But my main levels for now are :
📈 Supports :
$49500
$48200
$45500
$44250
$42000
$40550
📉 Resistances :
$50800
$51800
$53400
$56000
$57800
$59500
Hope you enjoyed the content I created, You can support us with your likes and comments !
Attention: this isn't financial advice we are just trying to help people on their own vision.
Have a good day!
@Helical_Trades
Bloody Christmas? [Bitcoin and Altcoins with unusual movement]Hi.
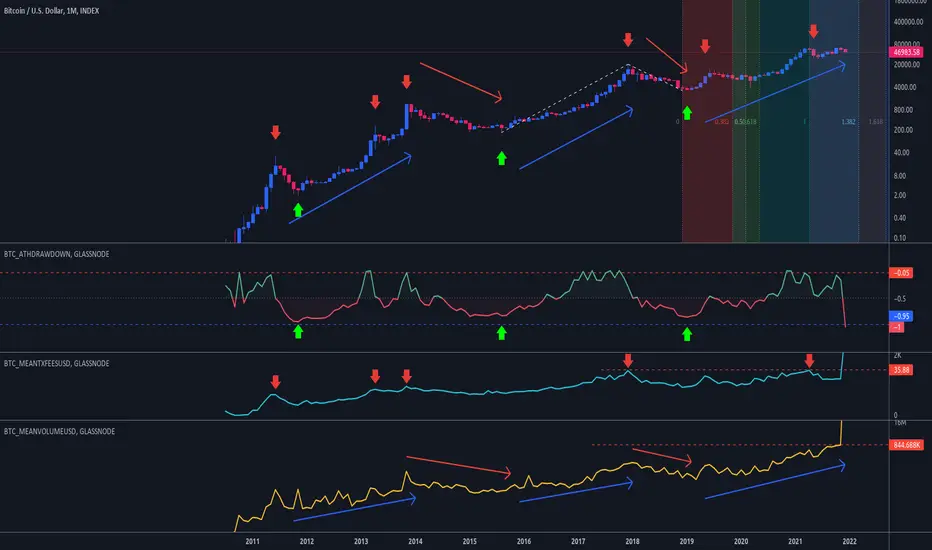
Looking at some on-chain data on several blockchains, we have an unusual movement.
Price Drawdown from ATH
The percent drawdown of the asset's price from the previous all-time high.
When the value is equal to zero, we have no drawdown.
When it is less than zero we have a drawdown multiplied by 100 (percentage).
When the indicator hits the top several times at zero value, it indicates a lot of profit taking.
And when it reaches a value less than -0.50, it indicates a lot of loss taking (a huge drawdown).
Since nothing lasts forever, either for good or for bad, this indicator serves to demonstrate the exhaustion of both sides, bulls and bears alike.
What the graphic indicates:
now a maximum drawdown of 100% has been reached since the last all-time high.
Surprisingly, this was higher than the historical value of -0.92 in November/2011.
What can we interpret from this abrupt drop? Perhaps market players agreed to divest their positions at any cost to avoid further losses.
But looking back, the deeper the better the price to buy.
Mean Transaction Fees in USD
The total amount of fees paid to miners. Issued (minted) coins are not included.
High fees mean paying to perform a transaction at any cost!
When rates peaked, the price fell shortly thereafter.
Will it happen again? I do not know.
Mean Transfer Volume in USD
The mean value of a transfer. Only successful transfers are counted.
Looking at this indicator, when we have an increase in volume, we have a price increase.
And when we have a decrease in volume, we have a drop in price.
Right now we have a trend towards increasing volume.
As with the fees indicator, we had a peak in this volume, and generally after that we have a drop in price.
Conclusion
Caution is required. The on-chain data is diverging.
The Price Drawdown indicates a great time to buy, because when it reaches the maximum drawdown, right after the price goes up.
On the other hand, unusual transfers and fees indicate a possible downward movement.
However, it should be noted that it is not because an event occurred in the past that it will necessarily be repeated in the future.
These indicators are just an auxiliary tool.
The best indicator that exists is the price itself, and it will tell us what will happen from now on.
Black Friday to buy BitcoinHi. Here's my analysis on Bitcoin\Dollar price.
// ---------------------------------------------------------------
// Graphical Analysis
// ---------------------------------------------------------------
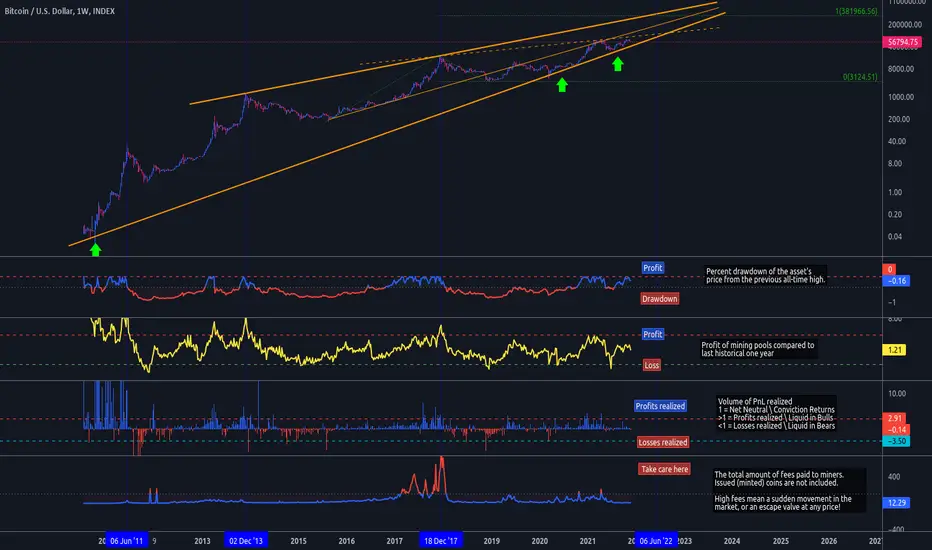
On the weekly chart we have a long diagonal support line.
Every time the price hit the line, it was a great time to buy.
The same is happening now.
Looking at the longer diagonal resistance line and the Fibonacci extension, the next top would be at $380k.
// ---------------------------------------------------------------
// On-Chain Analysis
// ---------------------------------------------------------------
***** Price Drawdown from ATH *****
The percent drawdown of the asset's price from the previous all-time high.
When the value is in red, we have a loss from the last top.
On the other hand, when the value is in blue, we have profit from the last fund.
Warning signal on, as there is profit to be taken, which could dump the price down. When this will happen is the heart of the matter.
***** The Puell Multiple *****
Puell Multiple can be interpreted as "If all mined bitcoins were sold immediately in the market, how profitable mining pools are compared to last historical one year?".
This metric helps traders gauge the market cycles from the global view.
In this indicator, there is still room for an increase in the profit of miners, however an early realization cannot be ruled out.
***** Spent Output Profit Ratio (SOPR) *****
"The Spent Output Profit Ratio (SOPR) is computed by dividing the realized value (in USD) divided by the value at creation (USD) of a spent output.
Or simply: price sold / price paid".
Where:
Spend Output = Moved Coins
Profit Ratio = Price Spent vs Price Created Compares
This track the volume of realized PnL...or magnitude of realized on-chain PnL.
1 = Neutral
>1 = Profits realized \ Liquid in Bulls
<1 = Losses realized \ Liquid in Bears
This indicator is good for signaling good buying moments, when the value is equal to or less than 1.
Now right now is a good time to buy, as shown in the histogram in red.
***** Total Transaction Fees *****
The total amount of fees paid to miners. Issued (minted) coins are not included.
High fees mean a sudden movement in the market, or an escape valve at any price!
This is another indicator to keep an eye out for.
// ---------------------------------------------------------------
// Verdict
// ---------------------------------------------------------------
The price needs to stay in the bullish channel, not breaking $50,000.
If it breaks below $50, the scenario should be reconsidered.
So that's it, I hope you enjoyed it.
If you found this analysis relevant, consider giving a Like, otherwise you can give a Dislike...
Good week!
Bitcoin on Black Friday (second part)Hello.
I'm doing another Bitcoin analysis, complementing the first one (or correcting if that's the case).
Now I'm trying to be more simplistic and objective, considering the most recent scenario, and discarding some indicators that say the same thing.
1. Graphical analysis
High Channel
The price is testing the support line.
Now might be a good time to buy.
Moving average of 9-week lows
The price has been above this average since July 9, 2021, and now it's enough to test it for the second time.
My prediction is that it touches the mean and pulls back up.
Volume
Strong volume can indicate a top or bottom.
Volume is low at the moment, which makes it clear that we have not reached the top as the market is making no effort to move the price.
So a new historic high is yet to be discovered.
Fib Time Zone
Plotting the Fib Time Zone, considering the last bottom in March/2020 and the penultimate top in April/2021, we are exactly in the 0.382 zone.
If you consider a new cycle, we have a milestone date on 10/January/2022 at 0.5, and then 0.618 on 21/February/2022.
Fibo 1 ends on 25/July/2022, but until then there's a lot to roll.
What I think is important now is the next 3 months until February.
I believe that after that we will have the crypto winter.
2. On-Chain Analysis
Price Drawdown from ATH
The percent drawdown of the asset's price from the previous all-time high.
When the value is equal to zero, we have no drawdown.
When it is less than zero we have a drawdown multiplied by 100 (percentage).
This is always considering the last historic high.
When the indicator hits the top several times at zero value, it indicates a lot of profit taking.
And when it reaches a value less than -0.50, it indicates a lot of loss taking (a huge drawdown).
Since nothing lasts forever, either for good or for bad, this indicator serves to demonstrate the exhaustion of both sides, bulls and bears alike.
If we look at the historic highs of December\2017 and March\2021, we can assume that we are looking for a new historic high and more profits.
Total Transaction Fees
The total amount of fees paid to miners. Issued (minted) coins are not included.
High fees mean paying to perform a transaction at any cost!
So far we don't have an indication that the world will end up looking around here, so for now the scenario is bullish.
Hope this helps in some way.
Greetings.

CRO with great potentialHello.
Below is an analysis of Crypto.com, an exchange that is aggressively marketing and that is snapping up the market.
F undamentalist analysis
Crypto.com has two main products: the centralized exchange and the DeFi wallet.
In the DeFi wallet, it is already possible to interact via the Ethereum network and two own blockchains: "Crypto.org Chain" and "Cronos".
"Crypto.org Chain is a blockchain application built using Cosmos SDK and Tendermint, intended as a backbone for some of the existing and future Crypto.org ecosystem".
It was released about 1 year ago.
"Chronos is the compatible EVM chain running in parallel to the Crypto.org Chain (opens new window). It aims to massively scale the DeFi Chain ecosystem, by providing developers with the ability to rapidly port apps from Ethereum and EVM-compatible chains, with funding from Particle B's $100m EVM fund (opens new window) and access to the 10M+ user base of the Crypto.com ecosystem".
It was released on 8 Nov 2021.
CRO is the native currency of these blockchains to pay gas and make transactions, just as BNB is from the Binance network.
Summary
In my view, Crypto.com has an undervalued market value compared to larger exchanges like Binance.
Also, her marketcap is smaller than worthless projects like DogeCoin and XRP.
So, with the portability coming from the Cronos blockchain to Dapps that already run on the Ethereum network, the trend is to grow even more.
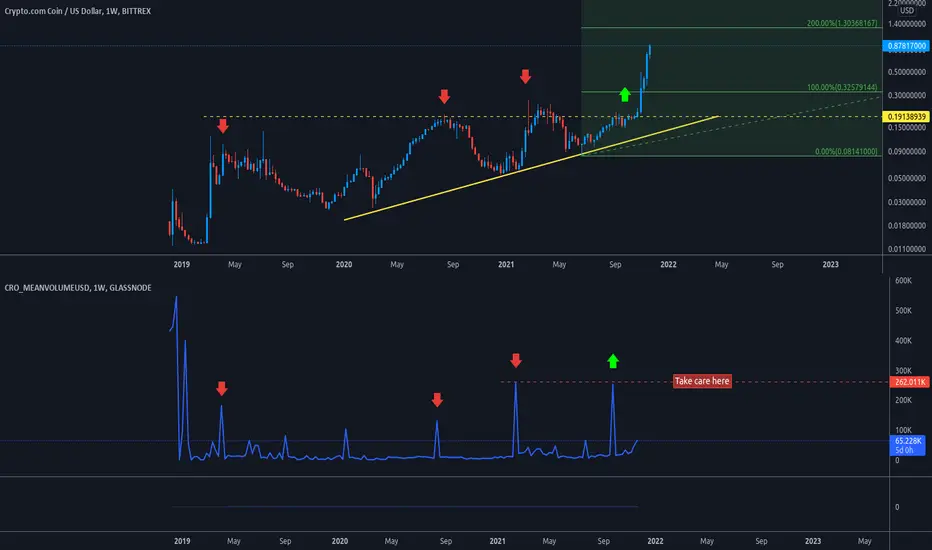
On-Chain Analysis
We consider relevant the Glassnode indicator "Average Value of a Transfer in USD".
Every time we hit a peak (red arrow), we usually hit a top. Except for the green arrow this did not happen.
Therefore, it is recommended to stay alert when this transfer spike reoccurs.
Looking at Fibonaci, the next target I believe is $1.30
Bitcoin: Mayer Multiple analysisThe orange line is 200-day moving average is represented as a line on charts and represents the average price over the past 200 days or 40 weeks.
If we look at the chart 200DMA plays its role as resistance during the bear market and during a bull market, it acts as a support line.
The Mayer Multiple simply takes the ratio between the price and 200 days.
When the price is much higher than 200 days and becoming far away from the line, it wants to go back (overvalued Mayer Multiple), conversely when it is below the 200DMA and keep falling, highly likely that trend reversal is going to happen soon, aka undervalued Mayer Multiple.
- 0.8% - undervalued, 20% below the Mayer Multiple
- 2.4 is overvalued, 2.4 times larger than the moving average.
So by multiplying 200DMA by 0.8 or 0.24 we can establish a pricing band.
If we look at the peaks in January and February we see that we jumped above that 2.4 and then we went back to the undervalued zone.
The current situation shows us that we are on the way to 100k or above once we reach 2.4 line.
It is not financial advice.
Inspired by Glassnode

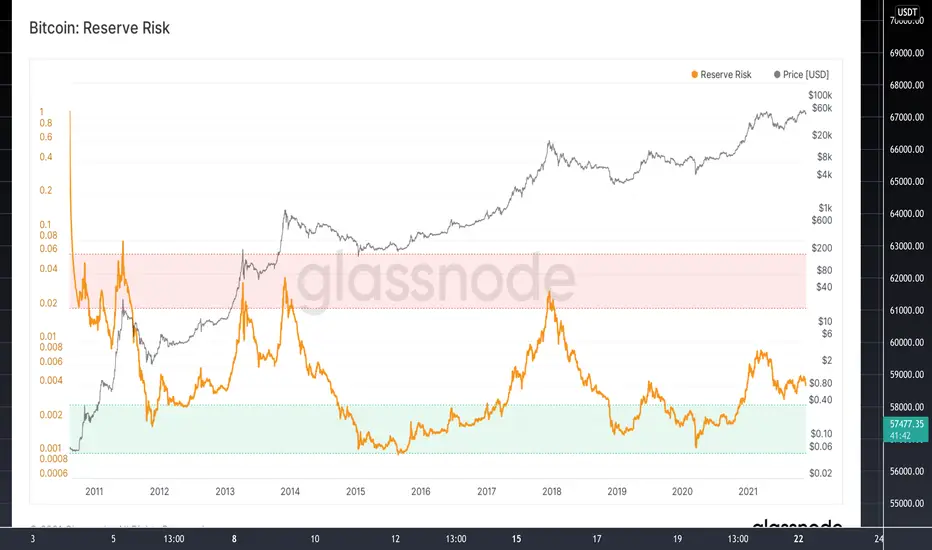
Bitcoin: Reserve RiskReserve risk shows us the risk-reward balance which correlates to the confidence and conviction of long-term holders. The ratio between the current price of the coin (intention to sell) and the reaction of long-term holders (opportunity cost of not selling).
When Reserse Risk is LOW, means that HODLer conviction is high and they refused to spend their coins, therefore it is a good time for investment. However, when the high reserve risk gives us a signal of increased incentive of sell.
By looking at the picture below, we see that every bull peak shows us the incentive to sell the coin, more people are selling into the market strengths. In plain, the periods of overvaluation are usually short when long-term holders gain some profits by spending their coins.
While bear market traders show bear behaviour and this period lasts longer where people accumulate coins, periods of undervaluation usually happen in the second half of the bear market.
As shown on the picture above, strong hands still hodl their coins and refuse to sell. Consider current short term bear period as a strategic profit taken by smart money.
Bitcoin HODL WavesHi all dear traders!
Today we are going to talk and explain the basic fundamental stuff about Bitcoin HODL Waves, some important key values and how the overall supply impact the market trend.
Let's start!
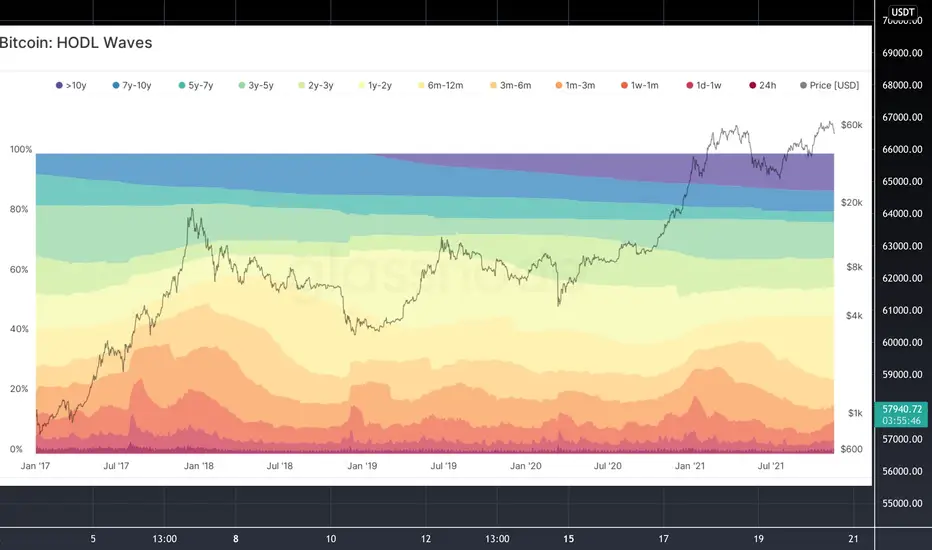
HODL Waves take the entire supply of coins by categorising it out by lifespan and then developing a series of age bands which could be 24 hours to a month or 1 year to 2 years and so on. Moreover, we categorise the entire supply depending on when each UTXO (aka Unspent Transaction Output ) was created. All existing Bitcoins have UTXO, therefore all Bitcoins have an age, however, this age tracks not from the first mined bitcoin, but when it was last used in a transaction.
Fine? Okay, let's dive deeper!
How can we distinguish and understand the coin supply age? Well, by categorising coin supply by lifespan, it provides us with a relative view on the age of the supply which gives a clear picture where a proportion of old coins versus young coins make a change in the trend of these bands along with accumulation patterns which happen on the market.
A) Relative supply age (proportion of the old coin vs young coins)
B) Macro spending accumulation pattern
Key values:
A) Let's assume that younger bands are expanding in size with a larger proportion of supply, what does it tell us? What happens with some of those older coins? You're right, older coins are being spent which mean they are turning from old to new what has a big impact on liquid supply (obviously, it's increasing).
B) Now it's your turn to guess what happens with younger coins when older bands expand. Are investors in an accumulation mode? Young coins get mature by day and months and move into old coins.
MUST KNOW: Warmer colours represent younger coins at the bottom, while cooler colours show us multi-year-old coins. Keep in mind that coins that have been dormant for over 10 years highly like already been lost.
So, if we look at warmer bands up to 6 months we see that during periods of market volatility older coins are likely to be spent into market strength and gain some profits. Contrarily, as the market follows the bear trend we see a reduction in those young coins which means those coins are going into dormancy, therefore accumulation behaviour prevails. During the bull market, long term investors tend to spend their old coins to gain some profits, converting them from an old state to a young state, where you can see increasing the warmer colours of the hodl waves.
Older coins tend to be reduced during the bullish market, and during the bearish market, we get swelling of these older bands as those younger coins essentially mature to become older over time.
Now, let's take a look at the current situation with Bitcoin.
Let's check the last news from Cointelegraph:
"Despite strong gains and equally strong corrections in 2021, those who entered the market or added to their positions in or after November 2020 are refusing to sell.
Hodl Waves, which tracks the age distribution of unspent transaction outputs (UTXO), show that the supply controlled by those six-to-12-month “hodlers” has increased — from 8.7% at the start of June to 21.4% as of Nov. 17.
At the same time, coins held for multiple years have decreased only slightly, highlighting that modest selling has taken place and that, except for the six-to-12-month group, investors’ resolve remains steadfast."
As Cointelegraph reported, only a few BTC owners intend to sell at current prices, even as these circle all-time highs.
So the group of 6-12 months traders (21,408%) have the intention to sell but long term holders still keep their coins and refuse to sell during the current peak.
P.S. inspired by Glassnode tutorial
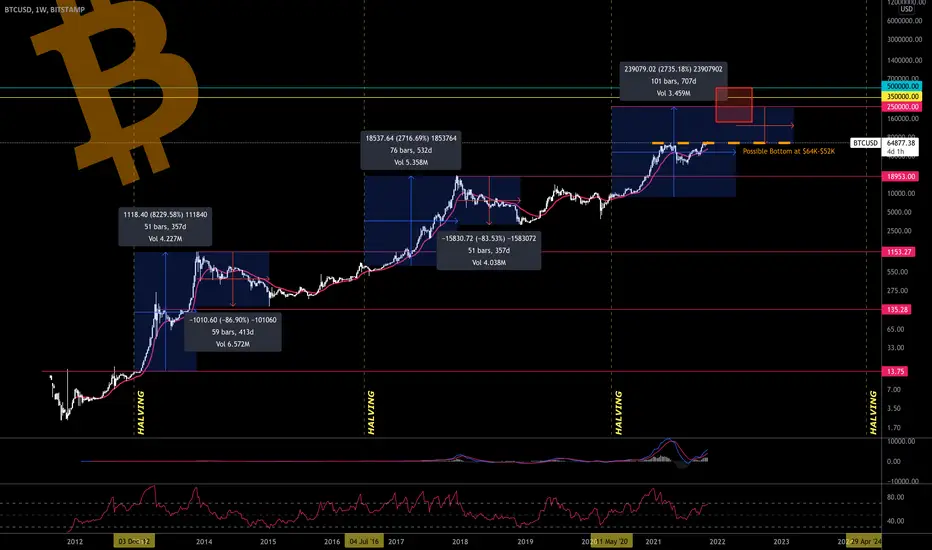
A clear path for Bitcoin - Extending Cycles.Bitcoin is programmed math - therefore i believe trends are easier to recognize and distinguish (especially when cross referencing on-chain analytics).
Here's the LONG story short:
I measured the amount of days from the halving to the cycle top, which gave me an ~33% increase.
I then added the 33% to the 2017 cycle which equals ~707 days.
This puts Bitcoin's market cycle top for 2022 around April 18th.
The Red Box indicates the general area in which I believe Bitcoin can top out in (Jan 22 - July 22).
$250k is possible but to early to tell - on-chain gives more accurate top indications as the time nears.
As for the 350k and 500k are the price predictions from other analysis of those who I will not name.
That being said, $100k-$150k are also possible tops. How quick price accelerates nearing the end of the cycle will indicate just where we may top out in the cycle.
Currently, we're experienced a mid-cycle top at $64K - this is where i believe the floor will be during the bear market that supersedes the Blow Off Top this cycle.
The end!
let me know what you think
x
BTC FIBBTC BLOWOFF TOP ~DEC20th +-4days
~200k (150k-220k)
Confluence with On-Chain Fractals made by myself UkuriaOC: studio.glassnode.com
NFA

Will bitcoin create ATH in 2022?I predicted this growth from 31k and a lot of people didn't believe it at the time. But when the price reaches this price they still stand outside and wait and buy when the price surpasses the top at 64k. Last week was a bullish week and gave a very good signal according to my prediction.
- For Bitcoin Logarithmic Growth Curves. We see the similarity of 2014 and 2021, this week the price has started to break through 0.5 and I predict it will soon head towards point 1, then BTC price will be around $93k - $100k.
- For the Stock-to-flow model, we can easily see that the price is still below the Stock/Flow threshold. In the past this model worked well to pull the price up and down accordingly.
I have a question for you, are you scared and u only buy BTC with the condition that the price breaks above ATH in the $70k range?

Reversal Onchain Sentiment Indicator (ROSI)This was just a test to see how the tweet looks when publishing. I don't use tradingview to publish often, so experimenting on ways to change that.
Bitcoin Short Setuphi guys. Although not very reliable, I think Bitcoin will return from this range. When we look at the on-chain data, the same similarity was seen on January 20-21. Returning from support, Bitcoin witnessed a larger decline when it encountered resistance. The data match.
Please trade at your own risk.
If it closes above the green channel, stop.
